Briefly: in our opinion, full (250% of the regular size of the position) speculative short position in gold, silver, and mining stocks is justified from the risk/reward perspective at the moment of publishing this Alert.
Gold has mounted a small rally on Friday and silver has risen even more in percentage terms. Should we pay attention to the miners’ decline? After all, they had been lagging behind gold since the late-autumn 2018 gold rally started. They’ve outperformed on Tuesday, so they can make up for it any moment now. Folks, nothing to see here, move along. Can we wave this sign that comfortably away?
It was never our point to write a “we told you so” phrase below all charts that we cover, but it is difficult to avoid doing so today. The situation is developing in tune with the previous patterns, in tune with our previous analyses and we simply can’t report it otherwise. Let’s begin with gold’s big picture.
Gold and the Big Picture
Last Wednesday, we wrote the following:
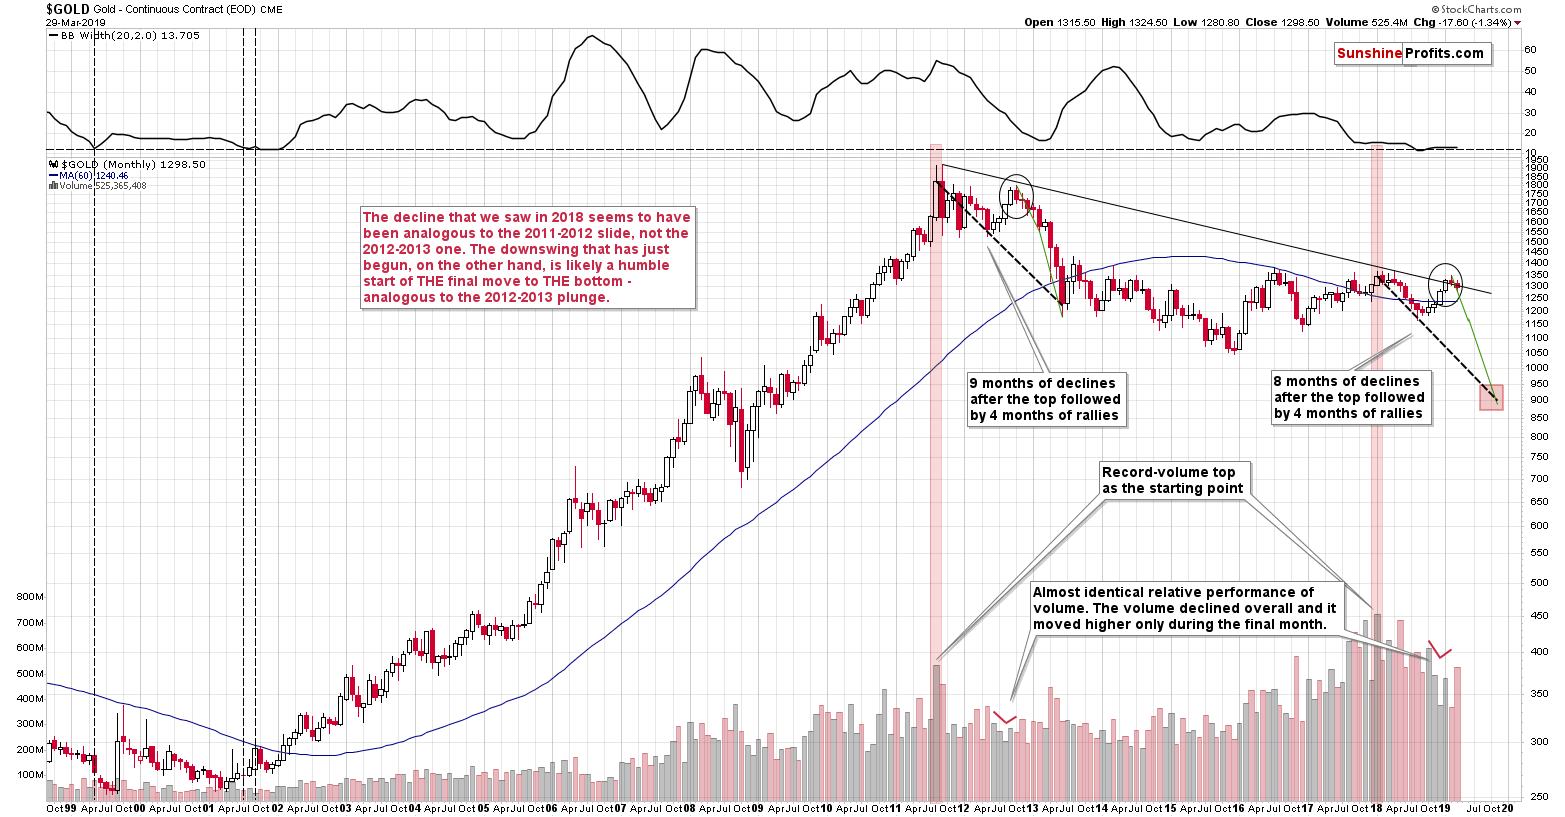
The second month of declines in late 2012 was the one when there were moves up and down, but overall gold didn’t move much lower on a closing basis. We can say something similar about March. Gold is down just $1 this month, which fits the above analogy very well. If it wasn’t for the Fed’s shocker, we would have probably seen lower gold prices instead. In this way, gold would have caught up with the pace of decline from late 2012, when in the first one to two months of the decline, it erased its last month of gains. Then again, we still have four more sessions left in March, so gold might still move lower after all, catching up with the average monthly pace of the decline that we have witnessed in 2012.
The above includes a typo, as there obviously were just three sessions left until the end of the month, but the main point remains the same. Thanks to Thursday’s slide gold caught up with the pace of decline from 2012. Taken together, the last two months of declines have almost erased the preceding monthly rally – exactly the same thing happened in late 2012. In the following months, the decline simply continued.
There is one more thing that we would like to point your attention to – the volume. The red “v” marks on the chart show the analogous action during both final rallies: the mid-2012 and the recent one. We discussed this similarity when we previously featured this analogy, and after we did, we saw yet another volume reading. It’s also analogous – the second month of the decline was accompanied by relatively high volume in both cases: now, and in late 2012. The implications remain bearish.
Let’s zoom in a bit, while staying more or less in the long-term area.
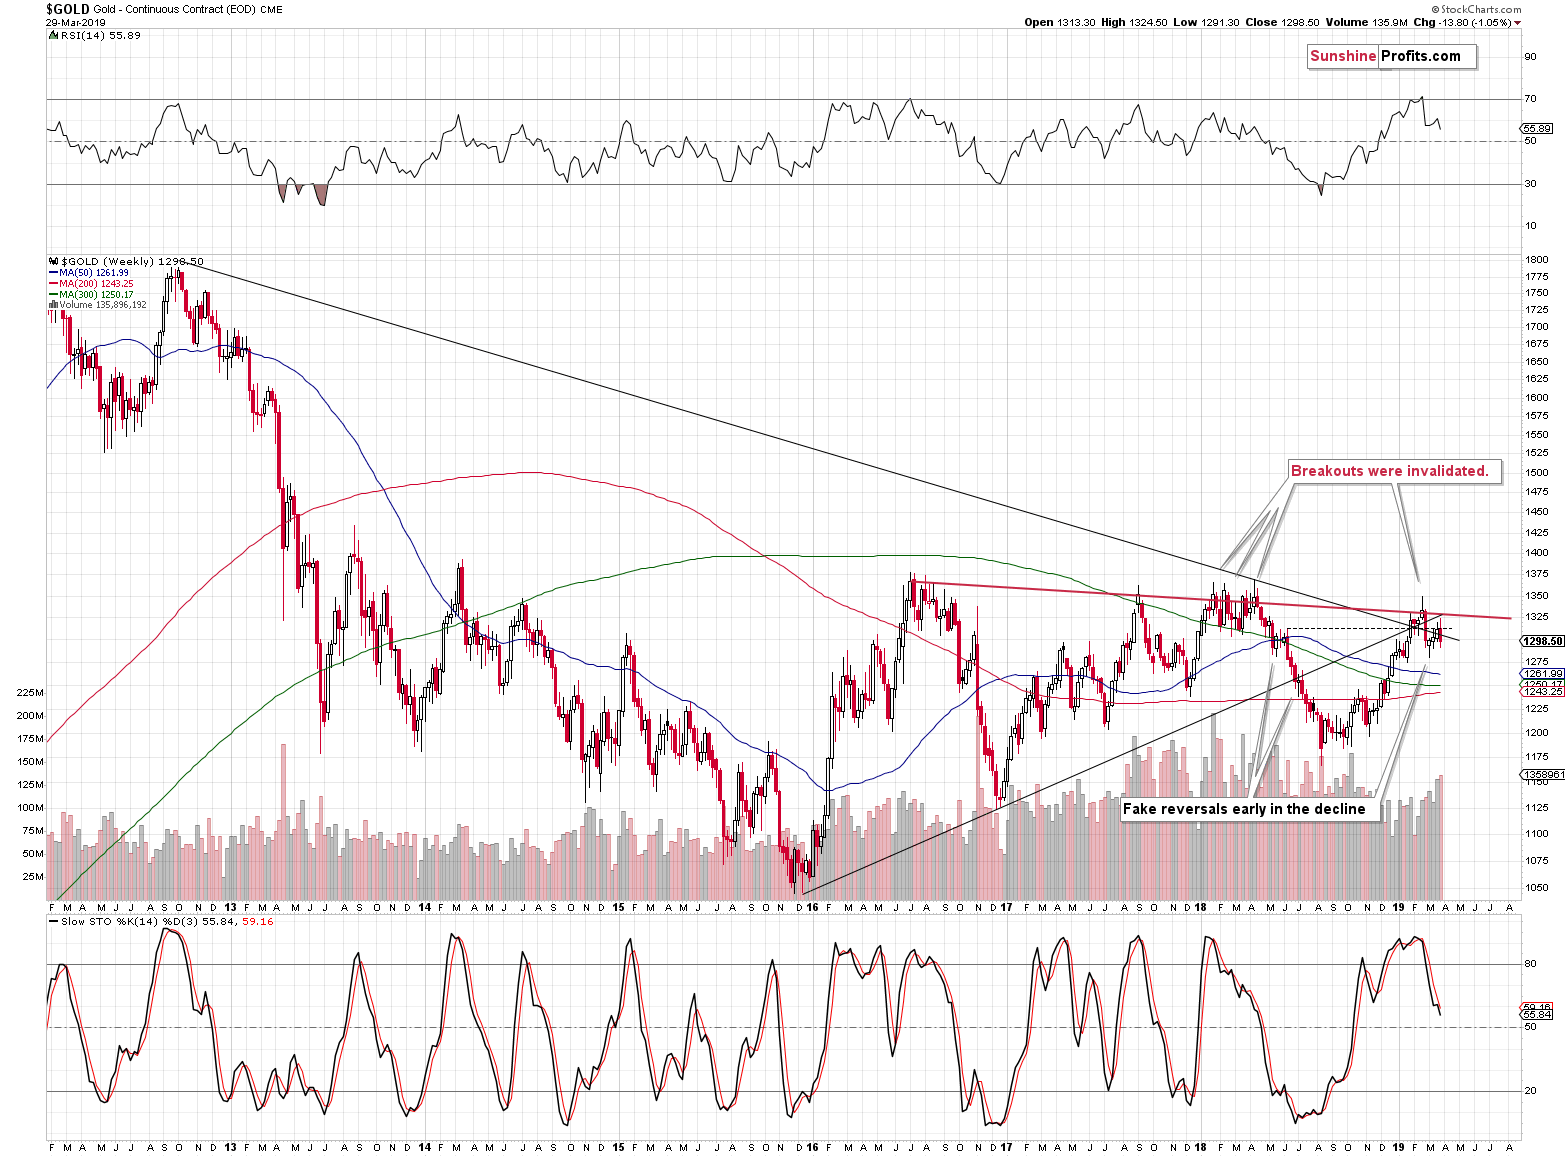
The above weekly gold chart shows that gold declined on very strong volume last week - the biggest we've seen this year. This is a very important bearish confirmation. Gold was supposed to soar based on the dovish remarks from the Fed. Not only was its reaction muted, but gold actually erased all the post-announcement gains and then some more. And it did so on huge volume, thus showing just how strong the bearish forces currently are.
In other words, a weekly decline on strong volume is bearish on its own, but the bearish implications of the context (gold should have soared) make it much stronger.
The short-term rally failed and it’s now clear that a major top was indeed formed at the vertex of the long-term triangle, just as it was confirmed by the small breakout’s invalidation (you will find more details in the Feb 7th Alert).
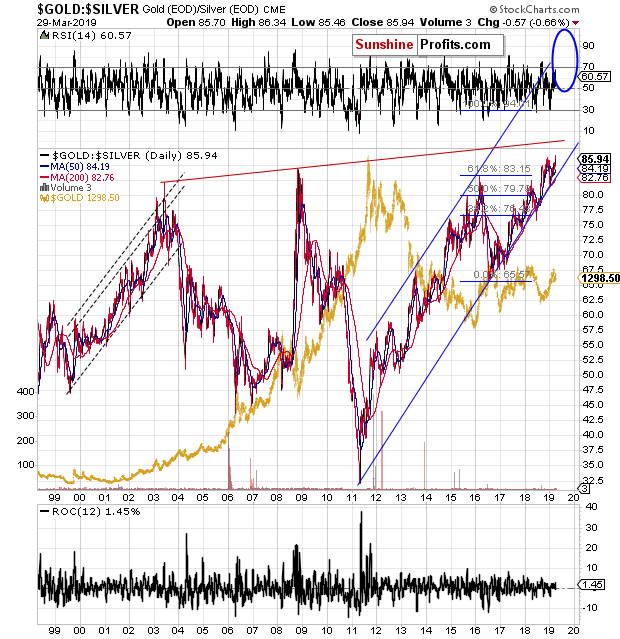
If it’s not clear that a major shift is happening on the precious metals market right now, please consider the gold to silver ratio.
We wrote about the strength in the ratio on multiple occasions, emphasizing that the true long-term resistance in it is not – as the gold promoters claim – at the current levels, but at about 100.
Last week, the gold to silver ratio moved to new highs. Instead of plunging, just like it used to do in the previous cases when it moved to about 85, the ratio paused, corrected a bit and it’s now breaking to new highs. A confirmed breakout above the previous highs is one of the most bullish set-ups for any market, index, or ratio and that’s what we have right now in the gold to silver ratio.
The sharp upswings in the ratio usually take place along with major declines in gold and silver. That’s exactly what happened in 2008 and late-2015 – early-2016. The above-mentioned confirmed breakout suggests that we are about to see a big rally. This suggests a big decline in the prices of PMs. And quite likely, the final bottom. Why would the rally in the ratio be big? Because of the importance of the resistance that was just broken and the fact that there is no serious resistance all the way up until 100.
Let’s change the perspective for additional clues.
Gold and the Foreign Currencies Picture
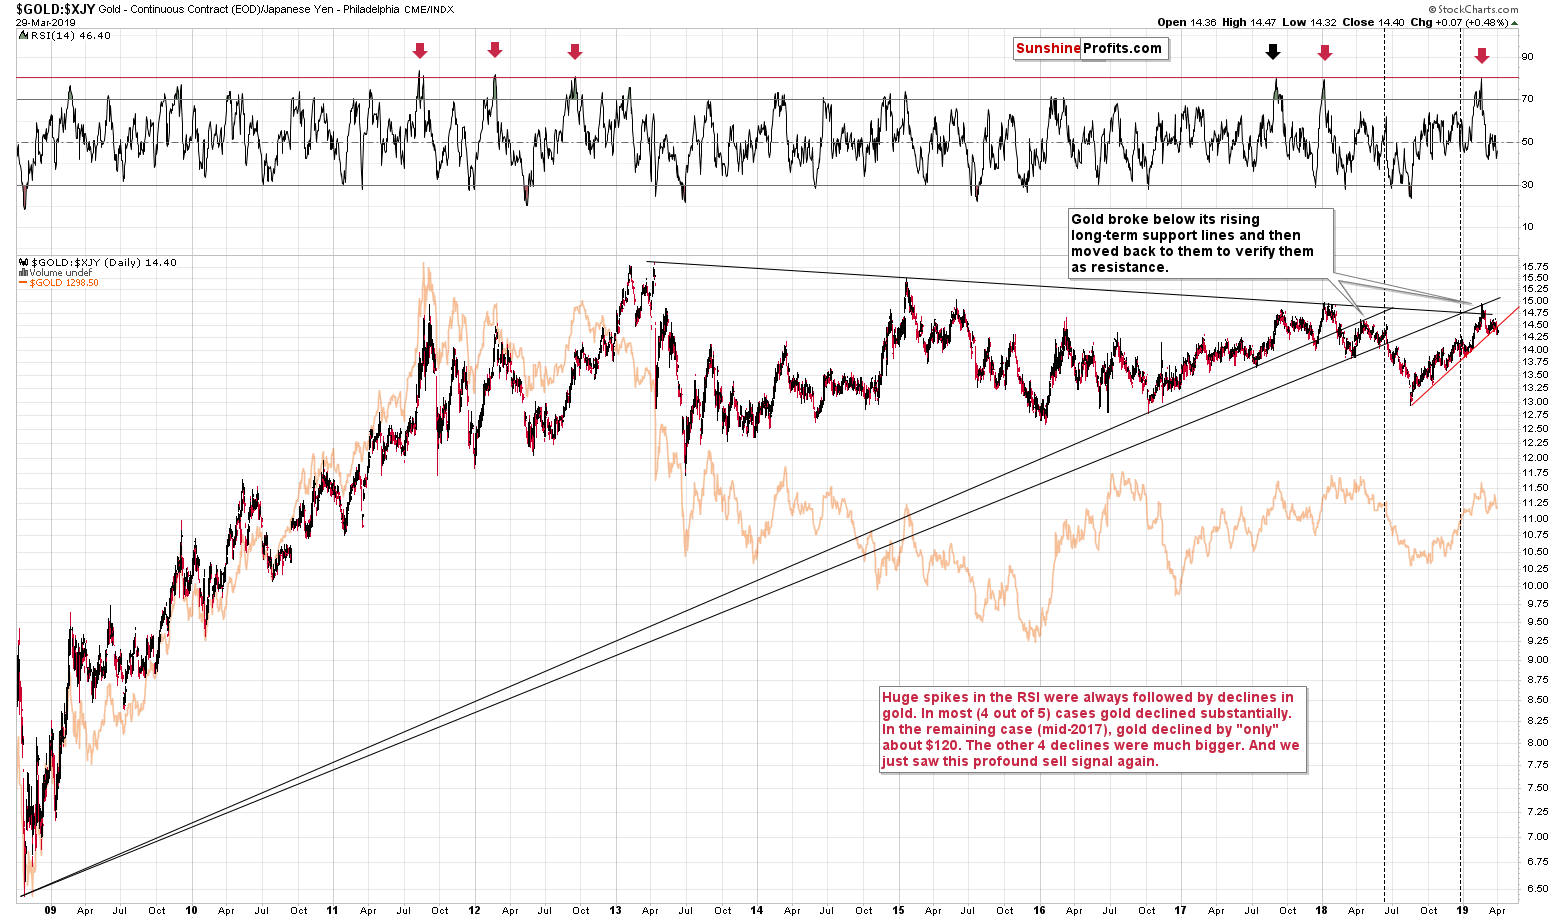
As far as gold’s price in the Japanese yen is concerned, we previously wrote the following:
Looking at gold’s price in terms of the Japanese yen, we see that gold is currently trading very close to its rising red support line based on the previous lows. The lows are more aligned to the rising line in case of the yen perspective, than in the case of our regular USD view, so any breakdown here is likely to be quite meaningful.
And we are likely to see one based on the factors that we are writing about today, and what we have discussed previously. In particular, please note that gold’s reaction to the moves in the USD Index may be delayed, but it’s extremely unlikely to be absent. And the USD Index has practically already told us what it’s about to do next.
And it happened. Gold broke below the clearly defined rising support line. It moved a bit higher on Friday, but it was likely just a breather. Gold didn’t manage to even move close to the previously broken support line.
The short-term trend changed. Now, some may say that this will be just another small (or average at best) move to the downside that is followed by an even bigger rally. We disagree. This time, it seems that we have the USD Index breaking much higher and that should make gold’s decline much bigger than what we have seen in the past few years.
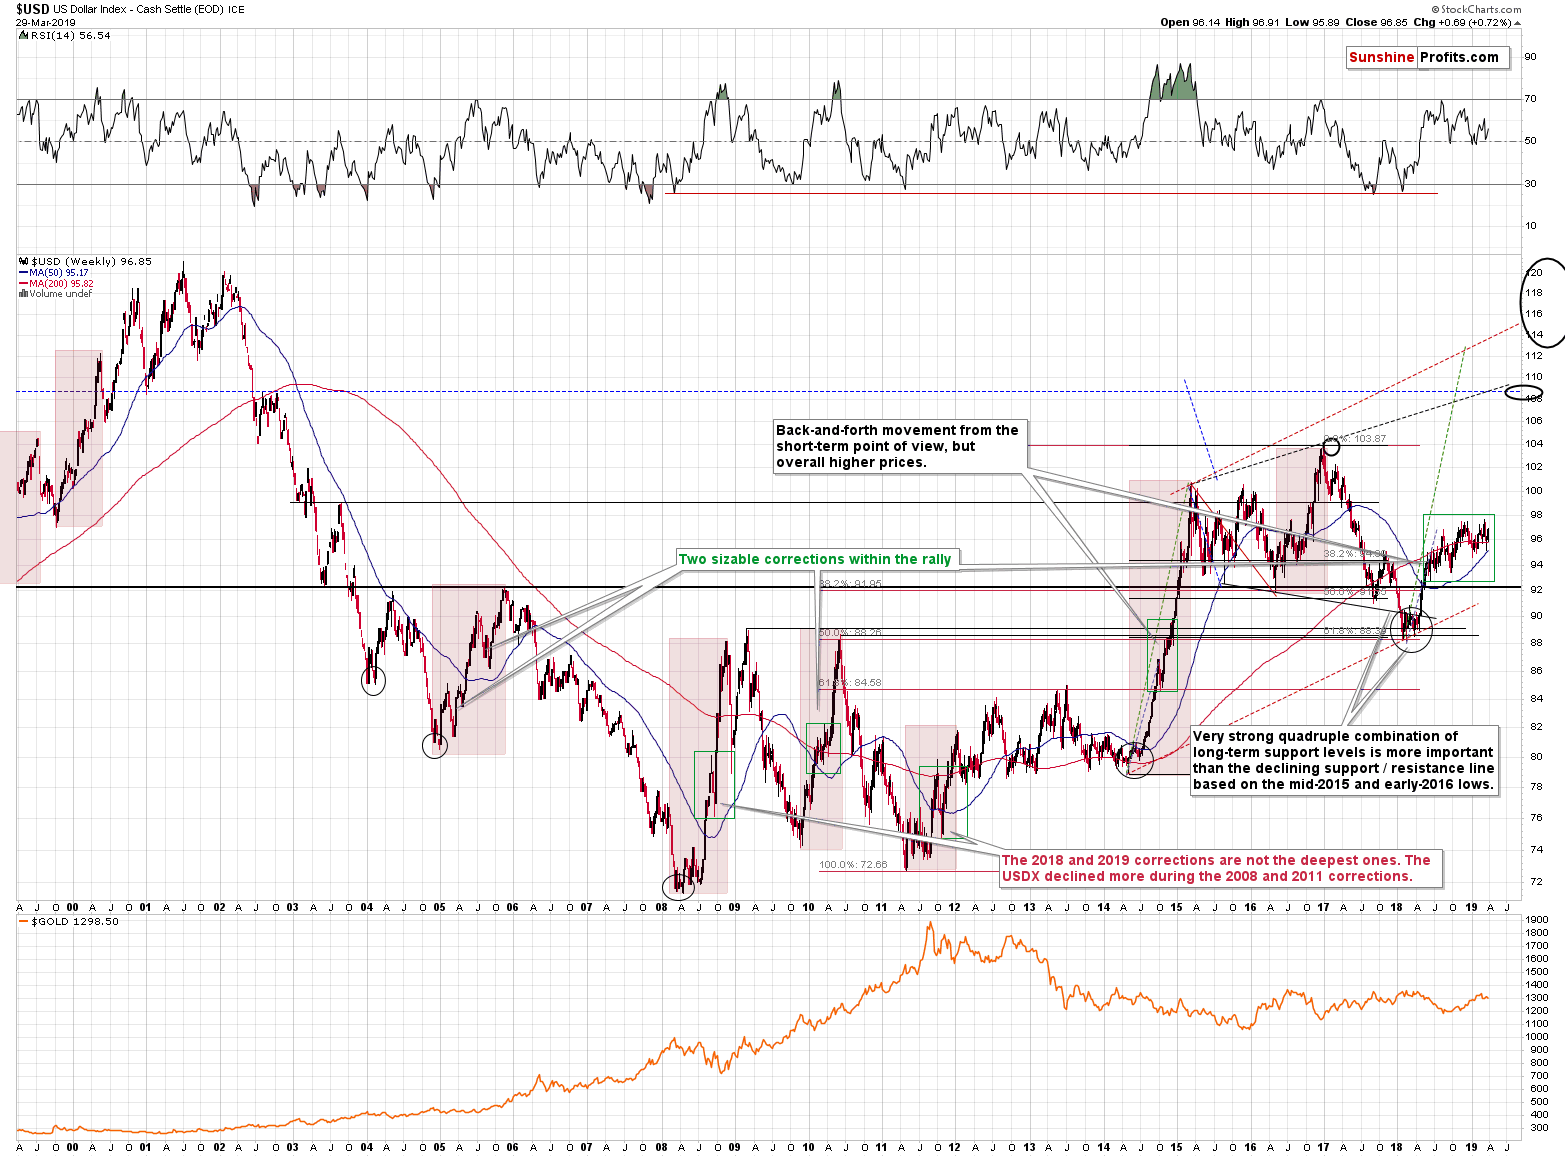
The USD Index is in a long-term and medium-term rally. And it’s about to break above the previous highs, which is going to trigger another powerful wave higher, similar to the one that started in early 2018.
How do we know all that? Well, nobody knows anything with 100% certainty for any market, but the latest reaction in the USDX is extremely revealing. The Fed provided a dovish shocker and USDX declined only very initially. It reversed almost immediately and rallied shortly thereafter. It’s already above the pre-Fed-announcement levels. The USD Index just proved that it will not decline even in light of very powerful bearish news. And those who wanted to sell their US dollars, have likely already did so right after the Fed’s announcement. This suggests enormous strength beneath the surface and the technical set-up suggests that we are about to see it.
The technical set-up is the running correction that the USD Index formed after ending the early-2018 rally. The market was simply too strong to form a regular correction that would erase half or perhaps 61.8% of the previous rally. No. The USD Index even made attempts to break higher during the correction. This has been an indication of strength and the recent reaction to Fed’s dovish shocker proved it. The outlook for the USDX is very bullish and this has profoundly bearish implications for the precious metals market.
If you’ve been wondering why gold is not likely to end its decline close to $1,240 even though it’s quite possible that we’ll see a correction from these levels, the above chart provides the reply. Gold just showed that it’s not ready to rally by refusing to soar after Fed’s dovish surprise, and it’s now catching up with the USD Index in terms of the recent movement. If USDX is about to move well above the previous highs, and then well above the 100 level, it’s simply very unrealistic to expect gold to decline only to $1,240. This level may trigger a notable pause in gold’s medium-term decline, but it’s very unlikely to end it.
Let’s take a look at the very short-term price changes.
Gold, Silver and Miners in the Now
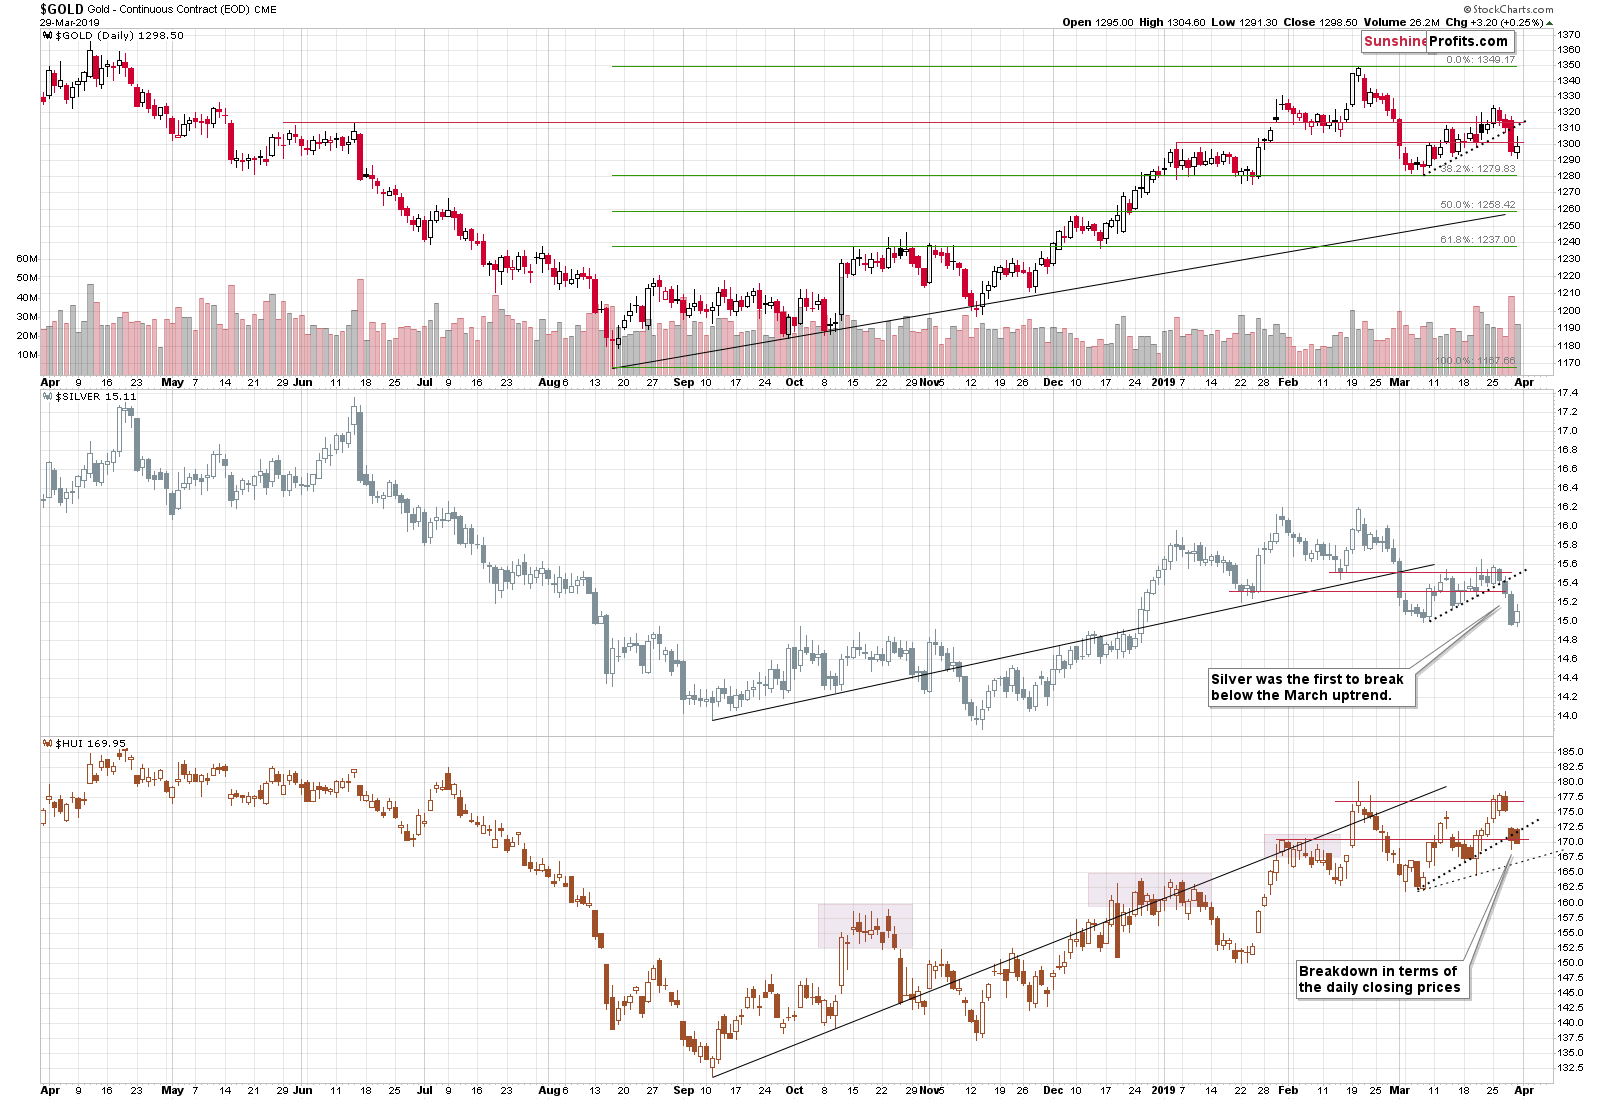
Not much has happened but what had happened, is still a useful sign. You see, gold miners underperformed, and silver outperformed. The latter was just slight outperformance, but still notable on an intraday basis. The implications are quite clearly bearish, because both: miners’ weakness, and silver’s temporary strength, are things that we see before price declines.
Gold miners also ended the day (and week) below the rising support line that’s based on the previous lows in terms of the closing prices. Miners have yet to break below the line based on the intraday lows, but the above is already a bearish indication.
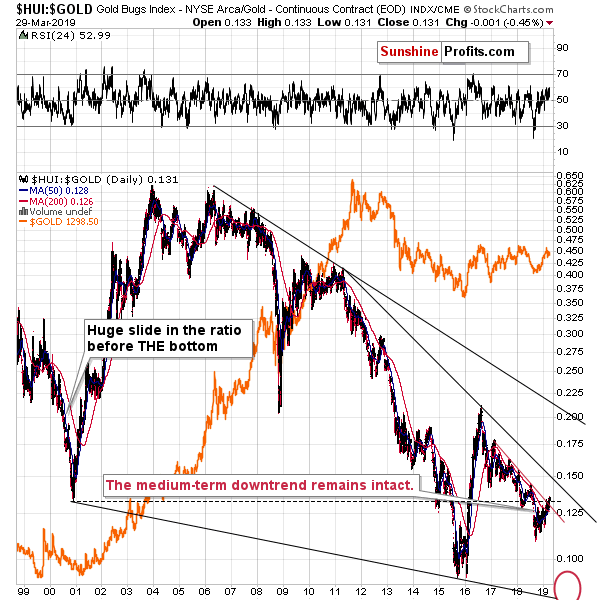
We previously wrote that the miners’ underperformance is likely to return as the recent strength appeared to be nothing more than a short-term phenomenon. Last Monday, we wrote the following:
Looking at the last 20 years of the HUI to gold ratio performance, it’s clear that the trend has been down since about 2006. In particular, the stable downtrend started in 2011 after gold topped. The 2016 rally was an exception that was followed by decline’s continuation. The miners to gold ratio moved a bit higher this year, but it appears to be nothing more than just a counter-trend rally, just like several similar rallies in 2017 and 2018. The downtrend remains in place. This means that another short-term decline that takes the ratio below the 2018 low appears to be just around the corner.
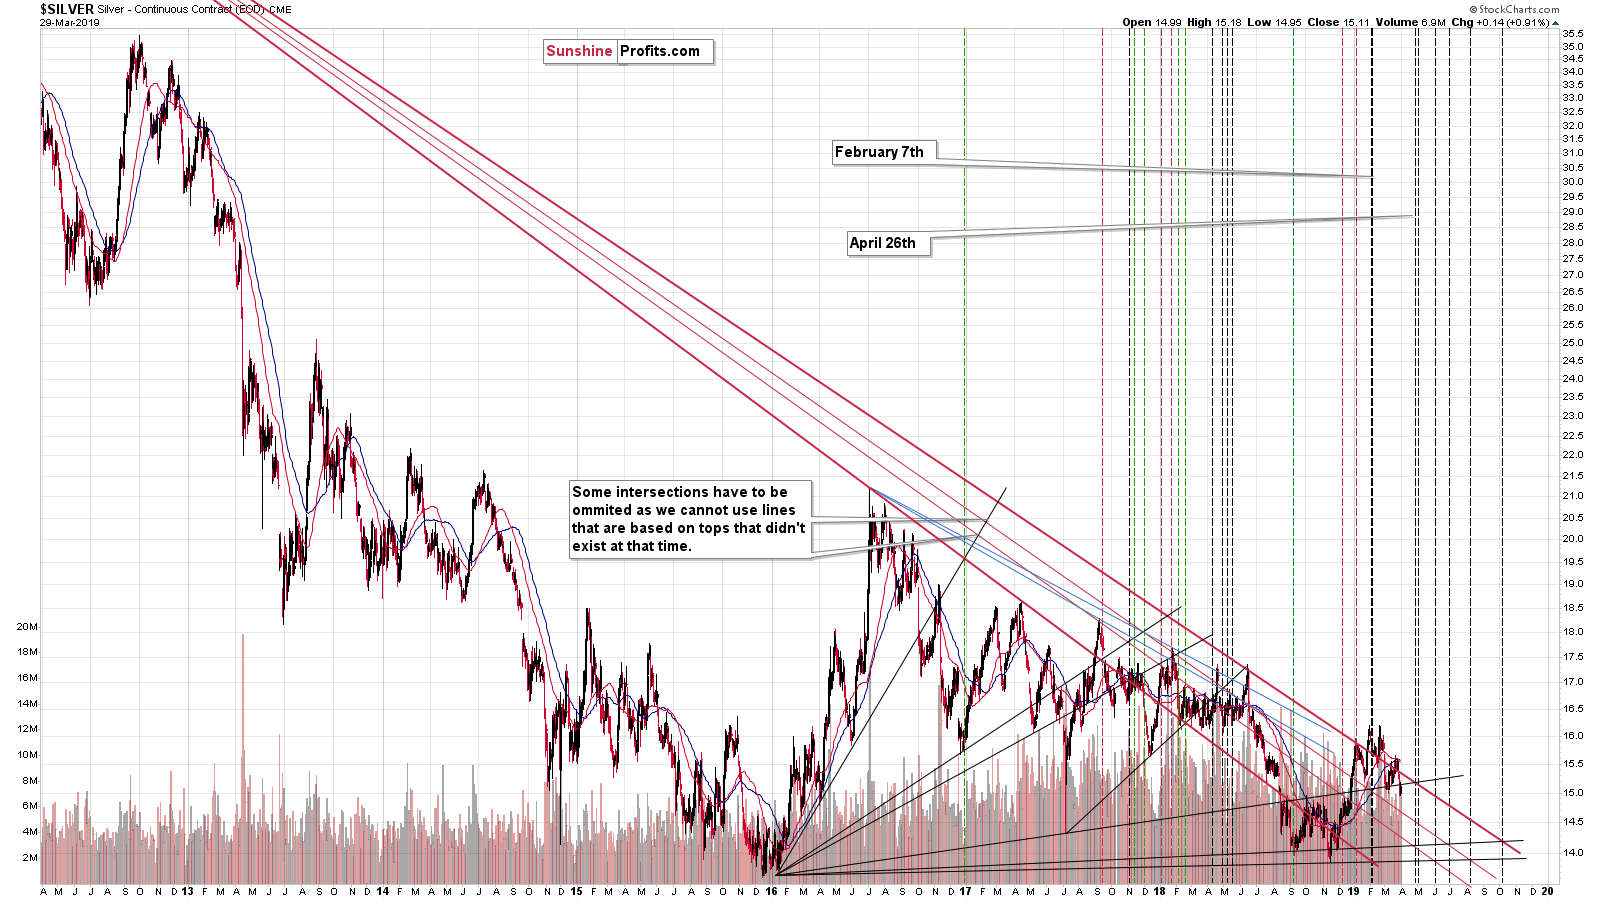
At this point you may be wondering, how long can precious metals keep on declining before we see a visible correction. And silver’s long-term chart provides the reply.
In short, silver, and the rest of the PM sector could decline until the end of the month and start a corrective upswing at that time. There might be some other local rallies along the way (the above chart does not exclude this possibility), but the odds are that an important reversal will take place either in the final part of April or very early in May.
The technique used – the triangle-vertex-based reversals - worked very well on numerous occasions in the past, for instance in early February. One very interesting observation here is that after a period where we had a few triangle-vertex-based reversals, we have a few months where there is no reversal scheduled (at least not based on this technique). We saw something similar in 2018, between May and August. After the initial rally, silver kept on declining for almost the entire time until the reversal was reached. The most recent reversal took place in February and silver started to decline after an initial rally. This suggests that silver may indeed decline for the entire month without a meaningful comeback and rally only after this monthly downswing.
Rare Fundamental and Technical Developments
On the fundamental note, we’ve seen an inversion in the gold yield curve, with the long-term rates dropping below zero. Despite the critical weight of this news, there were zero reaction to this in the mainstream media.
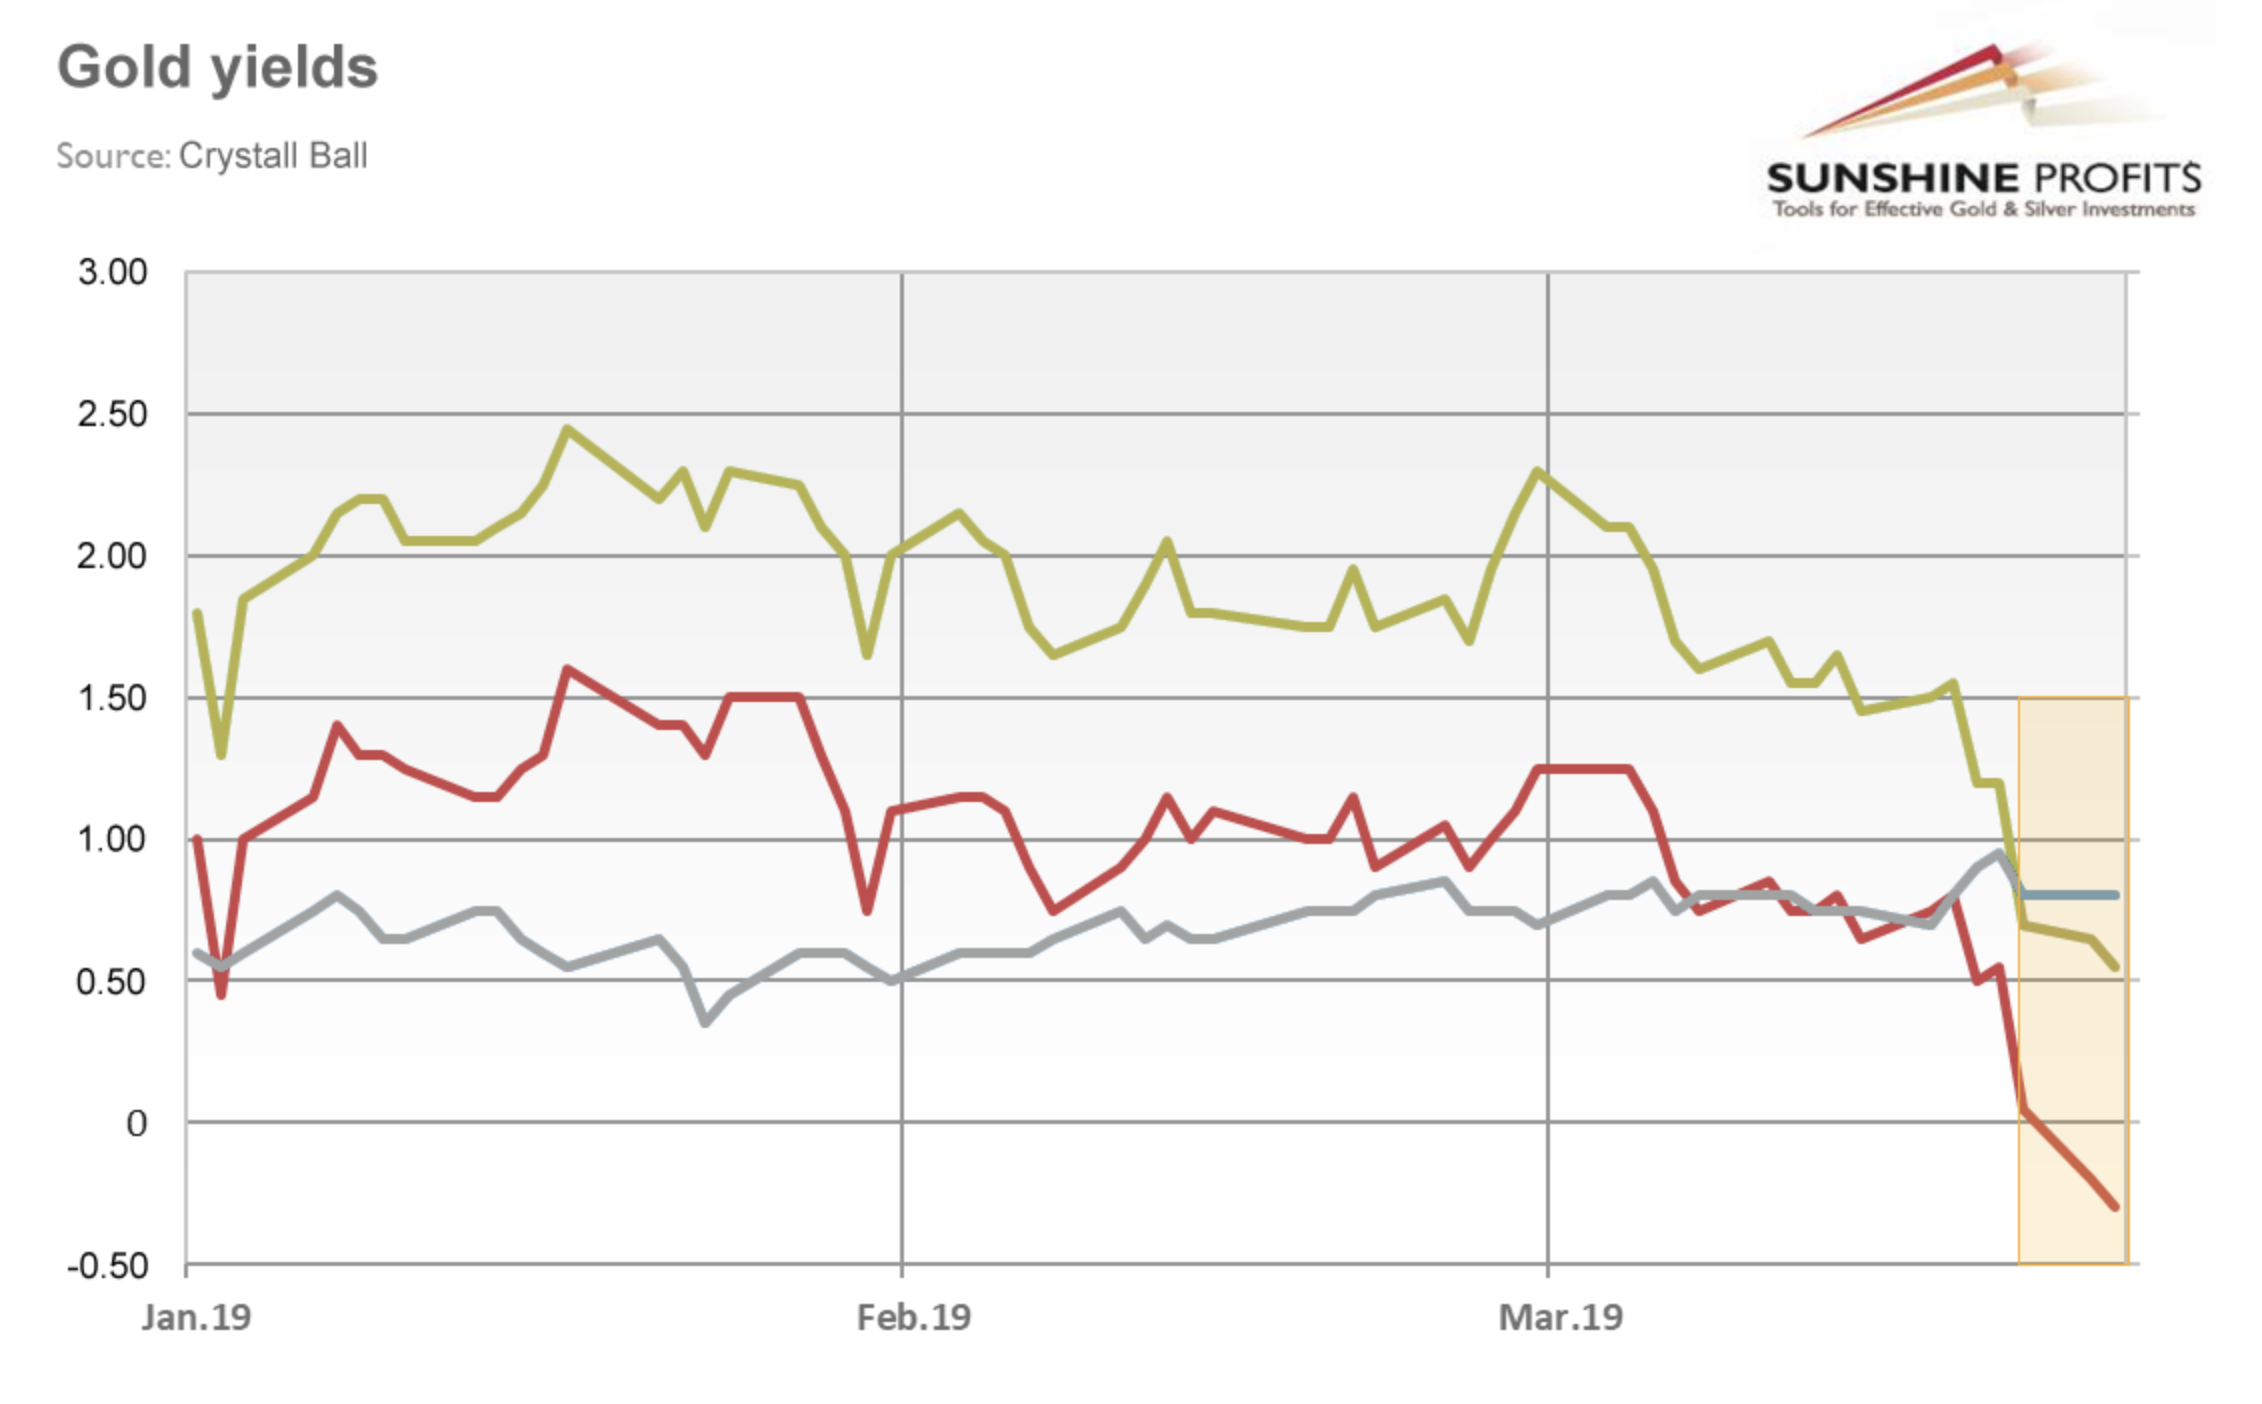
The inversion by itself is an uncommon phenomenon, but what is truly breathtaking is the move below 0 in the long-term gold rates. This stealth introduction of the GNIRP (gold negative interest rate policy) in case of long-term rates may influence the precious metals market in a profound manner as thousands of investors rush to the nearby banks to deposit gold for minimum 5 years.
Gold is a sought-after asset class due to the positive cash flow it brings and this event is meant to push out gold investors to the long end of the gold yield curve. Let’s admit it folks, on the short-end of the curve, gold has become a certificate of guaranteed confiscation and therefore it is the only rational choice to part with it for the above-mentioned time horizon as minimum.
In case of gold, the yield is shown for the side of the contract that runs the deposit facility. Normal, positive rates, mean that they charge investors for storing their gold for them. The negative rates mean that they will now be paying investors for the privilege of storing their gold for the long run. Investors, who decide to trust the bank or any other depository with their yellow metal for 5 years or more will receive a monthly payment. Some facilities have already reported record inflow of gold. Hurry up before the storage space gets fully booked out. This is not the time to shop around for a better deal. The spokespersons for the head deposit facilities pledged not to sell the gold received through this program on the open market. It is reported that they failed to prevent automatic winking while making the pledge.
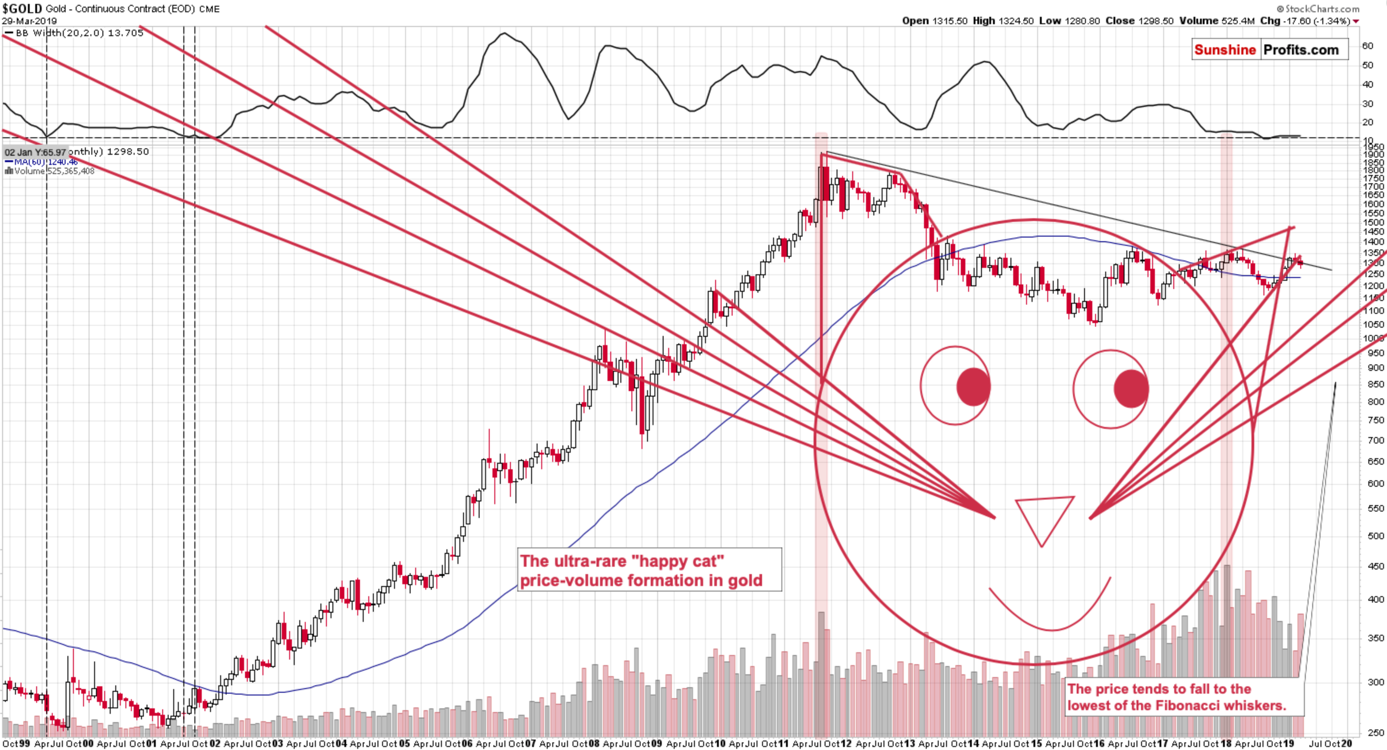
We didn’t feature it previously, but – in addition to technical points that we have made earlier – gold also created an ultra-rare “happy cat” formation.
The formation is very difficult to spot, because the cat’s head is based on both: price and volume readings and they very rarely align to create it. The ears of the cat are based on the medium-term price moves and its body is based on a long-term bull market. The cat’s tail is the final part of the preceding downtrend (here: the action that we saw before 2001).
The cat’s right ear should ideally be higher than the left one – this factor increases the pattern’s reliability. The cat is always looking into the future and it’s looking at the future bottoming prices. The look alone is not a particularly precise technique, because the cat’s interested in what’s going on and his eyes are wide open – it’s difficult to tell what he’s really looking at. It’s actually analogical to the horse’s perception of the term “now”: it’s really now and it means forever. Fortunately, the above technique can be supplemented by the use of the Fibonacci whiskers.
The whisker should start at the time of the most recent medium-term bottom and it should be based on the most recent high. After applying the above, the lowest whisker is the line to which gold is likely to – approximately – move before the final bottom takes place. Combining both techniques point to the proximity of $900 as the next long-term target for the price of gold in the second half of the year.
Unfortunately, the formation doesn’t provide any details with regard to the shape of the decline as cats can be quite unpredictable in the short run. The same for horses.
Be sure to check the date, before acting on anything from this particular section of today’s Alert As every year, we couldn’t help it, sorry for the possible confusion. The above “rare” section is the only place where we were not serious – everything else remains valid and up-to-date.
Summary
Summing up, it’s almost certain that the next big move lower has already begun and that the 2013-like slide is in its early stage. Gold’s and miners’ very weak reaction to Fed’s surprisingly dovish remarks strongly confirms the bearish outlook for the following weeks and we can say the same thing about the size of yesterday’s decline in gold and volume that accompanied it.
As we explained last Friday, if gold declines to $1,240, this might be an opportunity to go long, but it’s too early to say for sure at this time. We would like to emphasize that this level is likely to trigger a corrective upswing at most – it’s extremely unlikely to be the end of the entire medium-term decline.
To summarize:
Trading capital (supplementary part of the portfolio; our opinion): Full short position (250% of the full position) in gold, silver, and mining stocks is justified from the risk/reward perspective with the following stop-loss orders and exit profit-take price levels:
- Gold: profit-take exit price: $1,062; stop-loss: $1,357; initial target price for the DGLD ETN: $82.96; stop-loss for the DGLD ETN $39.87
- Silver: profit-take exit price: $12.32; stop-loss: $16.44; initial target price for the DSLV ETN: $47.67; stop-loss for the DSLV ETN $23.68
- Mining stocks (price levels for the GDX ETF): profit-take exit price: $13.12; stop-loss: $24.17; initial target price for the DUST ETF: $76.87; stop-loss for the DUST ETF $15.47
Note: the above is a specific preparation for a possible sudden price drop, it does not reflect the most likely outcome. You will find a more detailed explanation in our August 1st Alert. In case one wants to bet on junior mining stocks’ prices (we do not suggest doing so – we think senior mining stocks are more predictable in the case of short-term trades – if one wants to do it anyway, we provide the details), here are the stop-loss details and target prices:
- GDXJ ETF: profit-take exit price: $17.52; stop-loss: $35.67
- JDST ETF: initial target price: $143.87 stop-loss: $30.97
Long-term capital (core part of the portfolio; our opinion): No positions (in other words: cash)
Insurance capital (core part of the portfolio; our opinion): Full position
Whether you already subscribed or not, we encourage you to find out how to make the most of our alerts and read our replies to the most common alert-and-gold-trading-related-questions.
Please note that the in the trading section we describe the situation for the day that the alert is posted. In other words, it we are writing about a speculative position, it means that it is up-to-date on the day it was posted. We are also featuring the initial target prices, so that you can decide whether keeping a position on a given day is something that is in tune with your approach (some moves are too small for medium-term traders and some might appear too big for day-traders).
Plus, you might want to read why our stop-loss orders are usually relatively far from the current price.
Please note that a full position doesn’t mean using all of the capital for a given trade. You will find details on our thoughts on gold portfolio structuring in the Key Insights section on our website.
As a reminder – “initial target price” means exactly that – an “initial” one, it’s not a price level at which we suggest closing positions. If this becomes the case (like it did in the previous trade) we will refer to these levels as levels of exit orders (exactly as we’ve done previously). Stop-loss levels, however, are naturally not “initial”, but something that, in our opinion, might be entered as an order.
Since it is impossible to synchronize target prices and stop-loss levels for all the ETFs and ETNs with the main markets that we provide these levels for (gold, silver and mining stocks – the GDX ETF), the stop-loss levels and target prices for other ETNs and ETF (among other: UGLD, DGLD, USLV, DSLV, NUGT, DUST, JNUG, JDST) are provided as supplementary, and not as “final”. This means that if a stop-loss or a target level is reached for any of the “additional instruments” (DGLD for instance), but not for the “main instrument” (gold in this case), we will view positions in both gold and DGLD as still open and the stop-loss for DGLD would have to be moved lower. On the other hand, if gold moves to a stop-loss level but DGLD doesn’t, then we will view both positions (in gold and DGLD) as closed. In other words, since it’s not possible to be 100% certain that each related instrument moves to a given level when the underlying instrument does, we can’t provide levels that would be binding. The levels that we do provide are our best estimate of the levels that will correspond to the levels in the underlying assets, but it will be the underlying assets that one will need to focus on regarding the signs pointing to closing a given position or keeping it open. We might adjust the levels in the “additional instruments” without adjusting the levels in the “main instruments”, which will simply mean that we have improved our estimation of these levels, not that we changed our outlook on the markets. We are already working on a tool that would update these levels on a daily basis for the most popular ETFs, ETNs and individual mining stocks.
Our preferred ways to invest in and to trade gold along with the reasoning can be found in the how to buy gold section. Additionally, our preferred ETFs and ETNs can be found in our Gold & Silver ETF Ranking.
As a reminder, Gold & Silver Trading Alerts are posted before or on each trading day (we usually post them before the opening bell, but we don't promise doing that each day). If there's anything urgent, we will send you an additional small alert before posting the main one.
=====
Latest Free Trading Alerts:
Stocks broke above their short-term consolidation on Friday and they got close to the recent local high. The S&P 500 index was the highest since the early October more than a week ago. But then the market traded within a consolidation. Will the uptrend resume today?
Positive Expectations, Breakout Imminent?
=====
Thank you.
Sincerely,
Przemyslaw Radomski, CFA
Editor-in-chief, Gold & Silver Fund Manager


