Briefly: in our opinion, full (300% of the regular position size) speculative short positions in mining stocks are justified from the risk/reward point of view at the moment of publishing this Alert.
The situation in the precious metals market is developing in tune with my previous expectations, so most of what I wrote previously remains up-to-date. There are, however, two particularly important things that just happened.
The first thing is gold’s extreme weakness relative to what the USD Index is doing.
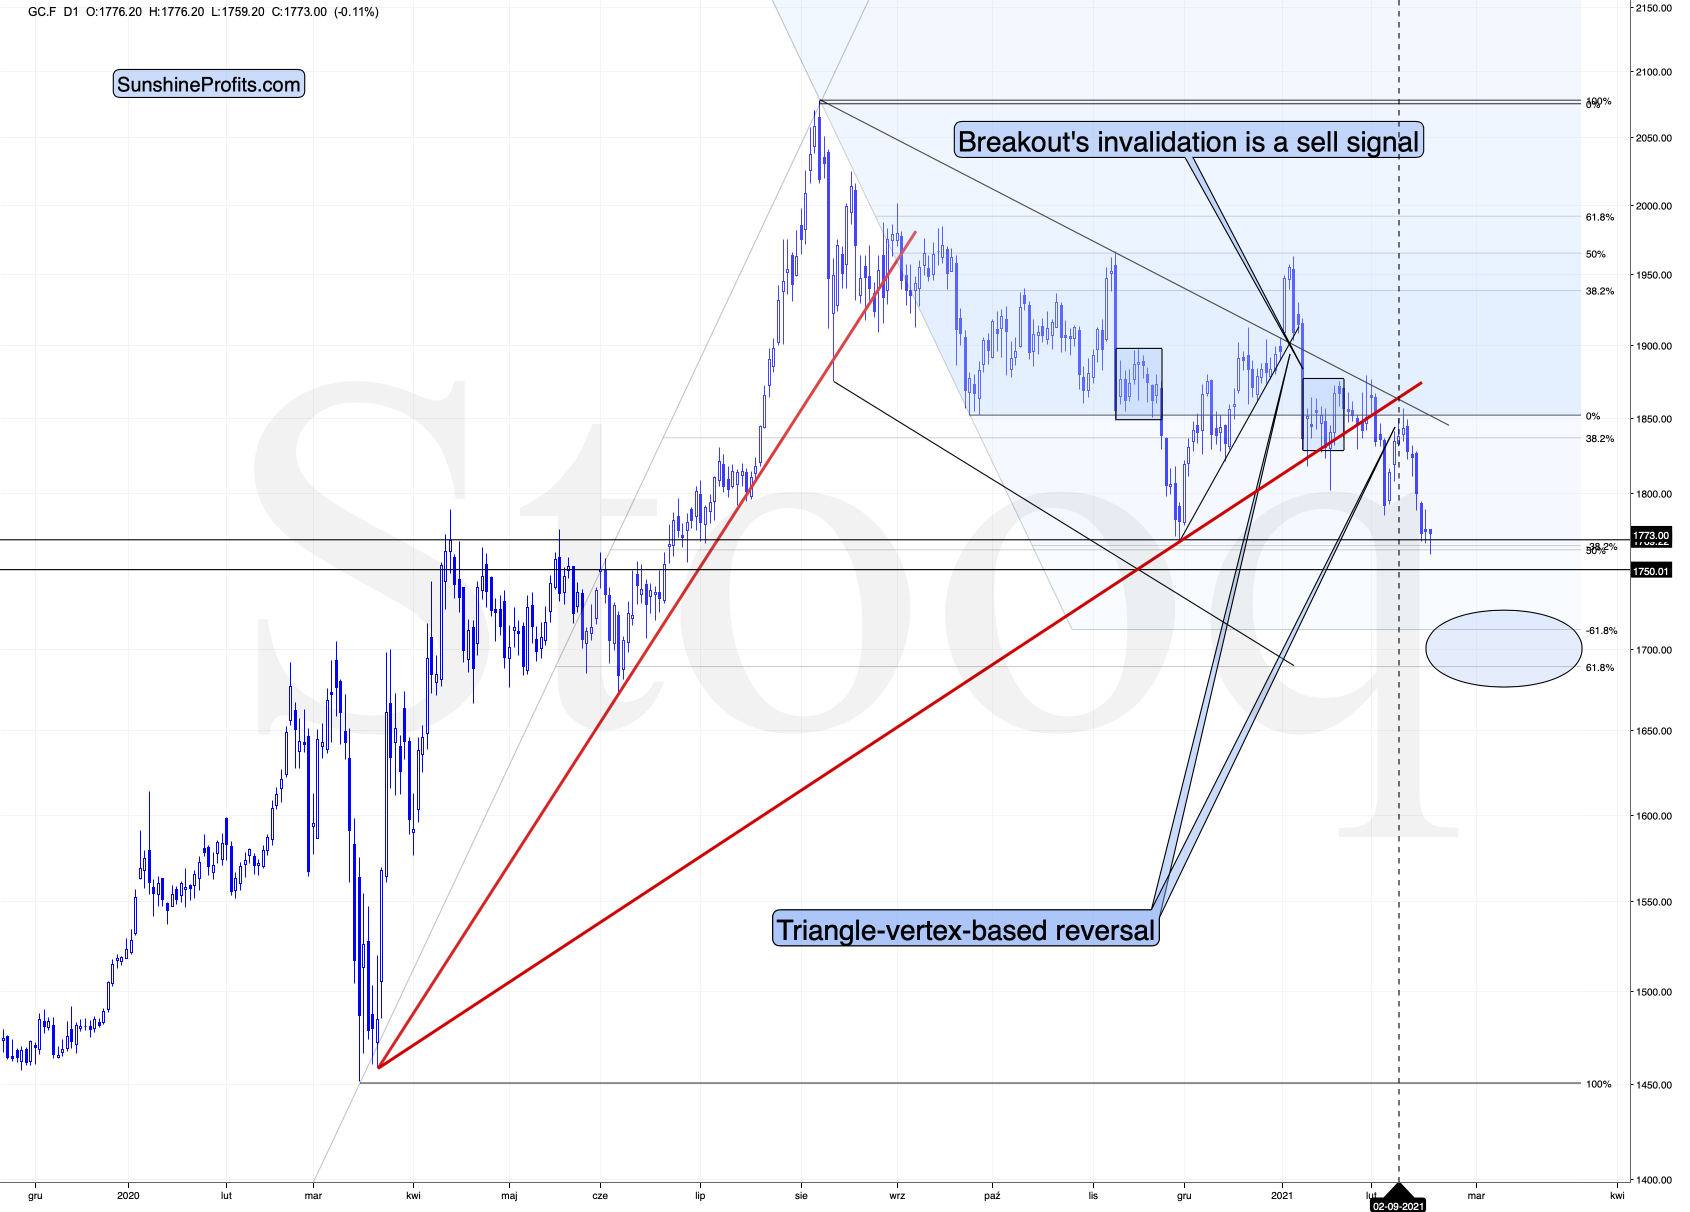
Figure 1 - COMEX Gold Futures
Gold is down by just a little and the shape of today’s candlestick might seem bullish as gold just reversed, but this would likely be a false interpretation.
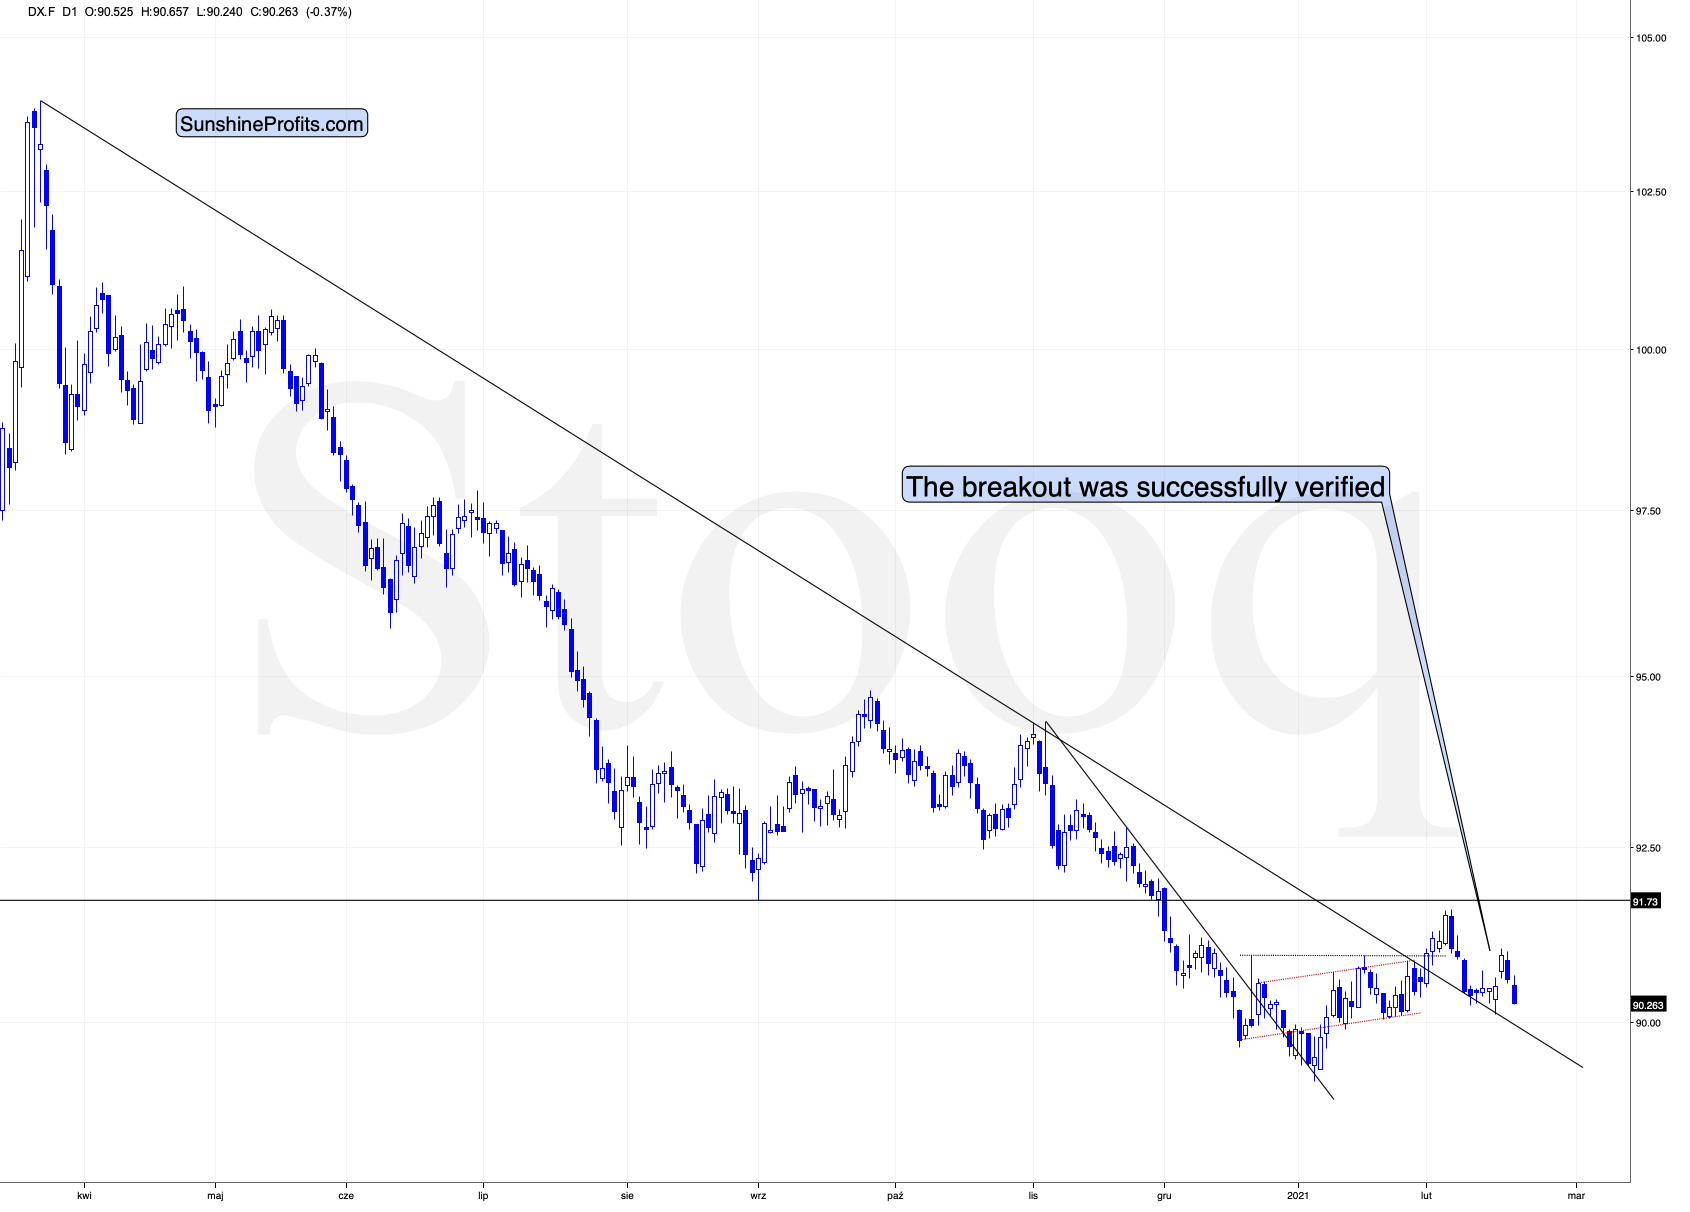
Why? Because the context matters and the context here is that the USD Index declined quite visibly today.
Figure 2 - USD Index
At this point, gold should be rallying and invalidating the breakdown below the recent lows. It’s not doing that at all. In fact, gold didn’t even manage to rally back above yesterday’s closing price. This means that gold is not reversing here, but rather correcting in a very weak way.
Given this kind of weakness it’s very likely that gold would close the week well below the previously lowest weekly close, thus further confirming its breakdown.
In other words, my comments from yesterday concerning gold remain up-to-date:
In early February, gold broke below the rising red support line and it then verified it by rallying back to it and then declining once again. It topped almost exactly right at its triangle-vertex-based reversal, which was yet another time when this technique proved to be very useful.
Gold has just closed not only at new yearly lows, but also below the late-November lows (in terms of the closing prices, there was no breakdown in intraday terms). This means that yesterday’s (Feb. 17) closing price was the lowest daily close since late June 2020. At the moment of writing these words, gold is also trading below the April 2020 intraday high.
Gold was likely to slide based on myriads of technical and cyclical factors, while the fundamental factors remain very positive – especially considering that we are about to enter the Kondratiev winter, or we are already there. As a reminder, Kondratiev cycles are one of the longest cycles and the stages of the cycle take names after seasons. “Winter” tends to start with a stock market top that is caused by excessive credit. In this stage gold is likely to perform exceptionally well… But not right at its start. Even the aftermath of the 1929 top (“Winter” started then as well), gold stocks declined for about 3 months before soaring. In the first part of the cycle, cash is likely to be king. And it seems that the performance of the USD Index is already telling investors to buckle up.
The second major thing that I would like to comment on today is visible in the GDX ETF chart.
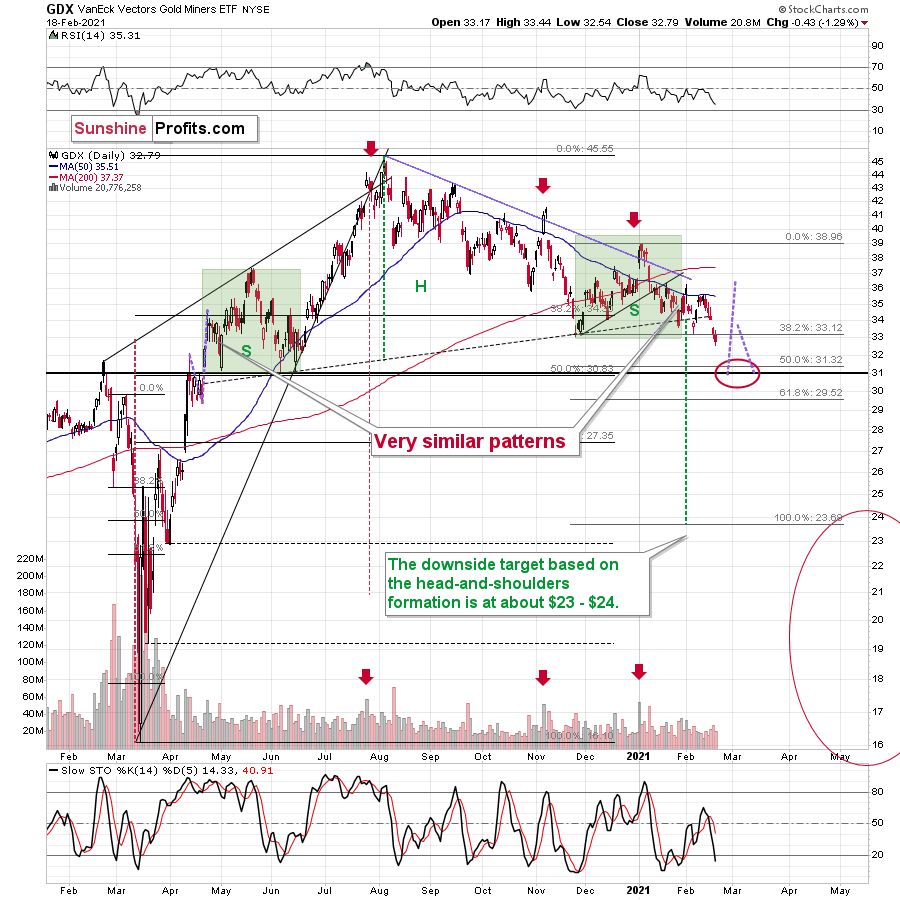
Figure 3 - VanEck Vectors Gold Miners ETF
Namely, the GDX closed the day below the neck level of the head and shoulders pattern for the second day in a row. This is a major development, because that’s the first time that it managed to do so. The previous two attempts were invalidated in the following session. This time already is different, and given today’s pre-market weakness in gold, it seems that the breakdown will also be confirmed by the third consecutive daily close and a weekly close.
Based on the analogies that I described on Wednesday, this could be the beginning of an epic decline.
Still, once the GDX moves to $31 or so, it’s then likely to correct to about $33 - $34. The decline would likely follow right after that.
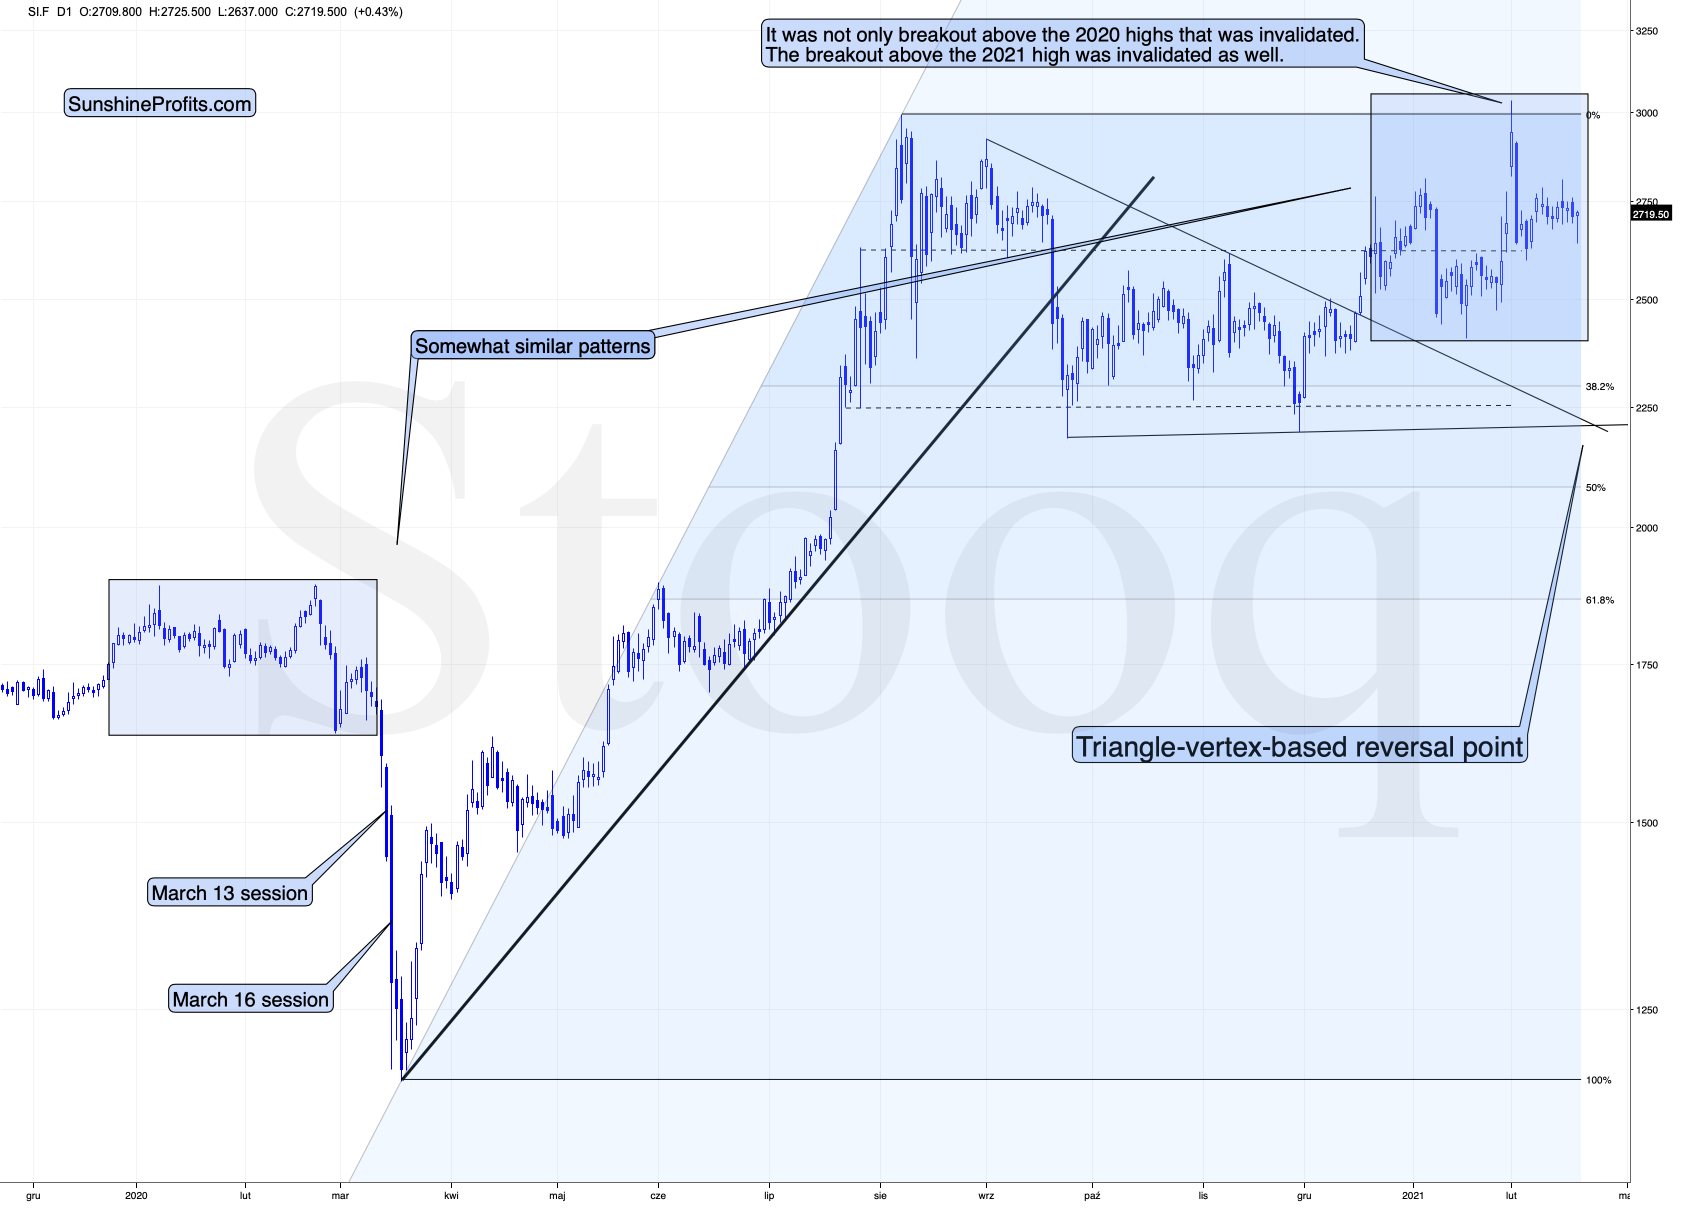
Silver is not doing much today, which is also in tune with what I wrote previously:
Figure 4 - COMEX Silver Futures
Practically everything that I wrote about silver recently remains up-to-date, as the white metal didn’t move much in the last several days. There is one thing that I would like to add today, though – that the price pattern that I marked on the above chart with red appears quite similar. They are not identical, but the overall U-shaped consolidation is present in both cases. Silver is holding up better right now, but that’s likely due to the exposure it just got in various forums.
The above is a good reason for silver to perform well in the following years, but it’s also a reason for silver to behave even more like “silver” during the decline.
More relatively inexperienced investors are holding silver right now. This means that when they panic (as the inexperienced investors tend to during the declines), the price is likely to slide very sharply. But… so far, it’s holding up quite well. This means that the tactic to first profit on mining stocks’ decline and then to switch to silver might be even more profitable than I originally expected it to be.
Given the proximity of the triangle-vertex-based reversal in silver, it could even be the case that silver moves higher one more (final) time before the slide starts. Then again, it could be the case that it declines sharply and bottoms shortly – just like it did in September 2020.
Having said that, let’s consider the broader picture.
Banking on Hope
With the USD Index following its 2017-2018 analogue and likely forming a bottom on Feb. 16, the greenback may officially be back. However, because the EUR/USD accounts for nearly 58% of the USD Index’s movement, slaying the euro is a prerequisite for a move back to 94.50.
But as FX traders continue to ignore the fundamental warning signs, the European banking sector remains on high alert.
Please see below:
Figure 5
If you analyze the chart above, you can see that S&P 500 banks (the white line) have traded sharply higher since September. In stark contrast, European banks (the yellow line) have struggled to keep pace.
Why so?
Well, illuminating the suffering that FX traders are so happy to ignore, European banks are beginning to crumble. To explain, banks – whether in Europe or the United States – are the engines that drive economic growth. As a result, their books are heavily exposed to small business, retail, hospitality, energy, commercial real estate and credit card loans.
And able to see the forest through the trees, European officials warned on Feb. 15 that the Eurozone could be on the verge of “wide-scale corporate distress.” In a document presented to European finance ministers, officials highlighted that 25% of European businesses were in financial trouble prior to the New Year. And with the “underlying deterioration” masked by government assistance, banks’ loan loss provisions may have underestimated the potential impact.
To explain the term, loan loss provisions are funds that banks set aside to cover potential defaults. As you would expect, the larger the balance, the more cushion a bank has to absorb potential losses.
Right now, roughly €587 billion of European loans are in moratoria (meaning payments are postponed). And as the situation escalates, the European Central Bank (ECB) will be forced to pick up the slack. As of Feb. 18, the ECB’s balance sheet stands at 70.7% of Eurozone GDP. In contrast, the U.S. Federal Reserve’s (FED) balance sheet is only 35.0% of U.S. GDP. Thus, a potential banking crisis is another reason why the ECB is likely to outprint the FED in the coming months.
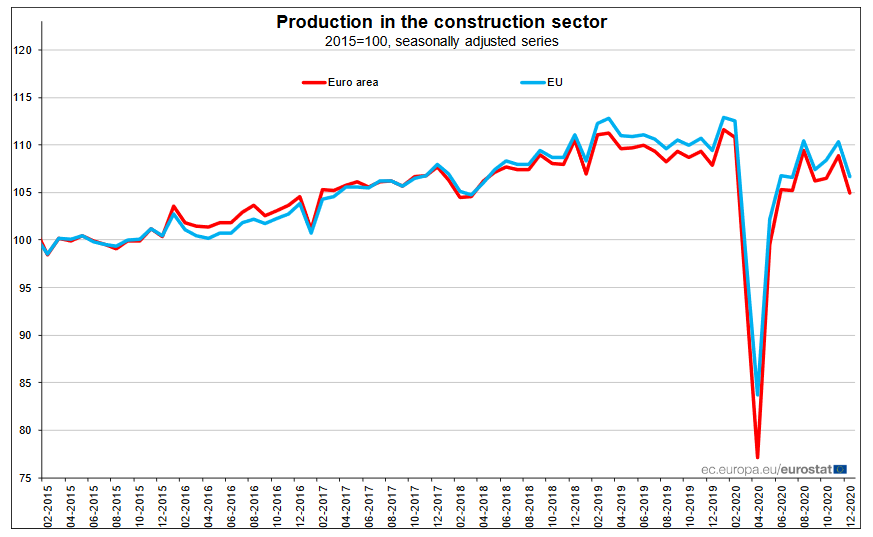
On the data front, belief in a smooth European recovery hinges on France delivering 5.5% GDP growth in 2021. However, released on Feb. 17, Eurostat revealed that Eurozone construction activity turned negative in December (down by 3.3%), with annual production falling by 5.0%.
Please see below:
Figure 6
And who were the main culprits? Well, similar to IHS Markit on Feb. 4, the report cited France and Germany (two of the three-largest economies in Europe) as leading the declines.
Please see below:
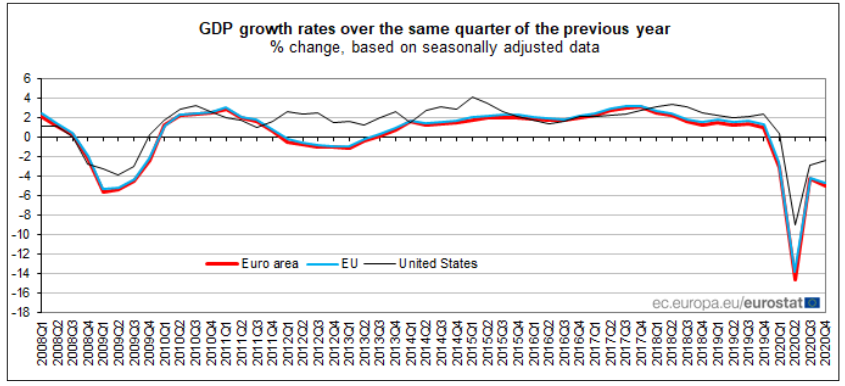
And even though FX traders don’t seem to care, U.S. and Eurozone GDP continue to go their separate ways.
Figure 7
If you analyze the chart above, the dark blue line depicts the year-over-year percentage change in U.S. GDP. Similarly, the red and light blue lines depict the year-over-year percentage change in Euro area and EU GDP. As you can see (on the right side), the former is moving higher, while the latter two are moving lower.
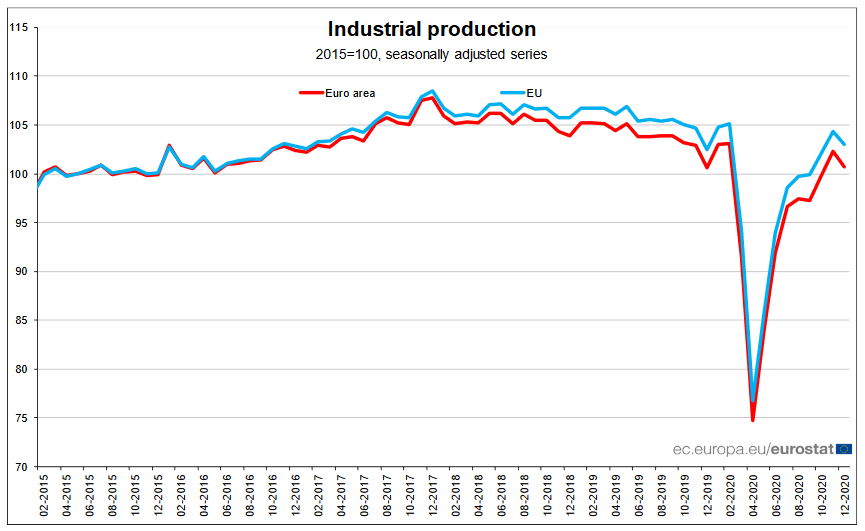
Also highlighting Europe’s underperformance, Eurozone industrial production (released on Feb. 15) declined by 1.20% in December. For context, the data measures the health of Europe’s mining, manufacturing and utilities sectors.
Please see below:
Figure 8
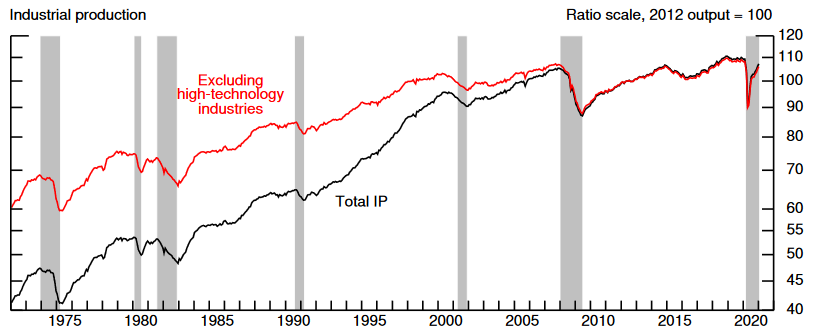
In contrast, U.S. industrial production (released on Feb. 17) rose by 1.3% in December and another 0.90% in January.
Figure 9 - Source: U.S. Federal Reserve
As you can see, each passing day brings another fundamental data point that supports a stronger U.S. dollar. And while market participants’ dream of a reflation paradise continues to cloud their judgment, at this point it’s a matter of when, not if, Europe’s house of cards will come crashing down.
In conclusion, the USD Index remains ripe for a resurgence and a declining EUR/USD is the missing ingredient that should spark the ascension. More importantly though, with the precious metals already suffering from technical breakdowns and rising U.S. yields, a revitalized USD Index could deliver a knockout punch. However, the PMs long-term potential shouldn’t be forgotten. In the midst of a secular bull market, this short-term swoon will only increase the PMs attractiveness in the coming months. And as always, buying low will increase their long-term returns as well.
Letters to the Editor
Q: In your analysis and research you have mentioned more than once that in your opinion mining stocks are the preferred way of taking advantage of the upcoming price move.
Living in Europe, buying miners on U.S. stock exchanges will expose us to USD/EUR exchange rate risk, while buying Canadian or Australian miners will result in a different risk profile. Furthermore, several mining stocks are traded on both U.S. and Canadian exchanges, so we have a choice of where to trade them.
I am very much interested in your opinion on exchange rates as a factor in deciding which (junior) mining stock to buy and in which currency to buy them, based on a long-term hold strategy.
A: If you are investing in juniors that are listed on multiple exchanges, I’d go with the exchange where this particular junior has lowest spreads and highest liquidity. This would help you get into position without moving the price and then allow for a quicker exit.
If this means that you would be exposed to the currency risk, which you would not want (I’m assuming that you’d prefer to profit solely on the junior miners’ upswing, not trade / invest in in forex), then you could, for example, hedge by using futures contracts.
Now, I would suggest that you contact a professional (your financial advisor or broker) that would calculate how many contracts (and what type of contracts) exactly you’d need to eliminate or limit the currency exchange risk. In general, it’s about matching the nominal value of contracts with the market value of your holdings in a given currency, but – again – if you’re not sure how to do it, you’d be much better off reaching out to your broker for details.
Q: You advise that when circumstances dictate changing from shorting the GDX, you will switch to shorting silver. Which ETF silver short will you use? So that I can be familiar & prepared.
A: To be clear, I’m not providing any investment advice – only my opinion about general market moves and something that I view as justified in general, not aimed at any particular investor.
Having said that, I will provide targets for silver futures and for the (2x leveraged) ZSL ETF. If I wanted to short an ETF without leverage, I would use SLV, due to its liquidity.
Please note that if we exit short positions now (and perhaps enter brief long ones), then I initially (most likely) plan to re-enter short positions in mining stocks, and only switch to silver once the miners are already after a significant decline and silver only starts moving lower.
Q: If you want to know the real deal, go and try buying real gold. At this point any metal exchange sells gold oz $200 over the spot, which is unheard of and a pure highway robbery. However, even despite that – guess what, the majority of gold coins are out of stock and there are 5-10 day delays to whatever is left. What does that tell you? More and more people are losing faith in the USD, as the Biden administration plans to print more dollars for the next stimulus package.
A: It tells me that the situation is similar to what we saw when silver was declining in 2011 and 2013. Back then, we saw the same thing with regard to physical premiums (along with multiple voices saying that "it was just the paper silver price that declined"). The latter declined in the following months. Consequently:
1. the high premium for physical silver is unlikely to prevent silver from declining in the next few months and it doesn't indicate anything for the short term.
2. If the decline in the precious metals prices takes only a few months, then the physical premium for silver might not get much lower than it is right now, but it doesn't mean that the prices for physical bars/coins wont decline - if silver futures and spot price declines (which I view as likely) physical bullion prices are also likely to be lower.
In other words, in my opinion, from the very long-term point of view, right NOW is a good time to buy, but we are about to see a MUCH BETTER opportunity.
Q: Very long theory – the reason for gold’s decline now is due to the crypto craze. That’s not on any graph. When the dollar goes bye bye, gold will be king and that might happen sooner than you think
A: I wouldn't say that the crypto market is the key reason behind gold's weakness, but it might indeed be playing a part in it. Cryptos have all the interesting details and ease of use in the electronic world, but there are quite a few problems with them over the very long run.
It would be hard to pay for anything without electricity or in case of severe disruption in internet connections.
It might get banned much easier than gold. Will the monetary authorities allow individuals to take the power of controlling money away from them just like that?
And, what if quantum computation becomes a popular thing in the future and it's MUCH easier to generate cryptos? Meanwhile, gold has stood the test of time for thousands of years.
Q: All this time when the USD is dropping, gold drops along with it! Don't be a turkey! The Fed acts too slowly. Gold is doomed forever! Bitcoin is going to destroy the Fed and the deep state – the one behind all the stolen gold from U.S. citizens in the 911 case!
A: Well... I'm quite convinced that gold is not doomed forever, and that it will play an important part in future monetary systems in one way or the other, and I have thousands of years of history to back me up on this theory. On the other hand, given the pace at which technology is developing, I'm also quite convinced that some form of electronic payment will be growing in popularity. But will that be the crypto market as we currently know it? The jury remains out on that one.
Q: I think that it was back in 2016, when gold and the USD were rising at the same time. It ran like this for about a 5-6 month period of time, so why could it not happen again even if the USD is stronger like other currencies? Finally, as you wrote, it is only a "ratio" USD and other currencies, but if the whole world is printing money like crazy than the entire world’s currencies are losing value and gold is still the ultimate safe haven. I don't think that BTC is better than gold.
A: I can't say "that this won’t happen again", because I'm quite convinced that this actually WILL happen again. In fact, I think that one of the most important signals that we'll get as a confirmation that the bottom is finally in, will come from gold acting very strong despite the USD's continuous strength. "The whole world is printing money like crazy" and this is likely to contribute to much higher gold prices (just like what one would expect to see during the Kondratieff winter). However, that's a reason for gold to rally in the long run; it doesn't tell one anything with regard to the short run. And in the short run, and also over the medium term, we see that gold is still very weak relative to the USD Index, which means that it's still likely to fall lower.
Overview of the Upcoming Part of the Decline
- I expect the initial bottom to form with gold falling to roughly $1,700, and I expect the GDX ETF to decline to about $31 - $32 at that time. I then plan to exit the short positions in the miners and I will consider long positions in the miners at that time – in order to benefit from the likely rebound.
- I expect the above-mentioned decline to take another 1 – 7 weeks to materialize and I expect the rebound to take place during 1-3 weeks.
- After the rebound (perhaps to $33 - $34 in the GDX), I plan to get back in with the short position in the mining stocks.
- Then, after miners slide once again in a meaningful and volatile way, but silver doesn’t (and it just declines moderately), I plan to switch from short positions in miners to short positions in silver (this could take another 1-4 weeks to materialize). I plan to exit those short positions when gold shows substantial strength relative to the USD Index, while the latter is still rallying. This might take place with gold close to $1,500 and the entire decline (from above $1,700 to about $1,500) would be likely to take place within 1-10 weeks and I would expect silver to fall hardest in the final part of the move. This moment (when gold performs very strongly against the rallying USD and miners are strong relative to gold – after gold has already declined substantially) is likely to be the best entry point for long-term investments in my view. This might happen with gold close to $1,500, but it’s too early to say with certainty at this time.
- Consequently, the entire decline could take between 3 and 20 weeks, while the initial part of the decline (to $1,700 in gold) is likely to take between 1 and 7 weeks.
- If gold declines even below $1,500 (say, to ~$1350 or so), then it could take another 10 weeks or so for it to bottom, but this is not what I view as a very likely outcome.
- As a confirmation for the above, I will use the (upcoming? perhaps we have already seen it) top in the general stock market as the starting point for the 3-month countdown. The reason is that after the 1929 top gold miners declined for about 3 months after the general stock market started to slide. We also saw some confirmations of this theory based on the analogy to 2008. All in all, the precious metals sector would be likely to bottom about 3 months after the general stock market tops .
- The above is based on the information available today and it might change in the following days/weeks.
Summary
To summarize, the PMs’ short-term downswing has likely just begun, as miners broke below the neck level of their almost-yearly head-and-shoulders formation. We saw a small invalidation, but we don’t trust its bullish implications – we just saw something similar that failed to ignite a lasting rally and the USD’s decline seems to be a normal, post-breakout pullback.
In addition, because we’re likely entering the “winter” part of the Kondratiev cycle (just like in 1929 and then the 1930s), the outlook for the precious metals’ sector remains particularly bearish during the very first part of the cycle, when cash is king.
Silver’s strength seems bullish at first sight, but taking a closer look at this move, and comparing it with previous cases (when silver got so much attention) and with miners’ weakness, provides us with bearish implications for the medium term.
The confirmed breakout in the USD Index is yet another confirmation of the bearish outlook for the precious metals market.
Naturally, everyone's trading is their responsibility. But in our opinion, if there ever was a time to either enter a short position in the miners or increase its size if it was not already sizable, it's now. We made money on the March decline, and on the March rebound, with another massive slide already underway.
After the sell-off (that takes gold to about $1,500), we expect the precious metals to rally significantly. The final part of the decline might take as little as 1-5 weeks, so it's important to stay alert to any changes.
Most importantly, please stay healthy and safe. We made a lot of money on the March decline and the subsequent rebound (its initial part) price moves (and we'll likely earn much more in the following weeks and months), but you have to be healthy to enjoy the results.
As always, we'll keep you - our subscribers - informed.
To summarize:
Trading capital (supplementary part of the portfolio; our opinion): Full speculative short positions (300% of the full position) in mining stocks is justified from the risk to reward point of view with the following binding exit profit-take price levels:
Senior mining stocks (price levels for the GDX ETF): binding profit-take exit price: $32.02; stop-loss: none (the volatility is too big to justify a SL order in case of this particular trade); binding profit-take level for the DUST ETF: $23.89; stop-loss for the DUST ETF: none (the volatility is too big to justify a SL order in case of this particular trade)
Junior mining stocks (price levels for the GDXJ ETF): binding profit-take exit price: $42.72; stop-loss: none (the volatility is too big to justify a SL order in case of this particular trade); binding profit-take level for the JDST ETF: $14.19; stop-loss for the JDST ETF: none (the volatility is too big to justify a SL order in case of this particular trade)
For-your-information targets (our opinion; we continue to think that mining stocks are the preferred way of taking advantage of the upcoming price move, but if for whatever reason one wants / has to use silver or gold for this trade, we are providing the details anyway. In our view, silver has greater potential than gold does):
Silver futures downside profit-take exit price: unclear at this time - initially, it might be a good idea to exit, when gold moves to $1,703.
Gold futures downside profit-take exit price: $1,703
Long-term capital (core part of the portfolio; our opinion): No positions (in other words: cash
Insurance capital (core part of the portfolio; our opinion): Full position
Whether you already subscribed or not, we encourage you to find out how to make the most of our alerts and read our replies to the most common alert-and-gold-trading-related-questions.
Please note that we describe the situation for the day that the alert is posted in the trading section. In other words, if we are writing about a speculative position, it means that it is up-to-date on the day it was posted. We are also featuring the initial target prices to decide whether keeping a position on a given day is in tune with your approach (some moves are too small for medium-term traders, and some might appear too big for day-traders).
Additionally, you might want to read why our stop-loss orders are usually relatively far from the current price.
Please note that a full position doesn't mean using all of the capital for a given trade. You will find details on our thoughts on gold portfolio structuring in the Key Insights section on our website.
As a reminder - "initial target price" means exactly that - an "initial" one. It's not a price level at which we suggest closing positions. If this becomes the case (like it did in the previous trade), we will refer to these levels as levels of exit orders (exactly as we've done previously). Stop-loss levels, however, are naturally not "initial", but something that, in our opinion, might be entered as an order.
Since it is impossible to synchronize target prices and stop-loss levels for all the ETFs and ETNs with the main markets that we provide these levels for (gold, silver and mining stocks - the GDX ETF), the stop-loss levels and target prices for other ETNs and ETF (among other: UGL, GLL, AGQ, ZSL, NUGT, DUST, JNUG, JDST) are provided as supplementary, and not as "final". This means that if a stop-loss or a target level is reached for any of the "additional instruments" (GLL for instance), but not for the "main instrument" (gold in this case), we will view positions in both gold and GLL as still open and the stop-loss for GLL would have to be moved lower. On the other hand, if gold moves to a stop-loss level but GLL doesn't, then we will view both positions (in gold and GLL) as closed. In other words, since it's not possible to be 100% certain that each related instrument moves to a given level when the underlying instrument does, we can't provide levels that would be binding. The levels that we do provide are our best estimate of the levels that will correspond to the levels in the underlying assets, but it will be the underlying assets that one will need to focus on regarding the signs pointing to closing a given position or keeping it open. We might adjust the levels in the "additional instruments" without adjusting the levels in the "main instruments", which will simply mean that we have improved our estimation of these levels, not that we changed our outlook on the markets. We are already working on a tool that would update these levels daily for the most popular ETFs, ETNs and individual mining stocks.
Our preferred ways to invest in and to trade gold along with the reasoning can be found in the how to buy gold section. Furthermore, our preferred ETFs and ETNs can be found in our Gold & Silver ETF Ranking.
As a reminder, Gold & Silver Trading Alerts are posted before or on each trading day (we usually post them before the opening bell, but we don't promise doing that each day). If there's anything urgent, we will send you an additional small alert before posting the main one.
Thank you.
Przemyslaw Radomski, CFA
Founder, Editor-in-chief


