Briefly: in our opinion, full (300% of the regular position size) speculative short positions in junior mining stocks are justified from the risk/reward point of view at the moment of publishing this Alert.
How much is too much? How high can gold rally and still be in bearish mode?
In short, there is no short reply. As the outlook for a given market does not depend solely on its price and price movement (but also on other markets and how they all influence one another), it is usually not possible (or simply not a good idea) to try to guesstimate the price itself that would change one outlook.
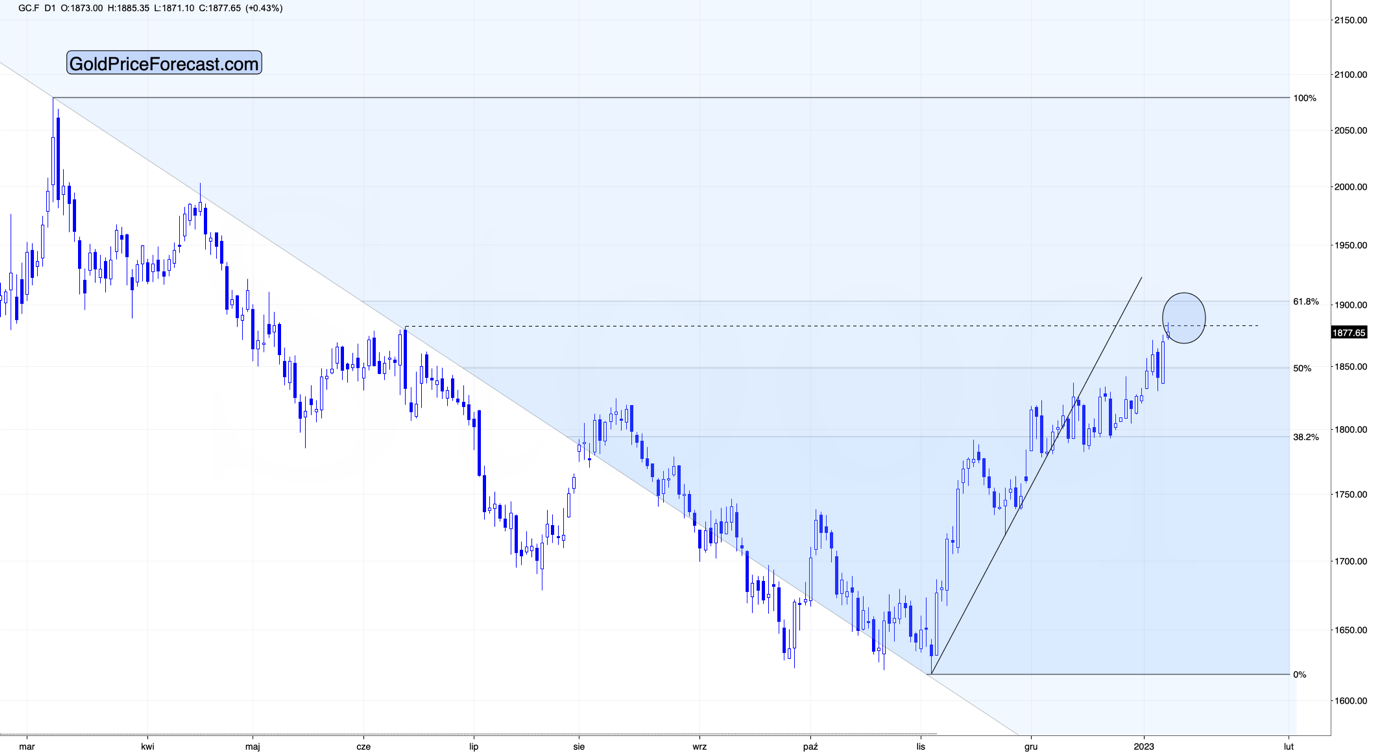
Still, gold is trading very close to very important resistance levels, and depending on what it does soon, it might change the short-term landscape. Those resistance levels are called the Fibonacci retracement levels, and they tend to work on most - if not all – markets.
Corrections often erase between 38.2% and 61.8% of the preceding move before the original move is continued – that’s a fact.
It’s also a fact that gold is currently trading between the 50% retracement and the 61.8% retracement. The latter is slightly above $1,900.
This tells us one important thing.
Gold is doing what it’s likely to do during a correction. Consequently, there is little reason to think that the medium-term downtrend has changed.
Why would the medium-term trend be to the downside? Because there are two key fundamental gold price drivers: the USD Index, and real interest rates. Real interest rates are unquestionably rising, which is bearish for gold in the medium term. I’m going to move on to the USD Index in just a moment, but it also implies that predicting gold prices at lower levels makes sense.
In today’s (Monday’s – Jan. 9) pre-market trading, gold futures moved to their mid-2022 high and then reversed. Is the top finally in? It’s not 100% certain, but it could indeed be the case. If not, the 61.8% Fibonacci retracement is just above the current price levels.
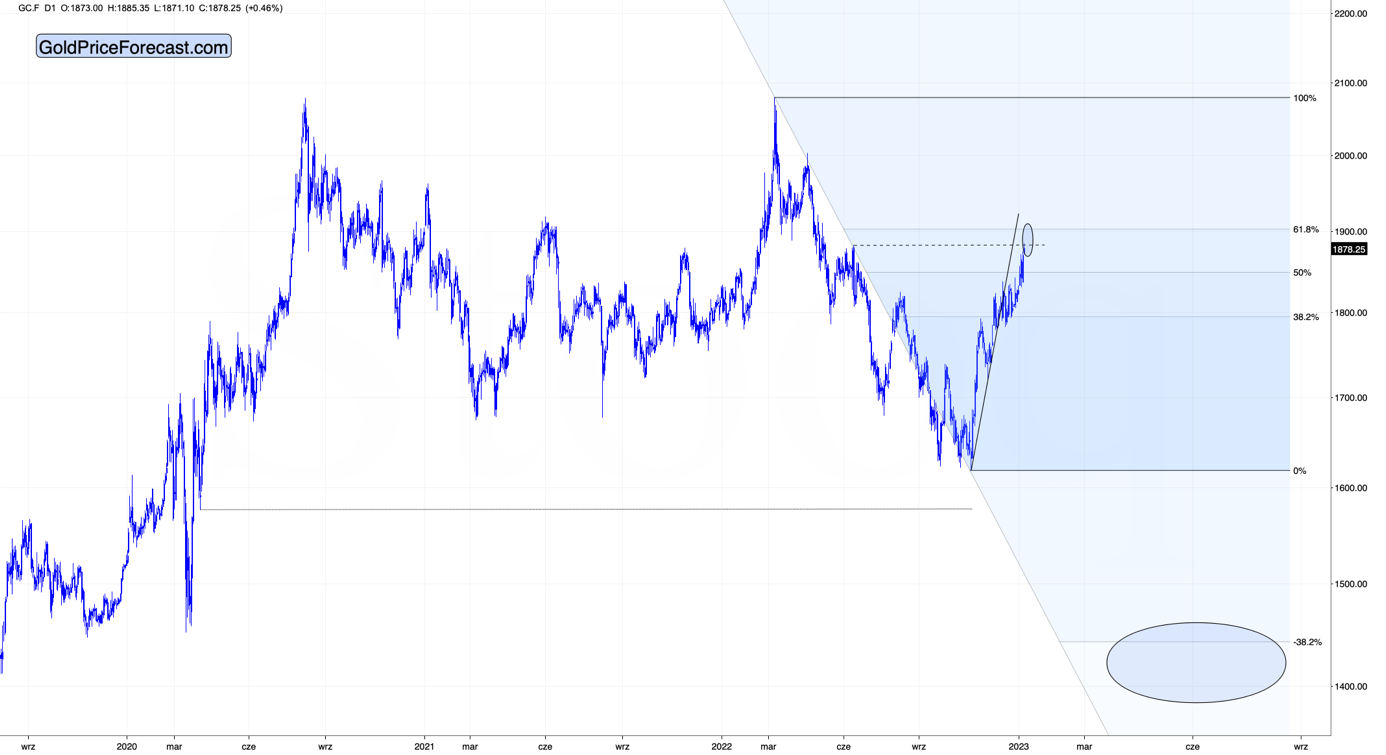
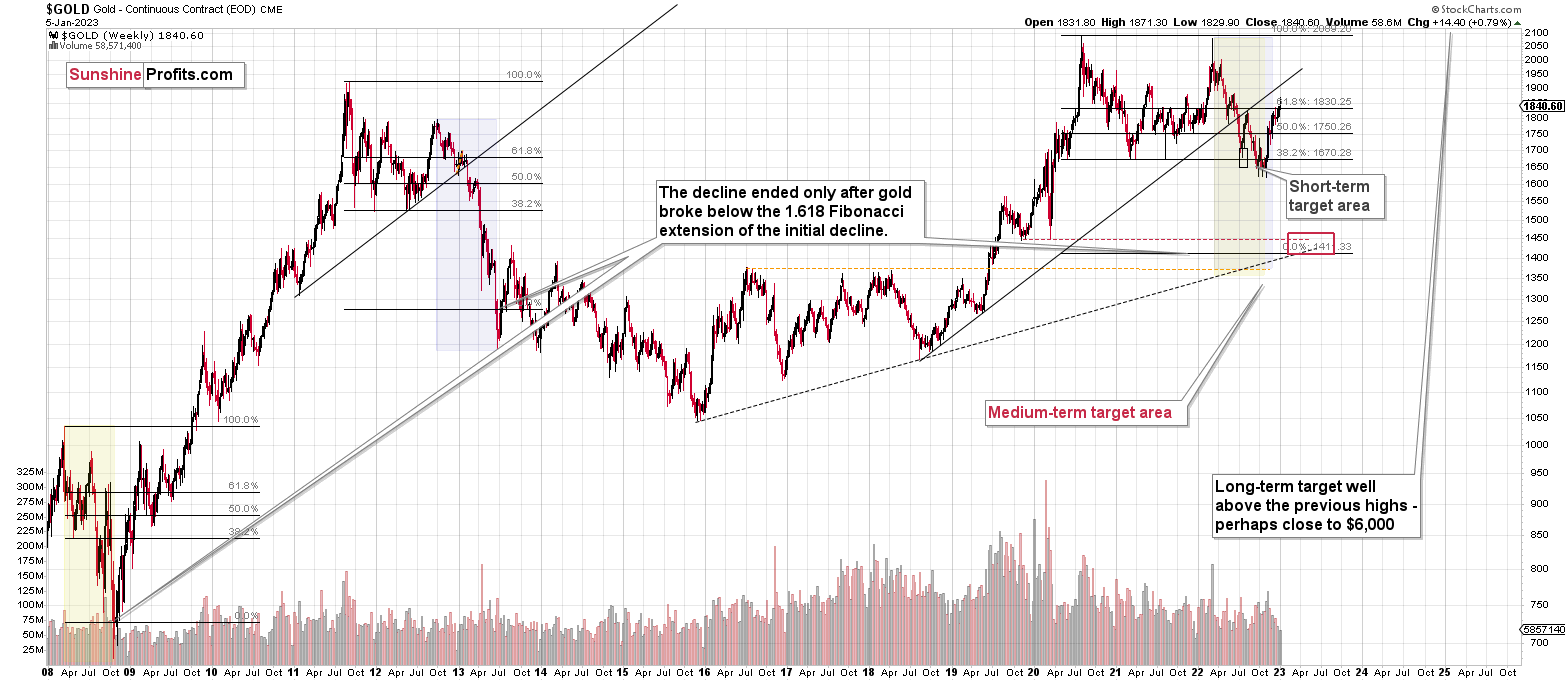
If you think that a rally to about $1,900 is a big deal, let me provide you with some extra perspective. Let’s zoom out.
If the recent short-term upswing is just a correction (which is likely – remember real interest rates and the USDX!), then the next, bigger move is likely to take gold lower. And the next strong support is below $1,500 – at and below gold’s 2020 lows.
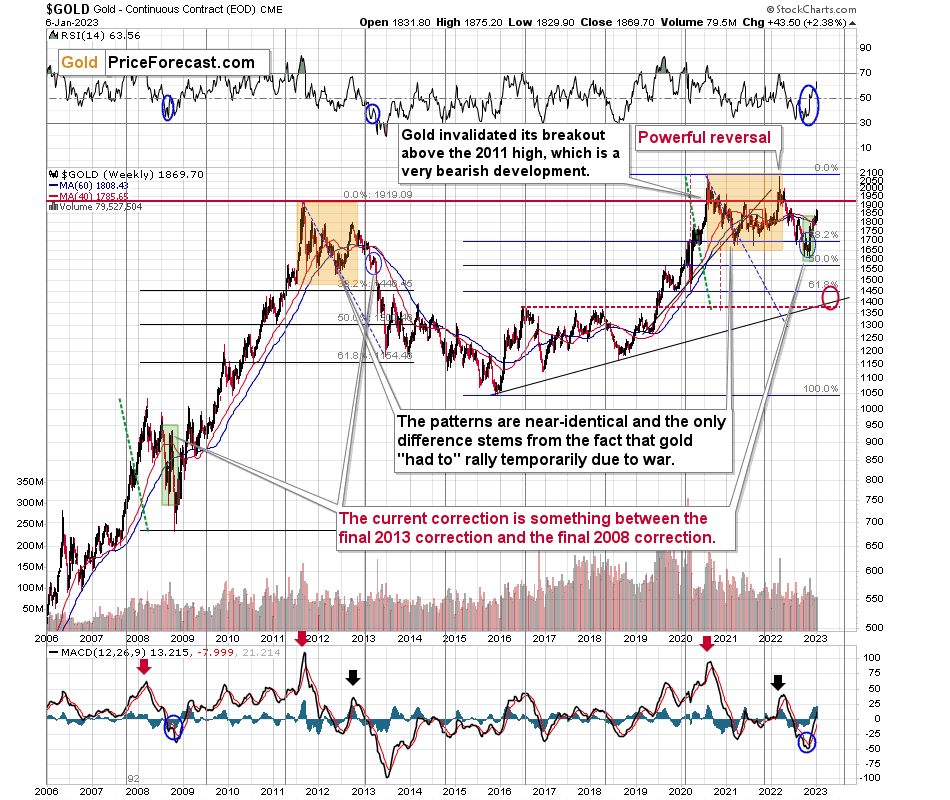
Let’s keep in mind that the similarity to 2008 and 2013 remains intact.
The shape of the 2020-now price moves is similar to what we saw between 2011 and 2013, and the size of the recent correction is similar to what we saw in 2008. And in both cases, gold moves substantially lower before recovering.
Right now, many market participants seem to assume that the Fed will slow down its rate hikes, but it’s not necessarily going to happen. In fact, if the Fed wants to modulate expectations, we might hear some hawkish remarks shortly. So, no, we don’t need to wait for the FOMC for the market to react to more hawkish expectations from the Fed. This could be one of the triggers that sends gold lower in the short term.
Earlier today, I wrote that I’d move back to the USD Index. Let’s take a closer look at its recent price moves.
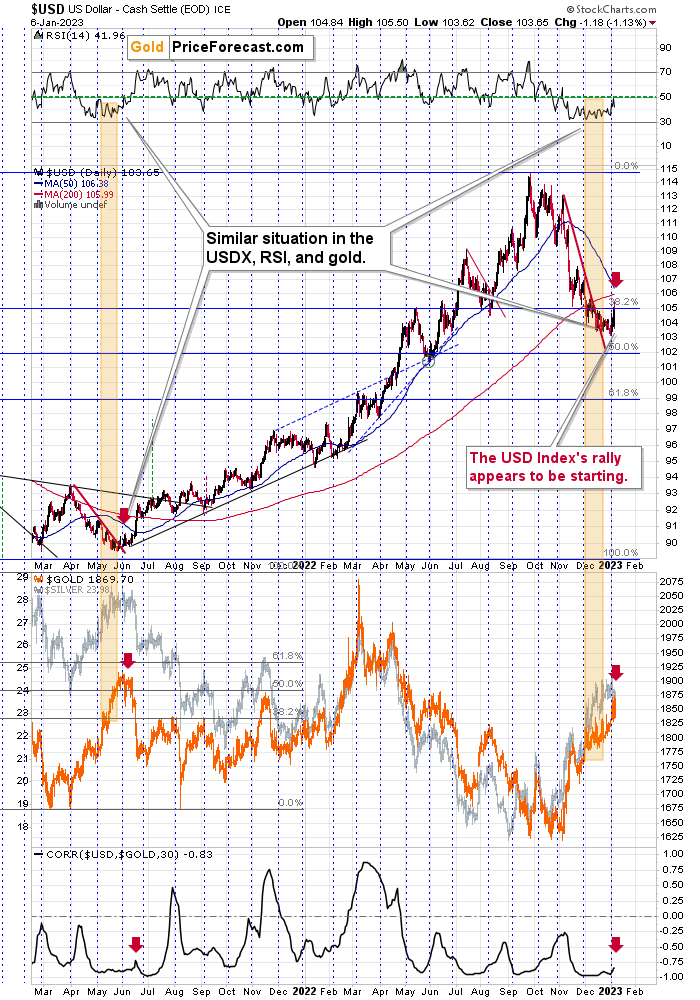
The USDX first moved strongly up, and then it moved back down. What gives? So, is it rallying or not?
What is chaos to the fly is order to the spider.
What is pointless in the short run makes sense once you take a broader perspective.
In the above case, we see that this kind of seemingly erratic action is exactly what we saw also in early June 2021, at the start of the USD Index’s ~15-index-point rally. Gold moved higher in the immediate aftermath, but it plunged shortly thereafter, and within two months, it erased the entire preceding rally, and miners fell more than that in 2021.
There was even an analogous slight bump higher in the correlation between gold and the USDX – I marked it all with red arrows.
Overall, because real rates are rising, the USD index is likely to rise, implying that gold's medium-term trend is likely to remain downward. Based on gold’s technical picture (its proximity to the 61.8% Fibonacci retracement and today’s reversal at the mid-2021 high appear to indicate that), it seems that the corrective upswing is about to end, or it has just ended.
Having said that, let’s take a look at the gold market from a more fundamental point of view.
Is It Unwise for Gold to Fight the Fed?
With pivot mania reaching new heights on Jan. 6, the bulls have convinced themselves that a pre-pandemic monetary policy environment is on the horizon. But, we’ve warned for many months that the outlook is highly bullish for the U.S. federal funds rate (FFR), and the fundamentals continue to unfold as expected.
For example, the crowd was screaming recession in the summer of 2022, and those fears were amplified in October. However, we rebutted that demand was resilient, and the U.S. labor market remained on solid footing. To that point, with U.S. nonfarm payrolls outperforming the consensus estimate on Jan. 6, it was another data point that aligned with our expectations.
Please see below:
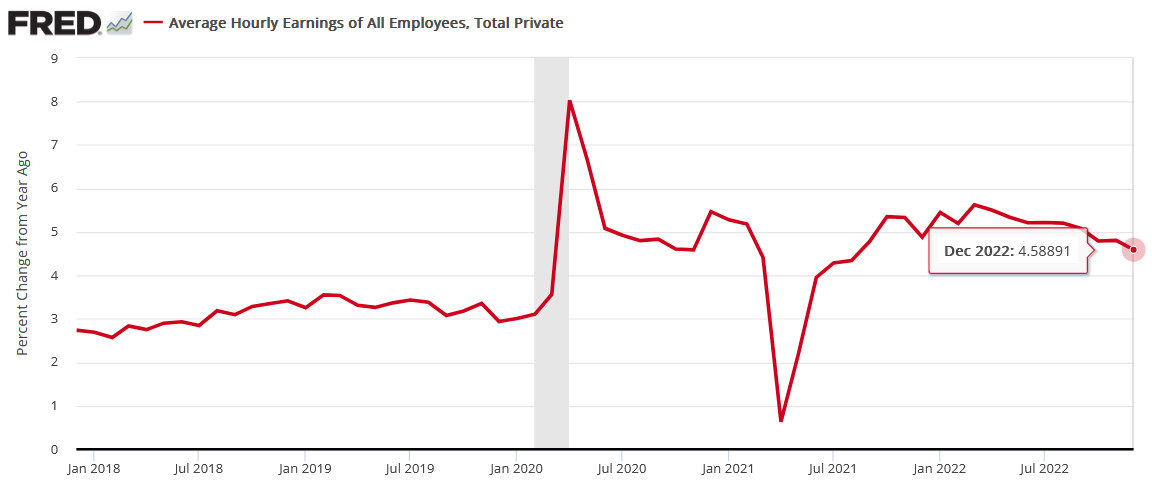
In contrast, with average hourly earnings coming in at 4.6% year-over-year (YoY) versus 5% expected, the crowd once again decided that the inflation fight was over. Conversely, with the metric only decelerating by ~20 basis points YoY versus November, the excitement contrasts the fundamental realities.
Please see below:
As evidence, while the crowd cherry-picks data that supports their narrative, we prefer to use multiple sources; and with other measures showing robust wage inflation, the crowd is uninformed about the inflationary backdrop.
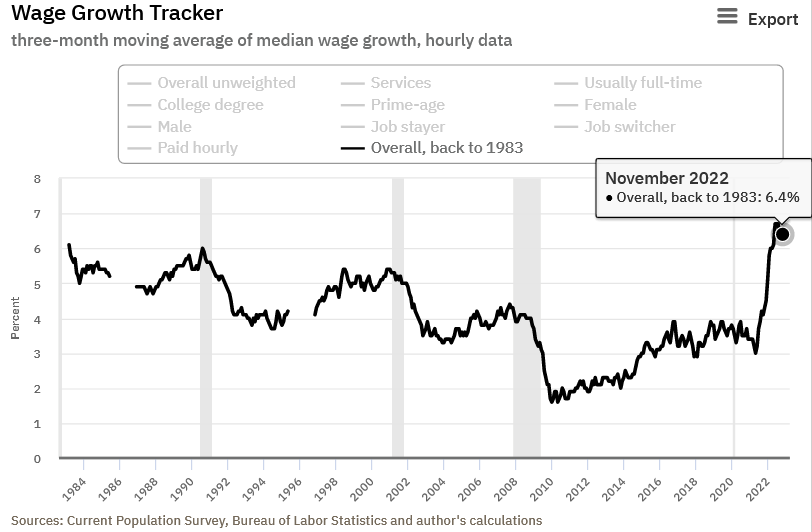
For example, while the Atlanta Fed should update its Wage Growth Tracker at the end of next week, the metric was north of 6% in November.
Please see below:
Second, ADP’s private payrolls report (released on Jan. 5) showed even higher wage inflation. We wrote on Jan. 6:
To explain, the report showed that job-stayers and job-switchers recorded 7.3% and 15.2% increases in their median annual pay. For context, the latter pertains to Americans that leave their jobs for other opportunities.
Likewise, the industry breakdown highlights how all areas of the U.S. economy experienced wage growth of more than 6%, and the figures do not support the Fed normalizing output inflation to 2% anytime soon.
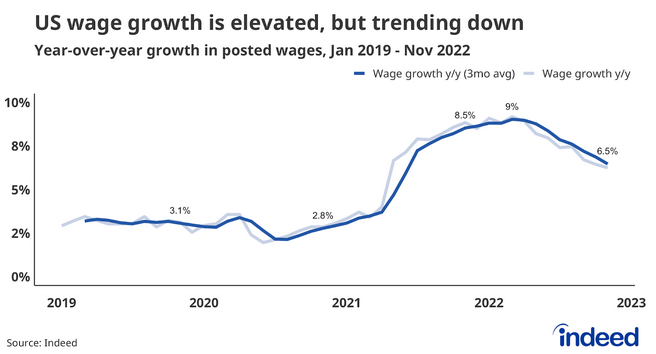
Third, Indeed’s Wage Tracker shows that salary inflation is still running at 6.5%.
Please see below:
The Dec. 8 report stated:
“Posted wage growth may return to its pre-pandemic pace late next year. Overall wage growth tends to trail gains for new hires. That means overall wage growth may not get back to pre-pandemic levels until well into 2024. We are still in the early innings of this wage slowdown.”
Moreover, while the crowd follows the narrative instead of the data, the reality is that objective measures of wage inflation are 6%+. As a result, investors are in la-la land if they think the economic backdrop supports a dovish pivot.
Now, it’s one thing for the fundamentals to unfold as expected. It’s another for the price action to follow suit; and with the PMs outperforming in recent weeks, not only has the consensus ignored the ramifications of a higher FFR, but they expect the exact opposite. To explain, we wrote on Jan. 6:
The lack of demand destruction in the U.S. labor market highlights why the FFR should have plenty of room to run. Furthermore, while Fed officials continuously issue hawkish warnings, their plethora of post-GFC pivots have the crowd viewing them as ‘The Boy Who Cried Wolf.’ But, this is not 2018 or 2020, and more QE can’t solve this fundamental predicament. So, when reality returns, the PMs should undergo substantial re-pricings.
Thus, the PMs’ recent strength comes down to investors not buying what the FOMC is selling. In their minds, the Fed will pivot in 2023, and the pre-pandemic paradise of low inflation, low interest rates and perpetual QE is on the horizon.
Conversely, we warned repeatedly that dovish pivots alongside high inflation occur when the economic outlook is dire. In addition, recession fears outweigh rate-cut optimism and liquidations are already underway.
Yet, the current economic backdrop is far from dire, and we have consistently remarked that investors’ recession fears are overdone. As such, the fundamental outlooks remain bullish for the FFR, real yields, and the USD Index, and the crowd underestimates the medium-term ramifications.
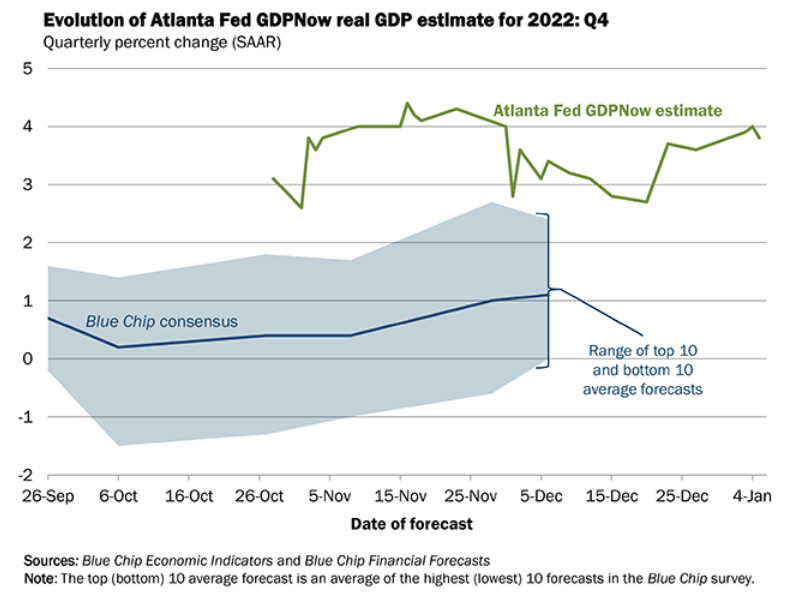
Please see below:
To explain, U.S. third-quarter real GDP growth was revised upward twice, and the Atlanta Fed’s projection for Q4 (the green line above) stands at 3.8% as of Jan. 5. Consequently, the crowd’s pivot optimism contrasts economic reality.
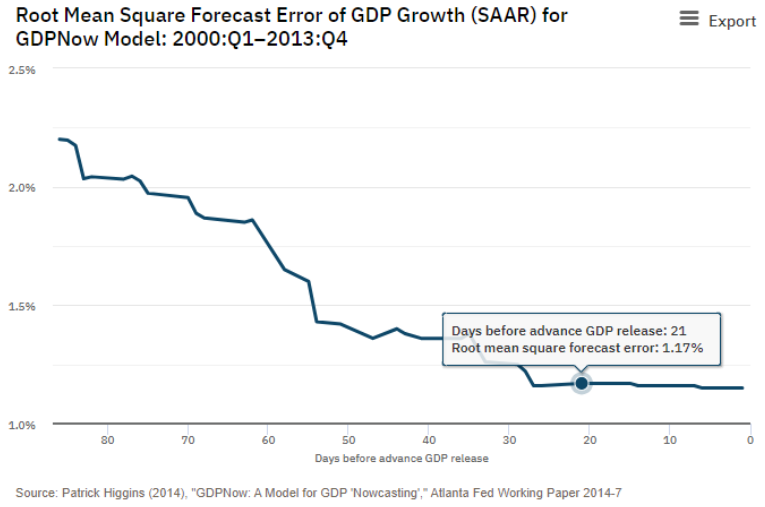
To that point, with the official data released on Jan. 26, the shorter the time until the print increases the validity of the Atlanta Fed’s projection.
Please see below:
To explain, the blue line above tracks the root mean square error (RMSE) of the Atlanta Fed’s real GDP projection, depending on the days until the official data is released. For context, it measures the average difference between the predicted and realized value, and is used to determine how well a model predicts a target value.
If you analyze the right side of the chart, you can see that the RMSE declines as we move closer to the official GDP print, and even a realized error of ~1% still puts Q4 GDP growth above its pre-pandemic trend of ~2%. As a result, the narrative and the data continue to diverge, and the uninformed pivot optimism rivals the PMs’ other bear market rallies in 2022.
Continuing the theme, the U.S. unemployment rate declined to a ~50-year low on Jan. 6, which highlights how the FFR has not risen enough to materially slow the U.S. labor market.
Please see below:
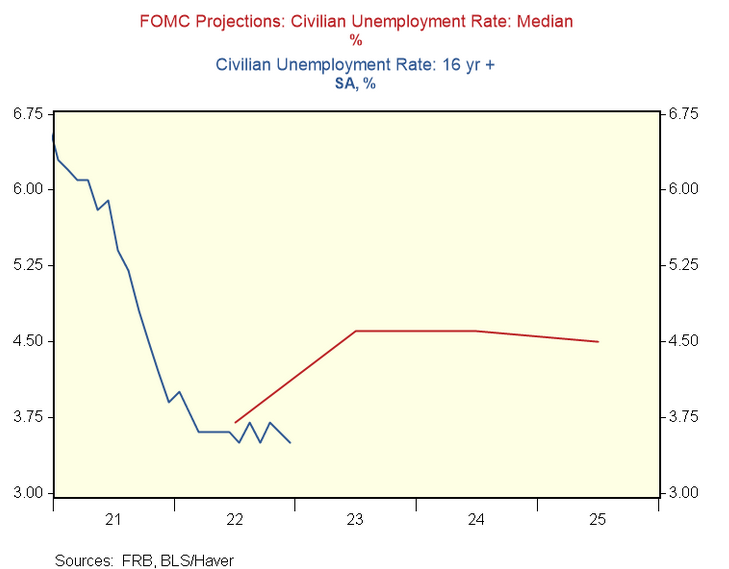
Likewise, the strength has the unemployment rate outperforming the median estimates from the FOMC’s Summary of Economic Projections (SEP).
Please see below:
To explain, the red line above tracks the FOMC’s median SEP estimates for 2022 and beyond, while the blue line above tracks the monthly unemployment rate. If you analyze the performance of the latter, you can see that its December decline pushed it further from the FOMC’s desired trajectory. As such, the results are hawkish, not dovish, as demand for labor still outweighs supply.
Overall, the narrative has shifted from an imminent recession to a soft landing that returns the U.S. economy to its pre-pandemic state. With employment still hot and the U.S. Bureau of Labor Statistics’ (BLS) measure of wage inflation cooling, the crowd viewed the results as the perfect combination for resilient growth and 2023 rate cuts.
Conversely, those developments are mutually exclusive, and resilient economic data should keep inflation uplifted and spur more rate hikes, not less. Therefore, while the gold price has benefited from the false narrative, a profound reversal should occur over the medium term.
As always, we encourage your input. Do you think wage growth could slow dramatically in the months ahead? And if so, why? How would the Fed respond? And why should we expect low interest rates and QE to resume sooner rather than later?
The Silver Price Shouts a Pivot Is Imminent
With the white metal jumping by more than 2% on Jan. 6, silver ignored the hawkish payrolls print. However, with Fed officials reiterating their commitment, an epic battle is unfolding.
For example, Fed officials have been steadfast in supporting a higher FFR, and have even stated that the metric may need to rise much more than the ~5% expected. On top of that, they also warned that whenever a pause ensues, rate cuts are out of the question, as a rise-and-hold strategy is the prudent response to ~40-year high inflation.
Yet, market participants do not believe the Fed, and they assume the central bank will cut rates, pause QT and continue its post-GFC trend of dovish pivots. So, the fundamentals boil down to a single question: do you believe the Fed or the consensus?
Now, the question is somewhat misleading because we do neither. Instead, we follow the data and let it guide our expectations. But, with employment outperformance, resilient GDP, and continued consumer spending, the data supports the Fed’s conclusions, and we believe the consensus has it wrong.
For context, when the Fed and the crowd were aligned in their “transitory” expectations in 2021, we warned that both parties missed the forest through the trees. We wrote on Dec. 23, 2021.
When the Fed called inflation “transitory,” we wrote for months that officials were misreading the data. As a result, we don’t have a horse in this race. However, now, they likely have it right. Thus, if investors assume that the Fed won’t tighten, their bets will likely go bust in 2022.
Likewise, when the crowd was pricing in a dovish pivot in the summer of 2022, we warned again that their expectations were out of touch with reality. We wrote on Aug. 1:
While the consensus assumes the Fed is near the end of its rate hike cycle, the CPI is on the fast track to 2% and a 3% FFR will be enough to capsize inflation, market participants are living in fantasy land.
For example, we’ve warned on numerous occasions that demand is much stronger than the consensus realizes. With Americans’ checking account balances at unprecedented all-time highs and the Atlanta Fed’s wage growth tracker hitting an all-time high in June, the FFR needs to go meaningfully above 3%. To explain, we wrote on Jul. 25:
With more earnings calls showcasing how the situation continues to worsen, market participants don’t realize that the FFR needs to hit ~4.5% or more for the Fed to materially reduce inflation. For context, the consensus expects a figure in the 2.5% to 3.5% range.
Therefore, while the predictions proved prescient, the crowd assumes that because the Fed was wrong about inflation and the FFR in 2021, they’re wrong about both now. In contrast, we believe the Fed has the right read on the U.S. economy, and the pivot predictors should suffer mightily in the months ahead.
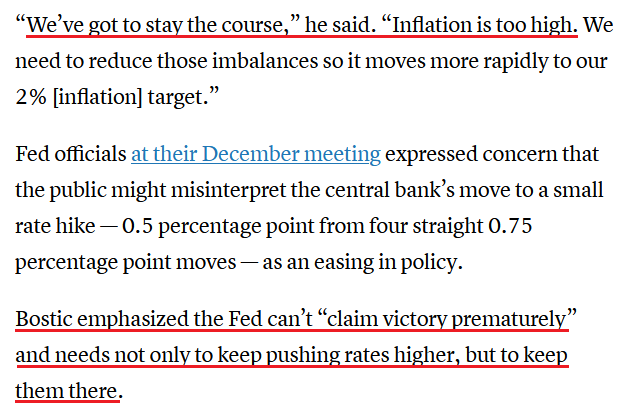
For example, while the crowd celebrated the mild slowdown in wage inflation, Atlanta Fed President Raphael Bostic said on Jan. 6:
“It doesn’t really change my outlook at all. I’ve been looking for the economy to continually slow from the strong position it was at in the summertime. This is just the next step in that.”
He added:
“What I think is the important [point] is just to hold [the FFR] there and stay there and let that policy stance really grip the economy and just make sure that the [inflation] momentum is fully arrested, so that we get to a place where demand and supply start to become more interbalanced and we start to see those pressures on inflation really start to come down.”
As such, while it sounds like a broken record, the fundamentals remain consistent with our expectations.
Please see below:
Moreover, St. Louis Fed President James Bullard said on Jan. 5:
“This is a great time to fight inflation,” as the FOMC should “get it under control, get it back to 2% while you've got the resilient labor market.”
Furthermore, he added in a CFA Society presentation:
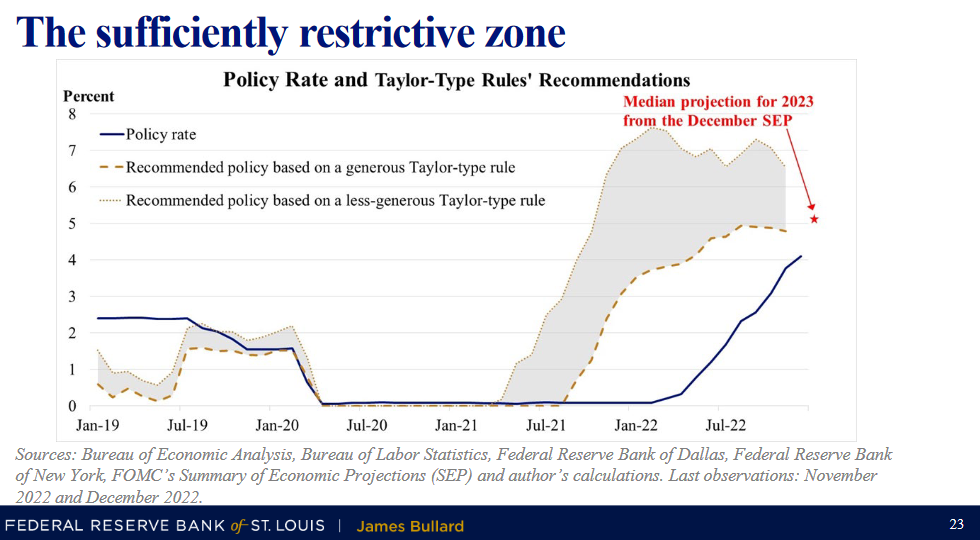
“The policy rate is not yet in a zone that may be considered sufficiently restrictive, but it is getting closer.”
Please see below:
To explain, the blue line above tracks the FFR, while the gray shaded area above represents the lower and upper bounds of what is considered a “sufficiently restrictive” FFR. For context, it’s essentially what is required to normalize inflation.
As you can see, the blue line has not yet reached the lower bound and is still far from the upper bound. As a result, while Bullard believes that a ~5% to ~7% FFR could materialize in 2023, the crowd expects rate cuts.
Remember, the FFR has eclipsed the peak YoY core CPI in every inflation fight since 1961; and since the YoY core CPI peaked (for now) at 6.66% in September 2022, the historically-implied peak FFR is at least 6.67%.
So, while investors position for the exact opposite, we see a profound difference between what’s priced in and what’s likely to occur.
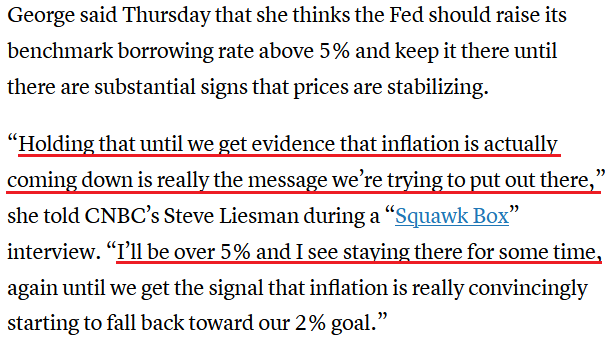
Making three of a kind, Kansas City Fed President Esther George said on Jan. 5:
“I’m not forecasting a recession. But I’m quite realistic that when you see below-trend growth and the idea that [the FFR is] going to work on demand, bringing that down, it doesn’t leave a lot of margin there. Any shock could come, any risk to the outlook could send the economy in that direction. So it’s not my forecast, but I do understand that bringing demand down creates that sort of possibility.”
Thus, while we warned for many months that resilient demand would spur the Fed into action, George said that she expects the FFR to remain high into at least 2024.
Please see below:
Overall, Fed officials are as hawkish as they’ve ever been, but investors don’t care because they don’t believe them. However, we’ve seen this movie before, and the Fed is now on the right side of the fundamentals. Consequently, history has made corpses out of those that doubted inflation’s capabilities, and we see this iteration as no different.
Do you agree? Or, how do you see the Fed’s inflation fight unfolding? When could the FOMC buckle under the pressure from investors? We always welcome your feedback.
The Bottom Line
Gold, silver and mining stocks have the wind at their backs, as investors see nothing but smooth sailing ahead. Yet, their expectations contrast history and economic reality, and it’s likely only a matter of time before sharp reversions unfold.
In conclusion, the PMs rallied on Jan.6, as the USD Index and the U.S. 10-Year real yield declined. But, the developments only loosen financial conditions, which spurs more inflation. Therefore, we believe the pair’s best days still lie ahead.
Overview of the Upcoming Part of the Decline
- It seems to me that the corrective upswing is over (or about to be over) and that the next big move lower is already underway (or that it’s about to start).
- If we see a situation where miners slide in a meaningful and volatile way while silver doesn’t (it just declines moderately), I plan to – once again – switch from short positions in miners to short positions in silver. At this time, it’s too early to say at what price levels this could take place and if we get this kind of opportunity at all – perhaps with gold prices close to $1,500 - $1,550.
- I plan to switch from the short positions in junior mining stocks or silver (whichever I’ll have at that moment) to long positions in junior mining stocks when gold / mining stocks move to their 2020 lows (approximately). While I’m probably not going to write about it at this stage yet, this is when some investors might consider getting back in with their long-term investing capital (or perhaps 1/3 or 1/2 thereof).
- I plan to return to short positions in junior mining stocks after a rebound – and the rebound could take gold from about $1,450 to about $1,550, and it could take the GDXJ from about $20 to about $24. In other words, I’m currently planning to go long when GDXJ is close to $20 (which might take place when gold is close to $1,450), and I’m planning to exit this long position and re-enter the short position once we see a corrective rally to $24 in the GDXJ (which might take place when gold is close to $1,550).
- I plan to exit all remaining short positions once gold shows substantial strength relative to the USD Index while the latter is still rallying. This may be the case with gold prices close to $1,400 and GDXJ close to $15 . This moment (when gold performs very strongly against the rallying USD and miners are strong relative to gold after its substantial decline) is likely to be the best entry point for long-term investments, in my view. This can also happen with gold close to $1,400, but at the moment it’s too early to say with certainty.
- The above is based on the information available today, and it might change in the following days/weeks.
You will find my general overview of the outlook for gold on the chart below:
Please note that the above timing details are relatively broad and “for general overview only” – so that you know more or less what I think and how volatile I think the moves are likely to be – on an approximate basis. These time targets are not binding nor clear enough for me to think that they should be used for purchasing options, warrants, or similar instruments.
Letters to the Editor
We received a few messages over e-mail, but as we are moving to our new platform, we will be transferring them below the articles as comments – and that’s where we’ll be replying to them.
Asking your questions below the articles or in the spaces called “Ask the Community” or “Position Sizes” directly will help us deliver a reply sooner. In some cases, someone from the community might reply and help even before we do.
Please remember about the Pillars of our Community, especially about the Kindness of Speech Pillar.
Also, if there’s anything that you’re unhappy with, it’s best to send us a message at [email protected].
Please note that this section is going to go away within the next 1-8 weeks, as you can add comments/questions below the article on Golden Meadow – the platform that we’re using to provide our analyses. Your notification e-mails include an invitation link that allows you to access the “Gold Trading Alerts” space.
Also, if you haven’t had the chance to see the video, in which I’m talking about the new platform and why we essentially moved from Sunshine Profits to Golden Meadow, I strongly encourage you to do so:
Summary
Summing up, it seems that the major bottom in the USD Index is in, while the correction in stocks, gold, silver, and mining stocks is over – or very close to being over.
Gold and junior miners corrected less than 61.8% of their 2022 decline, while silver corrected over 61.8% of the decline. Silver’s move above the 61.8% Fibonacci retracement was already invalidated, suggesting that the next big move lower is starting or about to start.
Now, as more investors realize that interest rates will have to rise sooner than expected, the prices of precious metals and mining stocks (as well as other stocks) are likely to fall. In my opinion, the current trading position is going to become profitable in the following weeks, and quite possibly in the following days. And while I can’t promise any kind of performance, I fully expect it to become very profitable before it’s over and to prolong our 2022 winning streak.
After the final sell-off (that takes gold to about $1,350-$1,500), I expect the precious metals to rally significantly. The final part of the decline might take as little as 1-5 weeks, so it's important to stay alert to any changes.
As always, we'll keep you – our subscribers – informed.
To summarize:
Trading capital (supplementary part of the portfolio; our opinion): Full speculative short positions (300% of the full position) in junior mining stocks are justified from the risk to reward point of view with the following binding exit profit-take price levels:
Mining stocks (price levels for the GDXJ ETF): binding profit-take exit price: $20.32; stop-loss: none (the volatility is too big to justify a stop-loss order in case of this particular trade)
Alternatively, if one seeks leverage, we’re providing the binding profit-take levels for the JDST (2x leveraged). The binding profit-take level for the JDST: $22.87; stop-loss for the JDST: none (the volatility is too big to justify a SL order in case of this particular trade).
For-your-information targets (our opinion; we continue to think that mining stocks are the preferred way of taking advantage of the upcoming price move, but if for whatever reason one wants / has to use silver or gold for this trade, we are providing the details anyway.):
Silver futures downside profit-take exit price: $14.32
SLV profit-take exit price: $13.42
ZSL profit-take exit price: $48.87
Gold futures downside profit-take exit price: $1,504
HGD.TO – alternative (Canadian) 2x inverse leveraged gold stocks ETF – the upside profit-take exit price: $16.47
HZD.TO – alternative (Canadian) 2x inverse leveraged silver ETF – the upside profit-take exit price: $36.87
Long-term capital (core part of the portfolio; our opinion): No positions (in other words: cash)
Insurance capital (core part of the portfolio; our opinion): Full position
Whether you’ve already subscribed or not, we encourage you to find out how to make the most of our alerts and read our replies to the most common alert-and-gold-trading-related-questions.
Please note that we describe the situation for the day that the alert is posted in the trading section. In other words, if we are writing about a speculative position, it means that it is up-to-date on the day it was posted. We are also featuring the initial target prices to decide whether keeping a position on a given day is in tune with your approach (some moves are too small for medium-term traders, and some might appear too big for day-traders).
Additionally, you might want to read why our stop-loss orders are usually relatively far from the current price.
Please note that a full position doesn't mean using all of the capital for a given trade. You will find details on our thoughts on gold portfolio structuring in the Key Insights section on our website.
As a reminder - "initial target price" means exactly that - an "initial" one. It's not a price level at which we suggest closing positions. If this becomes the case (as it did in the previous trade), we will refer to these levels as levels of exit orders (exactly as we've done previously). Stop-loss levels, however, are naturally not "initial", but something that, in our opinion, might be entered as an order.
Since it is impossible to synchronize target prices and stop-loss levels for all the ETFs and ETNs with the main markets that we provide these levels for (gold, silver and mining stocks - the GDX ETF), the stop-loss levels and target prices for other ETNs and ETF (among other: UGL, GLL, AGQ, ZSL, NUGT, DUST, JNUG, JDST) are provided as supplementary, and not as "final". This means that if a stop-loss or a target level is reached for any of the "additional instruments" (GLL for instance), but not for the "main instrument" (gold in this case), we will view positions in both gold and GLL as still open and the stop-loss for GLL would have to be moved lower. On the other hand, if gold moves to a stop-loss level but GLL doesn't, then we will view both positions (in gold and GLL) as closed. In other words, since it's not possible to be 100% certain that each related instrument moves to a given level when the underlying instrument does, we can't provide levels that would be binding. The levels that we do provide are our best estimate of the levels that will correspond to the levels in the underlying assets, but it will be the underlying assets that one will need to focus on regarding the signs pointing to closing a given position or keeping it open. We might adjust the levels in the "additional instruments" without adjusting the levels in the "main instruments", which will simply mean that we have improved our estimation of these levels, not that we changed our outlook on the markets. We are already working on a tool that would update these levels daily for the most popular ETFs, ETNs and individual mining stocks.
Our preferred ways to invest in and to trade gold along with the reasoning can be found in the how to buy gold section. Furthermore, our preferred ETFs and ETNs can be found in our Gold & Silver ETF Ranking.
As a reminder, Gold & Silver Trading Alerts are posted before or on each trading day (we usually post them before the opening bell, but we don't promise doing that each day). If there's anything urgent, we will send you an additional small alert before posting the main one.
Thank you.
Przemyslaw K. Radomski, CFA
Founder, Editor-in-chief


