Briefly: in our opinion, full (300% of the regular position size) speculative short positions in junior mining stocks are justified from the risk/reward point of view at the moment of publishing this Alert.
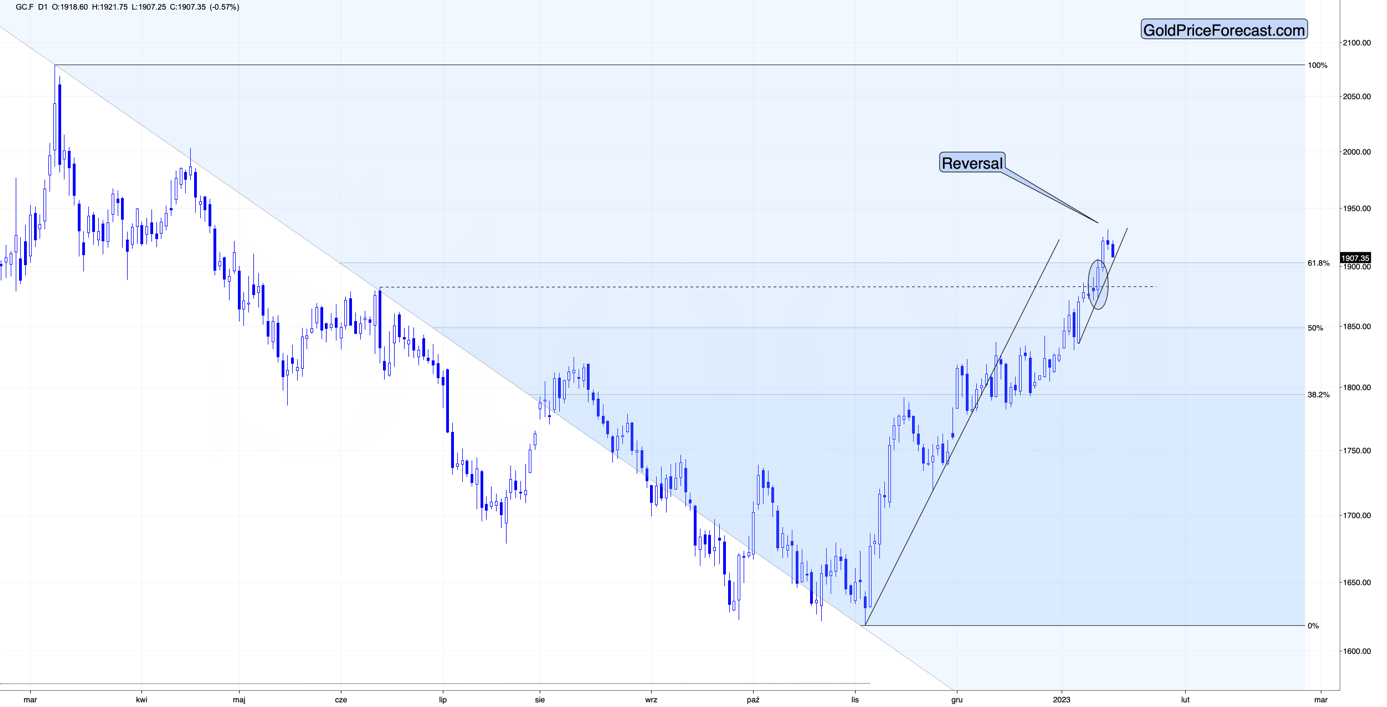
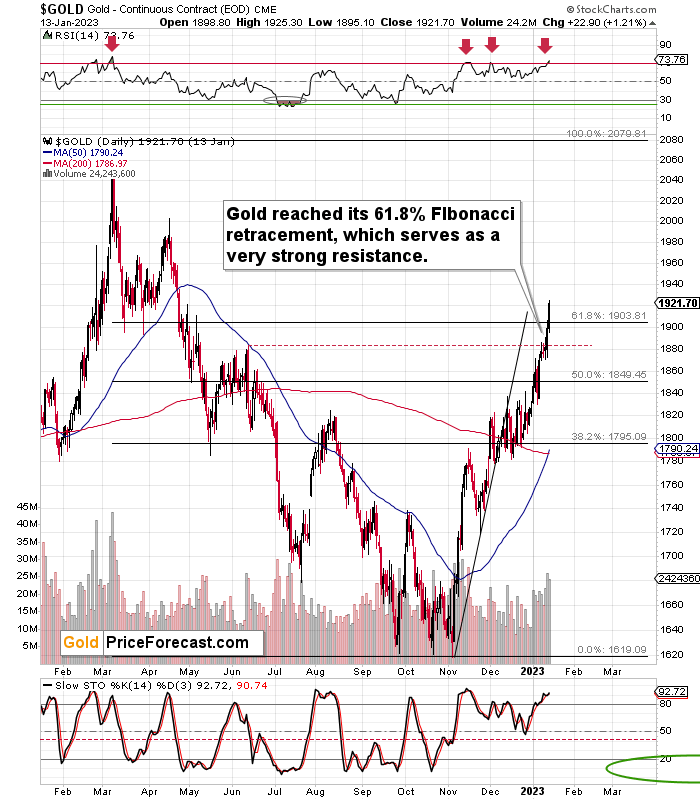
In my yesterday’s extra Gold Trading Alert, I wrote that gold would be likely to invalidate Friday’s (Jan. 13) small breakout above the 61.8% Fibonacci retracement level, and it seems that it’s on its way.
In today’s pre-market trading, gold moved lower, which means that the scenario in which it invalidates the above-mentioned breakout and slides in tune with its post-2012-top analogy became even more likely based on today’s pre-market action. Consequently, what I wrote yesterday remains up-to-date.
Once gold slides below $1,900, there will be a breakdown below the very short-term rising support line and invalidation of two breakouts: above the $1,900 level and above the 61.8% Fibonacci retracement. This is likely to happen shortly, and when it happens, it will be a clear sell confirmation.
The above also makes perfect sense in light of the recent sell signal from the RSI indicator based on the daily gold prices. It moved above 70, and this has corresponded to local peaks many times in the past. And yes, it was also what we saw at the 2022 top.
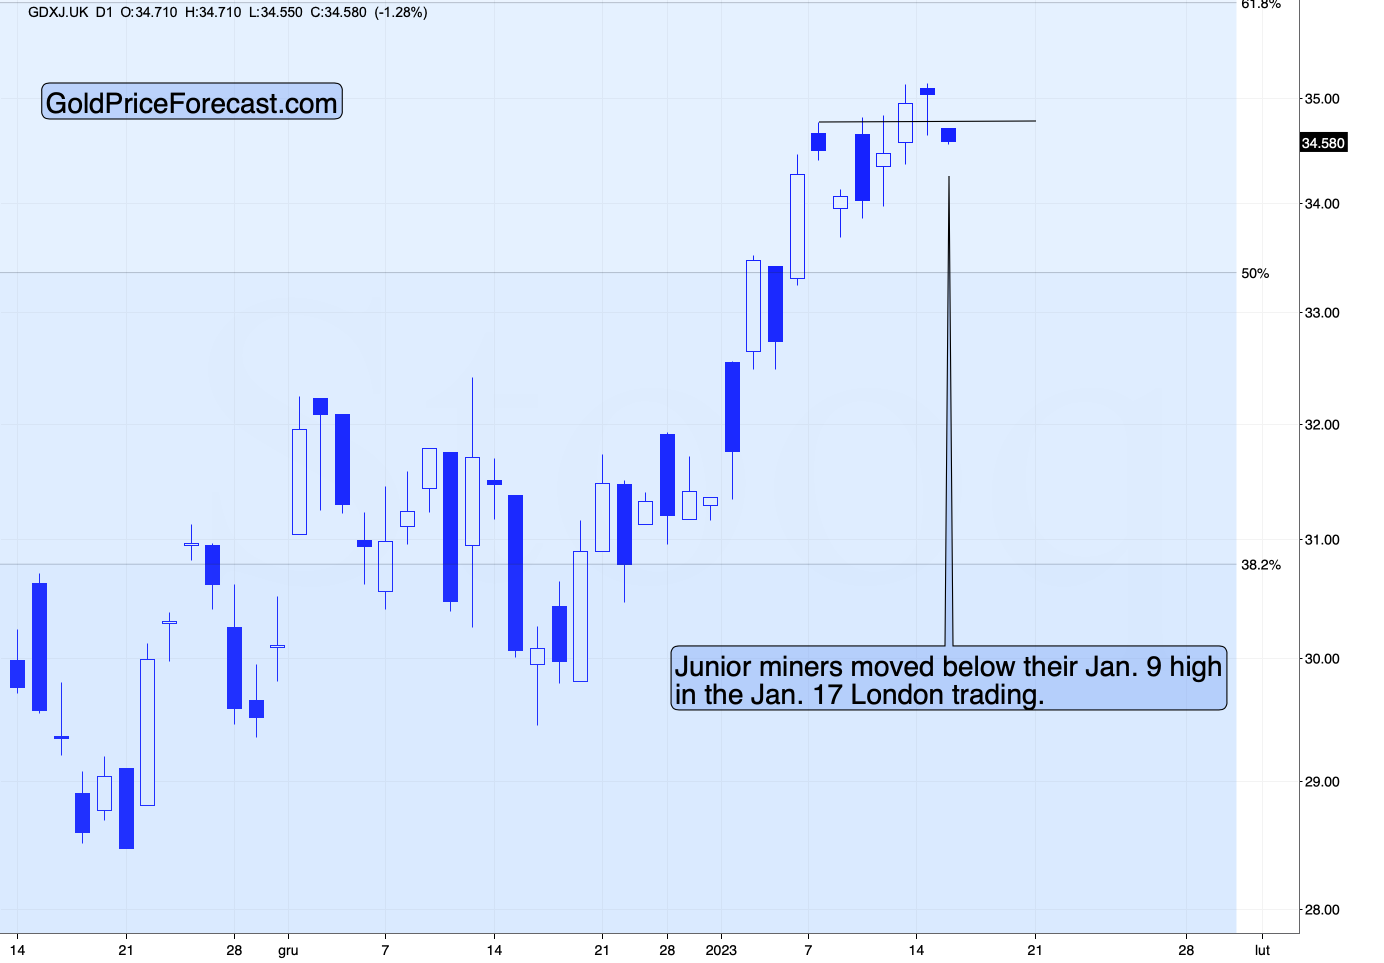
At the moment of writing these words, gold futures are trading at about $1,907, and gold’s intraday high on Jan. 9 was about $1,886. That’s important in light of what’s happening in junior mining stocks in today’s London trading.
Junior miners are already back below their Jan. 9 high, and let’s keep in mind that they didn’t manage to move to their 61.8% retracement based on their 2022 decline.
Why am I writing this? To emphasize that junior miners are underperforming gold in a visible manner. This is a bearish indication.
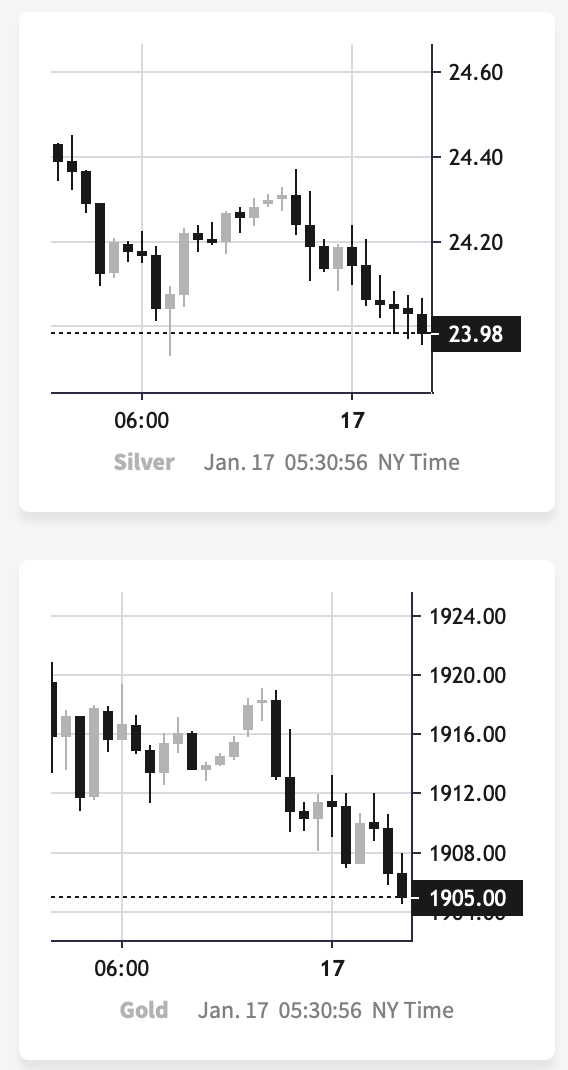
Also, please note that silver (chart courtesy of https://SilverPriceForecast.com) is once again below $24 – this level seems to be the ultimate resistance for the white metal at this time, as it’s been unable to hold above it for long.
I know it might not be easy to view anything as bearish after a short-term rally, but the reality is as above. One might choose not to view this as important, but miners’ underperformance of gold is one of the more reliable trading techniques on the gold market.
Overall, while the recent rally may appear bullish at first glance, the outlook for the precious metals market in the medium and short term is currently bearish, in particular for junior mining stocks.
Having said that, let’s take a look at the markets from a more fundamental point of view.
Is Gold Misjudging the Economic Climate?
While the gold price remains uplifted due to investors’ hopes for a dovish pivot, following the consensus can be akin to trading short-term gains for long-term pain. Moreover, while the crowd expects a sharp decline in inflation and a return to pre-pandemic monetary policy, the largest hedge fund in the world sees that as “the least likely path.”
Bridgewater Associates published its latest research report on Jan. 6; and with co-CIO Bob Prince’s analysis aligning with our expectations, the PMs should confront a turbulent backdrop in the months ahead. He wrote:
“The pandemic threw economies way out of equilibrium…. The key variable in the path to equilibrium is a sustainable 2% inflation rate. With respect to that target, wage inflation is a point of central tendency because a) wages produce income that gets spent, and b) wages are the biggest cost item for companies, an input to pricing.
“Therefore, c) if wages are high, consumers have the money to spend on higher-priced items and companies have the inducement to raise prices by about that amount. This reflexive linkage is inherently self-reinforcing until something stops the cycle.”
He added:
“Wage inflation has broken out to the upside, rising by about 5% in the U.S., and is pervasive across industries, with 14 of 15 major sectors in the US experiencing wage inflation of more than 4%. What that means is that even if goods inflation falls to 2% or below, if wage inflation remains near 5%, overall inflation will tend to revert toward 5%.”
As a result, while we have been warning for months that wage inflation is the canary in the coal mine, the crowd underestimates the implications for future Fed policy. Currently, the consensus expects inflation to decline linearly, with each new Consumer Price Index (CPI) release providing more support for risk assets like gold.
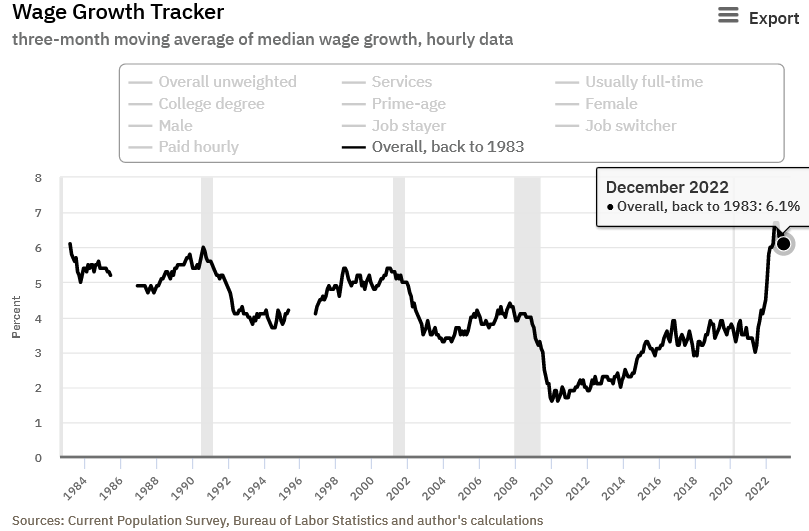
But, with hawkish economic data from Indeed, ADP and the Atlanta Fed highlighting wage growth that exceeds 6%, the fundamental backdrop does not support the optimism priced into the financial markets.
Please see below:
To explain, the Atlanta Fed updated its Wage Growth Tracker on Jan. 12, and the metric remains highly elevated at 6.1%.
Prince continued:
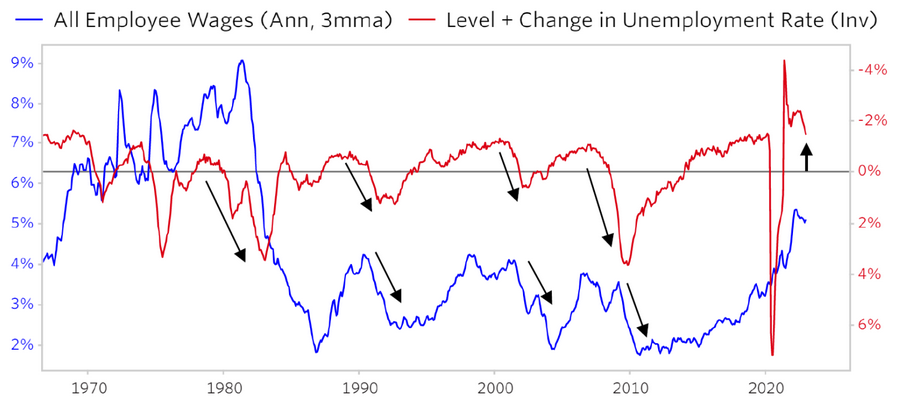
“Nominal spending growth and unemployment are now upward rather than downward pressures on wages…. In order for this quantity influence to be a downward force on wages, you need at least a 2% rise in unemployment sustained over a long enough period of time to impact the supply/demand balance for labor. Historically, this has been about 18 months….
“To push the unemployment rate up, nominal spending must fall relative to wages – i.e., revenues must fall relative to costs, squeezing margins, in order to induce layoffs.”
Please see below:
 Source: Bridgewater Associates
To explain, the blue line above tracks the percentage change in annualized three-month wage growth, while the red line above tracks the inverted (down means up) percentage change in the unemployment rate. If you analyze the relationship, you can see that when the blue line is near 2% (the scale on the left), the red line often needs to rise by 2% (the scale on the right). Consequently, a 2% increase in the U.S. unemployment rate needs to be sustained to normalize wage inflation to a level that supports 2% output inflation.
Yet, if you focus your attention on the right side of the chart, you can see that the two lines are far from an inflation equilibrium. As such, the crowd misjudges the amount of demand destruction required to create the fundamental outcome that’s currently priced in.
To that point, Prince noted:
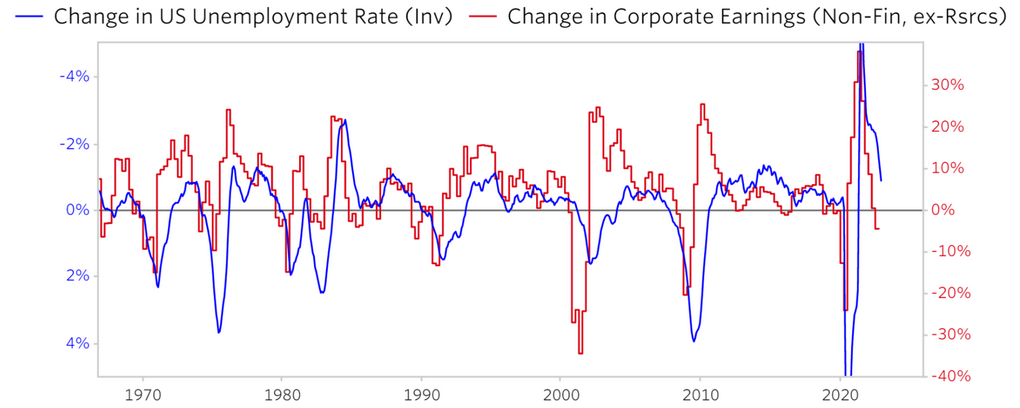
“There has never been a big rise in the unemployment rate without a decline in corporate earnings. Corporate earnings need to fall by about 20% in order to induce the degree of layoffs necessary to push the unemployment rate up by enough to bring wages down. This has also not happened yet.”
Please see below:
 Source: Bridgewater Associates
To explain, the blue line above tracks the inverted percentage change in the U.S. unemployment rate, while the red line above tracks the percentage change in corporate earnings (excluding resources).
If you analyze the relationship, you can see that a 2% rise in the blue line often culminates with a 20% decline in the red line, and if a 2% rise in unemployment is needed to reduce wage inflation, the implications are highly bearish for corporate profits. Therefore, the rosy narrative contrasts fundamental reality.
Remember, narratives move markets in the short term, but they only hold weight over the medium term if they make sense. For example, if a fitness trainer said you could eat what you want, whenever you want, and still lose weight, you may be hesitant to believe that story.
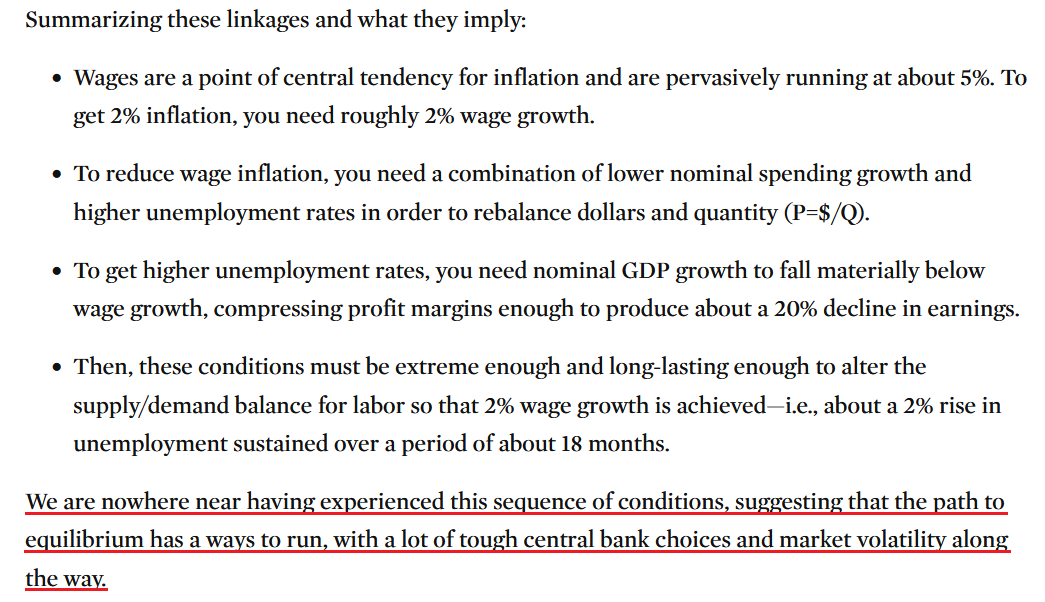
Well, as it relates to the financial markets, investors’ recipe for 2% inflation and a soft landing is similar, as they lack the necessary ingredients to make their expectations a reality. Thus, Prince summarized:
 Source: Bridgewater Associates
Overall, the bulls created a narrative and momentum has more investors buying into the proposition. In contrast, we have been consistent in our thesis that the Fed’s inflation fight is far from over. Historically, inflation does not decline linearly, and all instances since 1954 have resulted in interest rates peaking at significantly higher levels than where they are now.
Furthermore, as Prince pointed out, 5%+ wage inflation is not consistent with 2% output inflation; and while we have warned about this for many months, the ramifications are far from priced in. As a result, the crowds’ disdain for the details should upend several risk assets, including gold, silver and mining stocks, in the months ahead.
What do you think about Prince’s assessment? How does wage inflation come down without a sharp rise in the unemployment rate? Or, can the bulls create the outcome they want without the necessary economic conditions?
Is Silver Blinded by Its Recent Shine?
With profound imbalances still far from settled, the financial markets have chosen hope over reality. Moreover, while a major recession could create an economic malaise in late 2023, the current environment supports higher, not lower interest rates.
For example, Indeed released its 2023 U.S. Labor Market Outlook report on Jan. 12. An excerpt read:
“The U.S. labor market entered this year with considerable strength. Demand for workers is strong but moderating, suggesting employers are looking to add more headcount despite recession fears.”
Please see below:
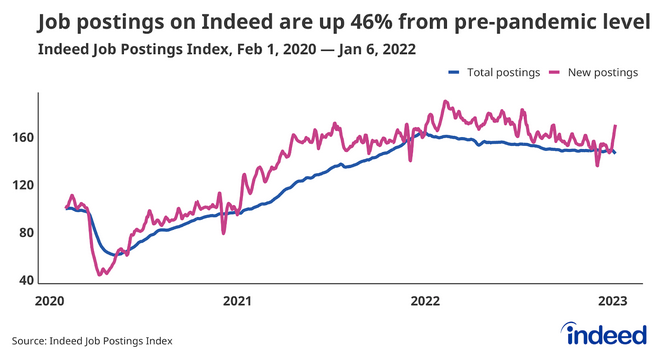
To explain, the blue line above shows that U.S. job postings on Indeed are still 46% above their pre-pandemic baseline, which highlights the resiliency of the U.S. economy. Likewise, the purple line above shows that new job postings on the site remain elevated and rose materially at the end of 2022. Therefore, the implications for labor demand and wage inflation continue to unfold as expected.
The report added:
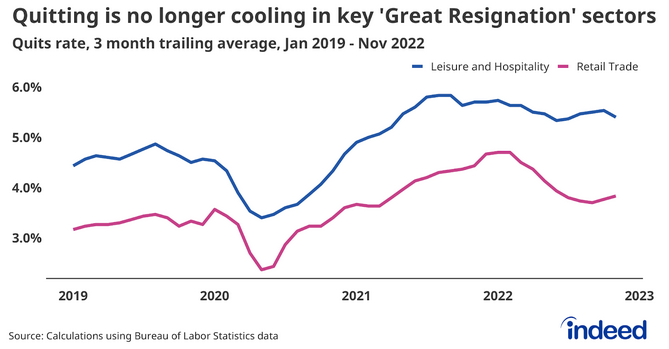
“The experience of the Leisure and Hospitality and Retail Trade sectors is instructive. Workers in these sectors were in high demand. Leveraging that advantage, these employees realized fast wage gains and increased access to other forms of compensation….
“Their ability to quit a job and move to a new one is still sending strong signals. We will keep an eye on this metric to see how powerful these workers will become in 2023.”
Please see below:
To explain, the blue and purple lines above show how quit rates among leisure & hospitality and retail employees have increased recently after leveling off for much of 2022; and please note, Americans don’t quit their jobs unless they are financially stable or have better positions lined up. Consequently, the data is bullish for wage inflation.
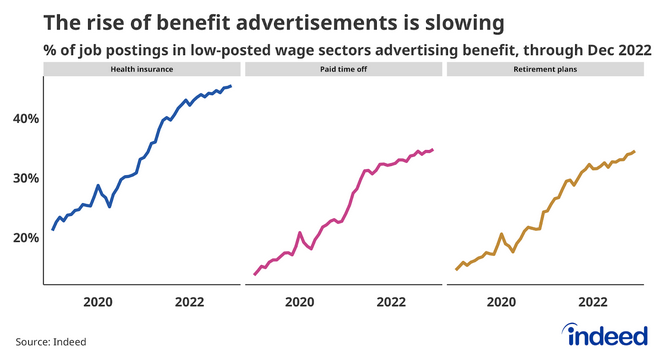
On top of that, while Indeed noted that “the increases slowed near the last half of 2022… employers [are] advertising benefits at a higher rate than in the past.”
Please see below:
To explain, the blue, purple, and brown lines above show that job postings on Indeed that include health, paid time off, and retirement benefits continue to hit new highs. So, if demand destruction was present, employers would not be offering extra incentives plus higher wages to attract talent, and that’s why the crowd underestimates the ultimate peak of the U.S. federal funds rate (FFR).
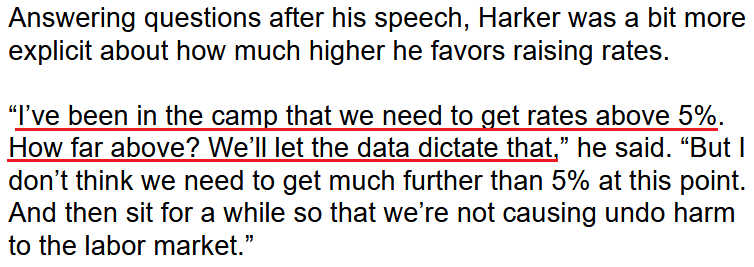
Speaking of which, while investors price in a lower peak FFR than the FOMC and subsequent rate cuts in 2023, Philadelphia Fed President Patrick Harker said on Jan. 12:
“I expect that we will raise rates a few more times this year, though, to my mind, the days of us raising them 75 basis points at a time have surely passed. In my view, hikes of 25 basis points will be appropriate going forward.”
As a result, while 25 basis points may seem relatively dovish, please remember that higher interest rates are hawkish no matter the increment. Moreover, even if the Fed raises the FFR to 5% and holds it there in 2023, the outcome is still more hawkish than what’s priced in.
Please see below:
Likewise, while we’ve noted the performance of the Atlanta Fed’s Sticky CPIs and their implications for broad-based inflation, Richmond Fed President Thomas Barkin said on Jan. 12:
“I would caution that while the average dropped, the median stayed high. That’s because the average was distorted by declining prices for goods like used cars that escalated unsustainably during the pandemic.
“If the center of the [CPI] distribution remains above our target, then I think we should continue to move rates. Inflation is going to be more persistent than a simple drop down to 2%.”
Making three of a kind, St. Louis Fed President James Bullard said on Jan. 12:
“There's probably too much optimism inflation is going to easily come back to 2%. That is not the history of inflation. We are really moving into an era of higher nominal interest rates for quite a while going forward as we try to continue to put downward pressure.”
As such, while the crowd expects rate cuts in the months ahead, the fundamentals and the Fed’s messaging support a materially different outcome.
Please see below:
In addition, with the U.S. 10-Year real yield often peaking alongside the FFR, continued rate increases are bullish for one of silver’s main fundamental adversaries. To explain, we wrote on Jan. 10:
With the U.S. 10-Year real yield hitting a 2022 high of 1.74% and ending the Jan. 9 session at 1.31%, a rise above 2% is well within the expected range of outcomes. Furthermore, if the FFR surpasses the YoY core CPI like it has in every inflation fight since 1961, the U.S. 10-Year real yield could hit 2.5% or more. Either way, the current market pricings contrast the historical and economic realities required to normalize inflation.
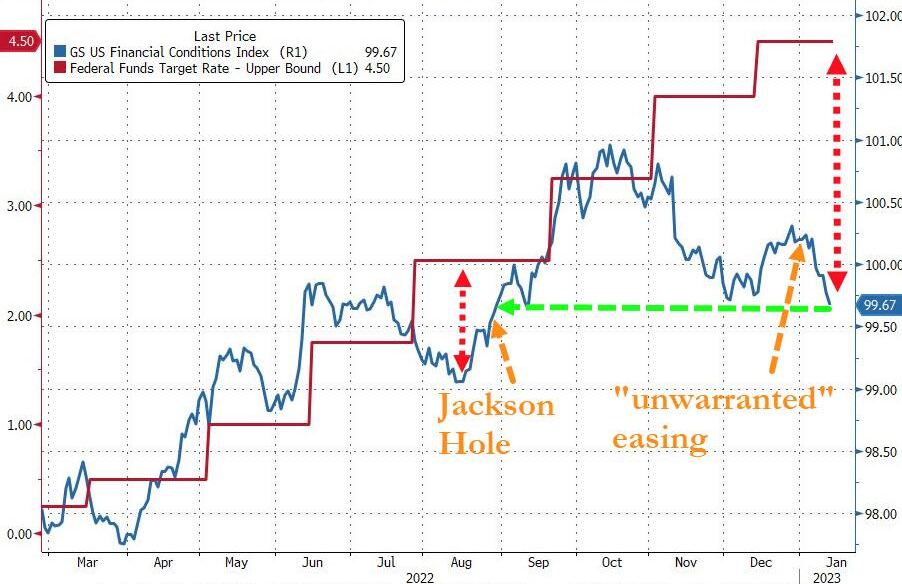
Finally, with investors’ optimism poised to be their downfall, the loosening of financial conditions makes it even more likely that inflation will stay uplifted for longer than the consensus expects.
Please see below:
To explain, the red line above tracks the FFR’s upper bound, while the blue line above tracks the Goldman Sachs Financial Conditions Index (FCI). If you analyze the right side of the chart, you can see that the FCI has fallen below its December lows, which only makes the Fed’s job more difficult.
Therefore, if the divergence continues, the stimulative effect undermines the Fed’s current progress and lessens the impact of any future progress. As a result, investors’ expectations contrast with the environment needed to win this inflation battle.
Overall, the silver price remains well above its fundamental value, as we believe the days of pre-pandemic monetary policy are long gone. Moreover, with a sharp contraction of economic activity likely needed to normalize inflation, a major sell-off of the S&P 500 should materialize in the months ahead; and with silver hitting its 2022 lows alongside the S&P 500 in September and October, the correlation should prove ominous once again.
What do you think? Does the FCI move higher in H1 2023? Why is the consensus playing chicken with the Fed? Who do you see emerging victorious?
The Bottom Line
While a lack of fear and fundamental downside catalysts keep risk assets elevated in the short term, the mood music should change dramatically in the months ahead. With investors ignoring history, and instead, assuming the Fed will accomplish things it rarely or never has, asset prices remain in la-la land. But, with a profound recalibration poised to commence as higher interest rates weigh on the U.S. economy, considerable downside should confront gold, silver and mining stocks before this bear market ends.
In conclusion, the PMs rallied on Jan. 13, as the momentum trade continued. However, while the USD Index ended the day roughly flat, the U.S. 10-Year real yield jumped by nine basis points. As such, we still expect the latter two to make substantial comebacks in 2023.
Overview of the Upcoming Part of the Decline
- It seems to me that the corrective upswing is over (or about to be over) and that the next big move lower is already underway (or that it’s about to start).
- If we see a situation where miners slide in a meaningful and volatile way while silver doesn’t (it just declines moderately), I plan to – once again – switch from short positions in miners to short positions in silver. At this time, it’s too early to say at what price levels this could take place and if we get this kind of opportunity at all – perhaps with gold prices close to $1,500 - $1,550.
- I plan to switch from the short positions in junior mining stocks or silver (whichever I’ll have at that moment) to long positions in junior mining stocks when gold / mining stocks move to their 2020 lows (approximately). While I’m probably not going to write about it at this stage yet, this is when some investors might consider getting back in with their long-term investing capital (or perhaps 1/3 or 1/2 thereof).
- I plan to return to short positions in junior mining stocks after a rebound – and the rebound could take gold from about $1,450 to about $1,550, and it could take the GDXJ from about $20 to about $24. In other words, I’m currently planning to go long when GDXJ is close to $20 (which might take place when gold is close to $1,450), and I’m planning to exit this long position and re-enter the short position once we see a corrective rally to $24 in the GDXJ (which might take place when gold is close to $1,550).
- I plan to exit all remaining short positions once gold shows substantial strength relative to the USD Index while the latter is still rallying. This may be the case with gold prices close to $1,400 and GDXJ close to $15 . This moment (when gold performs very strongly against the rallying USD and miners are strong relative to gold after its substantial decline) is likely to be the best entry point for long-term investments, in my view. This can also happen with gold close to $1,400, but at the moment it’s too early to say with certainty.
- The above is based on the information available today, and it might change in the following days/weeks.
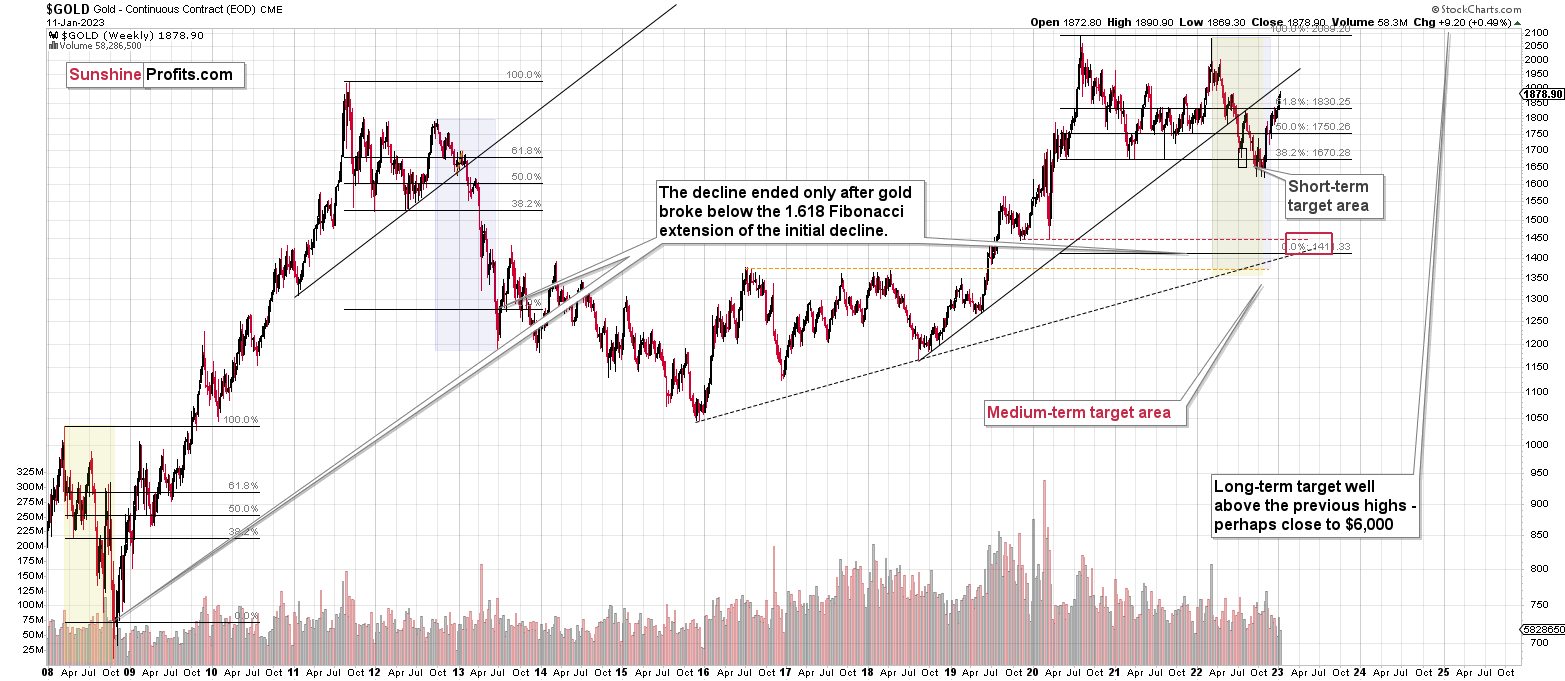
You will find my general overview of the outlook for gold on the chart below:
Please note that the above timing details are relatively broad and “for general overview only” – so that you know more or less what I think and how volatile I think the moves are likely to be – on an approximate basis. These time targets are not binding nor clear enough for me to think that they should be used for purchasing options, warrants, or similar instruments.
Letters to the Editor
We received a few messages over e-mail, but as we are moving to our new platform, we will be transferring them below the articles as comments – and that’s where we’ll be replying to them.
Asking your questions below the articles or in the spaces called “Ask the Community” or “Position Sizes” directly will help us deliver a reply sooner. In some cases, someone from the community might reply and help even before we do.
Please remember about the Pillars of our Community, especially about the Kindness of Speech Pillar.
Also, if there’s anything that you’re unhappy with, it’s best to send us a message at [email protected].
Please note that this section is going to go away within the next 1-8 weeks, as you can add comments/questions below the article on Golden Meadow – the platform that we’re using to provide our analyses. Your notification e-mails include an invitation link that allows you to access the “Gold Trading Alerts” space.
Also, if you haven’t had the chance to see the video, in which I’m talking about the new platform and why we essentially moved from Sunshine Profits to Golden Meadow, I strongly encourage you to do so:
Summary
Summing up, it seems that the major bottom in the USD Index is in (or at hand), while the correction in stocks, gold, silver, and mining stocks is over – or very close to being over.
Gold and junior miners corrected less than 61.8% of their 2022 decline, while silver corrected over 61.8% of the decline. Silver’s move above the 61.8% Fibonacci retracement was already invalidated, suggesting that the next big move lower is starting or about to start.
Now, as more investors realize that interest rates will have to rise sooner than expected, the prices of precious metals and mining stocks (as well as other stocks) are likely to fall. In my opinion, the current trading position is going to become profitable in the following weeks, and quite possibly in the following days. And while I can’t promise any kind of performance, I fully expect it to become very profitable before it’s over and to prolong our 2022 winning streak.
After the final sell-off (that takes gold to about $1,350-$1,500), I expect the precious metals to rally significantly. The final part of the decline might take as little as 1-5 weeks, so it's important to stay alert to any changes.
As always, we'll keep you – our subscribers – informed.
To summarize:
Trading capital (supplementary part of the portfolio; our opinion): Full speculative short positions (300% of the full position) in junior mining stocks are justified from the risk to reward point of view with the following binding exit profit-take price levels:
Mining stocks (price levels for the GDXJ ETF): binding profit-take exit price: $20.32; stop-loss: none (the volatility is too big to justify a stop-loss order in case of this particular trade)
Alternatively, if one seeks leverage, we’re providing the binding profit-take levels for the JDST (2x leveraged). The binding profit-take level for the JDST: $22.87; stop-loss for the JDST: none (the volatility is too big to justify a SL order in case of this particular trade).
For-your-information targets (our opinion; we continue to think that mining stocks are the preferred way of taking advantage of the upcoming price move, but if for whatever reason one wants / has to use silver or gold for this trade, we are providing the details anyway.):
Silver futures downside profit-take exit price: $14.32
SLV profit-take exit price: $13.42
ZSL profit-take exit price: $48.87
Gold futures downside profit-take exit price: $1,504
HGD.TO – alternative (Canadian) 2x inverse leveraged gold stocks ETF – the upside profit-take exit price: $16.47
HZD.TO – alternative (Canadian) 2x inverse leveraged silver ETF – the upside profit-take exit price: $36.87
Long-term capital (core part of the portfolio; our opinion): No positions (in other words: cash)
Insurance capital (core part of the portfolio; our opinion): Full position
Whether you’ve already subscribed or not, we encourage you to find out how to make the most of our alerts and read our replies to the most common alert-and-gold-trading-related-questions.
Please note that we describe the situation for the day that the alert is posted in the trading section. In other words, if we are writing about a speculative position, it means that it is up-to-date on the day it was posted. We are also featuring the initial target prices to decide whether keeping a position on a given day is in tune with your approach (some moves are too small for medium-term traders, and some might appear too big for day-traders).
Additionally, you might want to read why our stop-loss orders are usually relatively far from the current price.
Please note that a full position doesn't mean using all of the capital for a given trade. You will find details on our thoughts on gold portfolio structuring in the Key Insights section on our website.
As a reminder - "initial target price" means exactly that - an "initial" one. It's not a price level at which we suggest closing positions. If this becomes the case (as it did in the previous trade), we will refer to these levels as levels of exit orders (exactly as we've done previously). Stop-loss levels, however, are naturally not "initial", but something that, in our opinion, might be entered as an order.
Since it is impossible to synchronize target prices and stop-loss levels for all the ETFs and ETNs with the main markets that we provide these levels for (gold, silver and mining stocks - the GDX ETF), the stop-loss levels and target prices for other ETNs and ETF (among other: UGL, GLL, AGQ, ZSL, NUGT, DUST, JNUG, JDST) are provided as supplementary, and not as "final". This means that if a stop-loss or a target level is reached for any of the "additional instruments" (GLL for instance), but not for the "main instrument" (gold in this case), we will view positions in both gold and GLL as still open and the stop-loss for GLL would have to be moved lower. On the other hand, if gold moves to a stop-loss level but GLL doesn't, then we will view both positions (in gold and GLL) as closed. In other words, since it's not possible to be 100% certain that each related instrument moves to a given level when the underlying instrument does, we can't provide levels that would be binding. The levels that we do provide are our best estimate of the levels that will correspond to the levels in the underlying assets, but it will be the underlying assets that one will need to focus on regarding the signs pointing to closing a given position or keeping it open. We might adjust the levels in the "additional instruments" without adjusting the levels in the "main instruments", which will simply mean that we have improved our estimation of these levels, not that we changed our outlook on the markets. We are already working on a tool that would update these levels daily for the most popular ETFs, ETNs and individual mining stocks.
Our preferred ways to invest in and to trade gold along with the reasoning can be found in the how to buy gold section. Furthermore, our preferred ETFs and ETNs can be found in our Gold & Silver ETF Ranking.
As a reminder, Gold & Silver Trading Alerts are posted before or on each trading day (we usually post them before the opening bell, but we don't promise doing that each day). If there's anything urgent, we will send you an additional small alert before posting the main one.
Thank you.
Przemyslaw K. Radomski, CFA
Founder, Editor-in-chief


