Briefly: in our opinion, full (300% of the regular position size) speculative short positions in junior mining stocks are justified from the risk/reward point of view at the moment of publishing this Alert.
Gold reversed once again yesterday, as there were no specific indications from Powell during his speech. Please take a look at the chart for details:
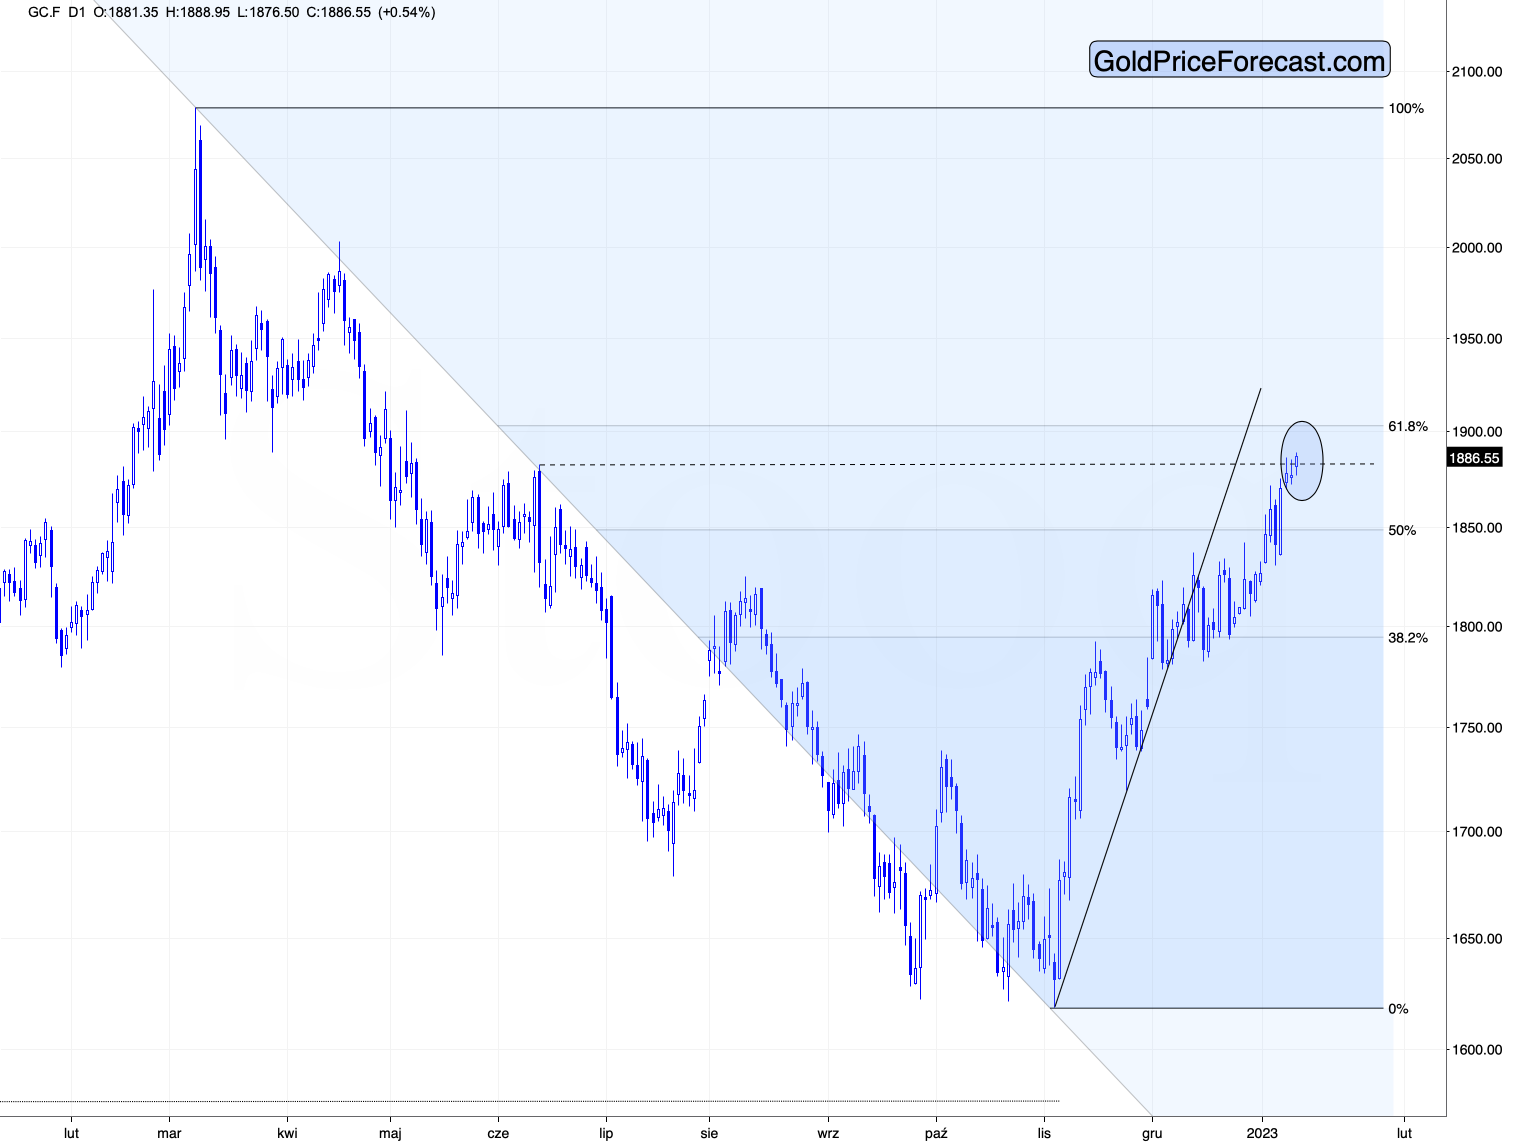 So far, gold is higher in today’s pre-market trading (and silver once again moved close to $24 - nothing new here), and it could be the case that we see yet another reversal today.
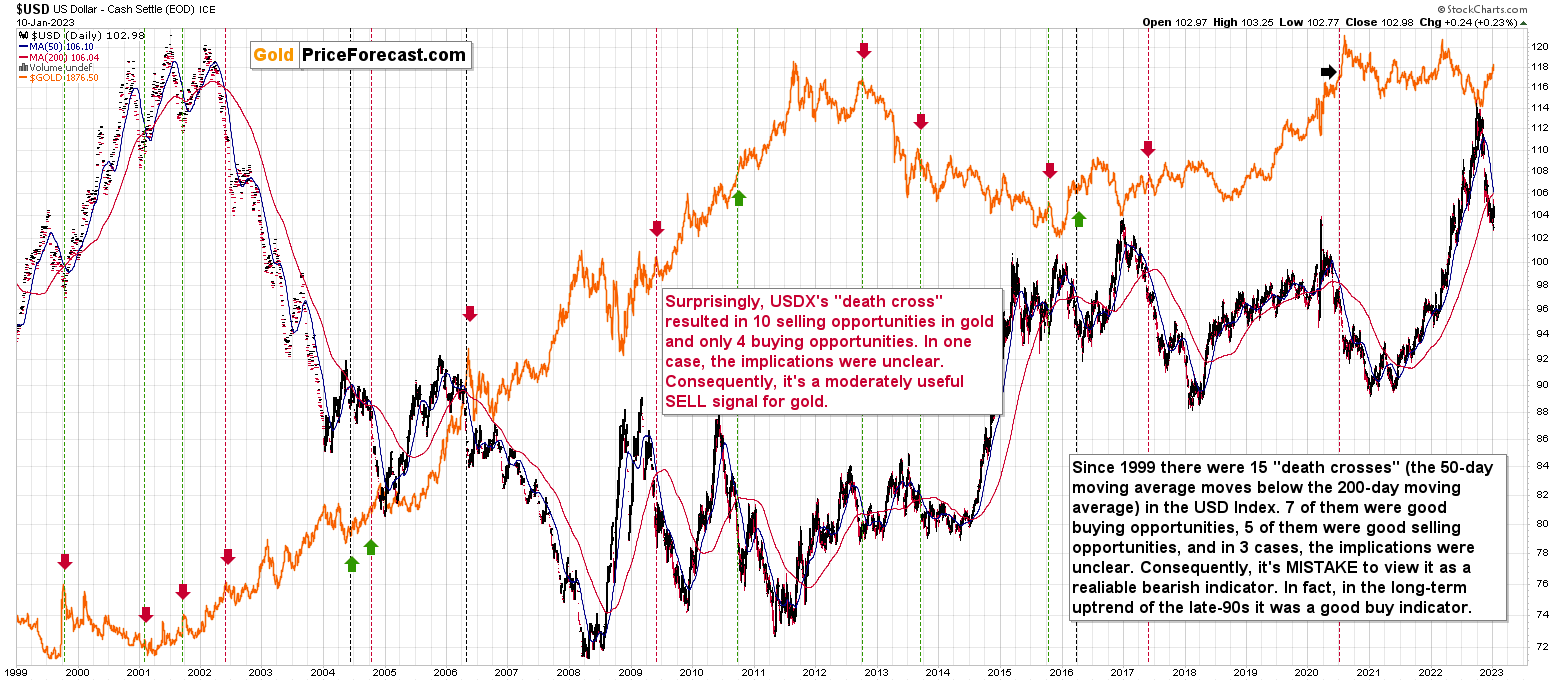
It might seem that nothing interesting is happening on the markets at this very moment, but… There were two things that we were asked to comment on recently. One of those things is gold and the USD Index, and the other thing is the (probably) approaching “death cross” in the USD Index.
The death cross is formed when the 50-day moving average moves below the 200-day moving average, and it seems that we’re about to see something like that in the USDX. What are the implications for the USDX? And what are they for gold? Interestingly, they are not mirror images of each other. I prepared a video in which I go over the details. I’m also attaching the chart that I covered during the video.
 Having said that, let’s take a look at the markets from a more fundamental point of view.
Powell Speaks, Gold Yawns
With investors anticipating Fed Chairman Jerome Powell’s speech on Jan. 10, anxiety was amplified ahead of the typically market-moving event. However, with the central bank chief not commenting directly on the future path of interest rates, the event didn’t live up to the hype.
Yet, with not-so-subtle clues signaling what’s to come, Powell said:
“Price stability is the bedrock of a healthy economy and provides the public with immeasurable benefits over time. But restoring price stability when inflation is high can require measures that are not popular in the short term as we raise interest rates to slow the economy.
“The absence of direct political control over our decisions allows us to take these necessary measures without considering short-term political factors.”
So, while Powell stated that controlling inflation requires “measures that are not popular in the short term,” he reiterated his belief that a steady rise in the U.S. federal funds rate (FFR) is preferable to a stop-go approach.
Furthermore, his mention of “short-term political factors” was a direct pushback against the Democrats, who falsely assume that a dovish pivot will keep the unemployment rate from rising. In reality, letting unanchored inflation run often results in worse recessions than accepting the consequences of a higher FFR.
Likewise, while the crowd has ignored Fed officials’ hawkish warnings in recent weeks, Powell largely confirmed their message on Jan. 10. As a result, higher interest rates and continued QT should remain prevalent in the months ahead.
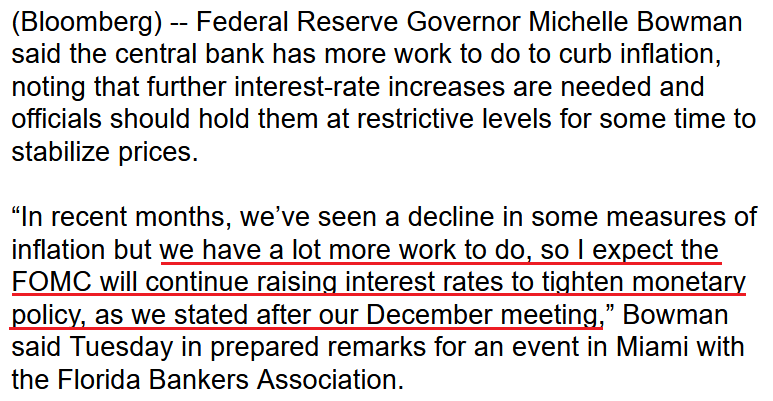
To that point, Fed Governor Michelle Bowman said on Jan. 10:
“It’s important to keep in mind that there are costs and risks to tightening policy to lower inflation, but I see the costs and risks of allowing inflation to persist as far greater….
“I expect that once we achieve a sufficiently restrictive federal funds rate, it will need to remain at that level for some time in order to restore price stability, which will in turn help to create conditions that support a sustainably strong labor market.”
Thus, it was another day, and another dose of reality that the financial markets ignored.
Please see below:
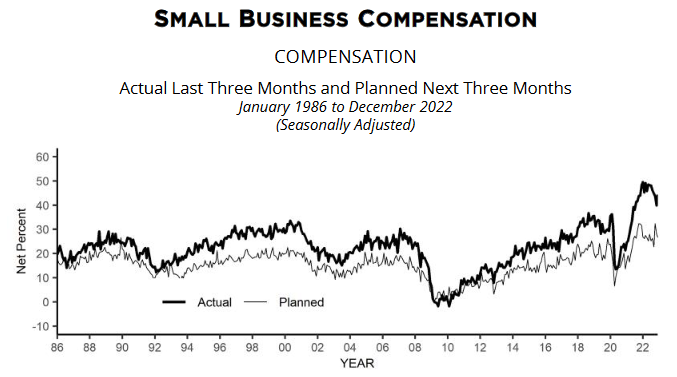
On top of that, the NFIB released its Small Business Optimism Index on Jan. 10; and while the net percentage of firms increasing their output prices declined in December, the report stated:
“A net 44 percent reported raising compensation, up 4 points from November. A net 27 percent plan to raise compensation in the next three months, down 1 point from November.”
Consequently, while we warned that wage inflation would remain a thorn in the Fed’s side, the uptick in December highlights the challenges that lie ahead.
Please see below:
To explain, the net percentage of firms reporting actual compensation changes (the black line above) re-accelerated in December, and remains elevated relative to its historical norm. In addition, while the gray line above signals that fewer small businesses expect higher wages in the months ahead, the divergence emphasizes the realities on the ground: while firms may want to reduce their employment costs, the supply/demand imbalance in the U.S labor market is not helping.
As a result, it’s unrealistic for the Fed to materially reduce output inflation when wages are running at 6%+.
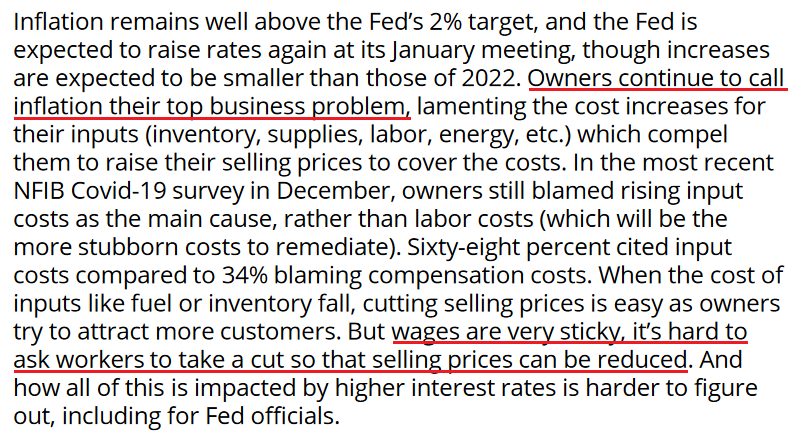
As further evidence, the NFIB summary read:
So, while investors celebrate the reduction in oil prices and their impact on the headline Consumer Price Index (CPI), the NFIB highlighted how “cutting selling prices is easy” when “the cost of inputs like fuel or inventory fall.”
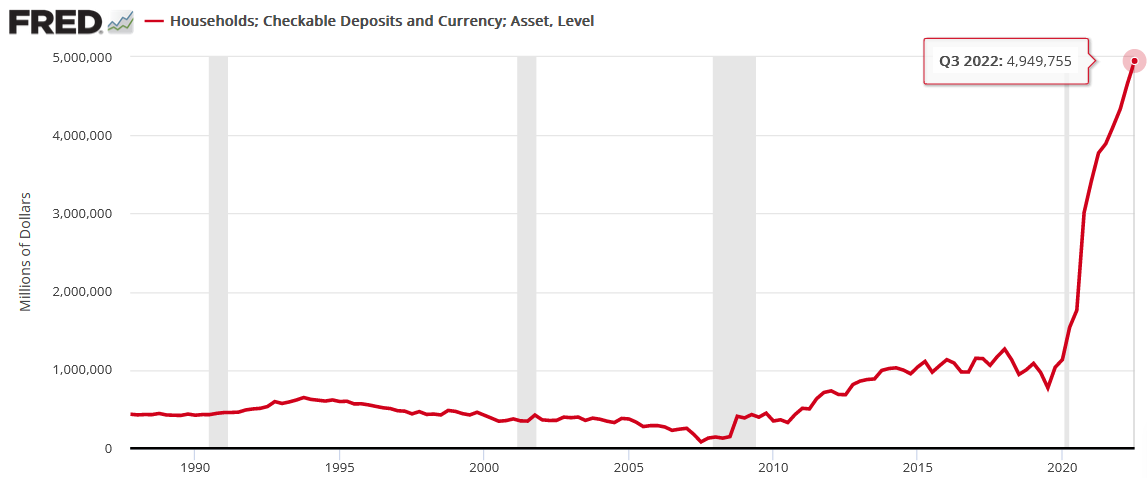
In contrast, wages are much more problematic, and with the growth occurring alongside record household checkable deposits, the impacts of unprecedented stimulus are far from resolved. To explain, we wrote on Dec. 13:
While the FFR has surged in 2022 and the crowd still assumes that demand will collapse, the Fed revealed on Dec. 9 that U.S. households have a record ~$4.95 trillion (as of Q3 2022) in their checking and/or demand deposit accounts, which is 379% more than Q4 2019 and 6.3% more than Q2 2022.
Please see below:
Consequently, while investors wait for a destitute consumer to reduce inflation and allow the Fed to pivot, the vertical ascent on the right side of the chart above highlights the profound stimulus imbalance that materialized during the pandemic; and with wage growth also near an all-time high, investors are kidding themselves if they think monetary policy can return to its pre-pandemic state when Americans’ checking account balances have gone parabolic.
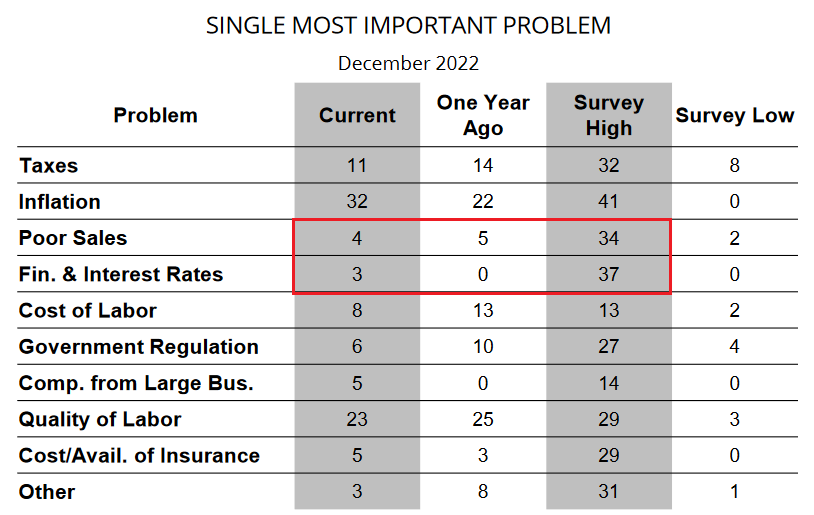
Continuing the theme, the NFIB revealed that interest rates and poor sales are among the least pressing issues confronting U.S. small businesses.
Please see below:
To explain, the table above tracks the net percentage of firms that cite a particular issue as their “single most important problem.” If you analyze the red rectangle, you can see that poor sales declined from 5 in December 2021 to 4 in December 2022. Furthermore, with the current metric nowhere near the survey high of 34, demand destruction is not small businesses’ primary concern.
Likewise, while the FFR soared in 2022, the net percentage of firms lamenting higher interest rates only increased from 0 in December 2021 to 3 in December 2022, which is far from the survey high of 37.
Therefore, small businesses are most concerned about inflation, while worries about higher interest rates and demand destruction are nowhere near crisis levels.
As such, while the crowd assumes that a lower headline CPI means the Fed is near a pivot, the resiliency of core inflation highlights the embedded pricing pressures. Moreover, even though the headline CPI decelerated in November, the Atlanta Fed’s headline and core Sticky CPIs hit new 2022 highs. As a result, asset prices do not reflect the hawkish realities that should confront the financial markets in the months ahead.
Overall, gold has begun the New Year on a high note, as stock, bond and currency markets seem inclined to buy the pivot narrative. Yet, the fundamentals don’t support their conclusion, and dovish re-pricings throughout 2022 ended badly for the bulls. Consequently, we see this iteration as no different.
Let us know what you think. Why is the crowd so dismissive of the hawkish ramifications? Or, is the consensus right to expect a dovish pivot? How does gold respond if this week’s CPI print comes in cooler than expected?
Silver Should Slide With the S&P 500
While stagflation or a recession could have bullish implications for silver, a sharp drawdown of the S&P 500 could upend that optimism. For example, the white metal sunk to its 2022 lows alongside the S&P 500 in September and October, and liquidations often affect all risk assets. So, if the S&P 500 suffers mightily as the Fed suppresses demand, the silver price may not look so nice when it’s all said and done.
Morgan Stanley’s Chief U.S. Equity Strategist Mike Wilson wrote on Jan. 9:
“Our concern is that most are assuming 'everyone is bearish,' and, therefore, the price downside in a recession is also likely to be mild (SPX 3,500-3,600). On this score, the surprise might be how much lower stocks could trade (3,000) if a recession arrives.”
He added:
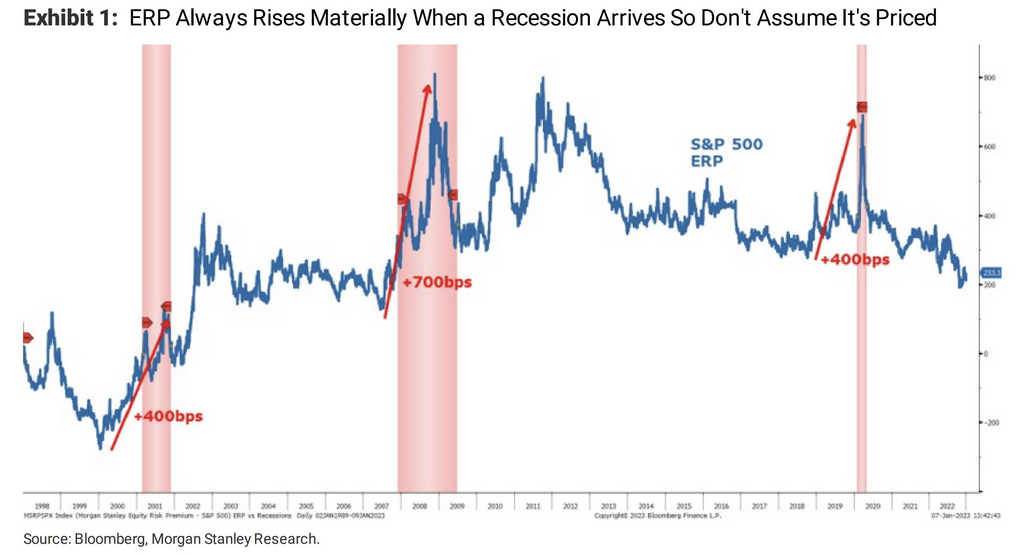
“When a recession arrives, the [equity risk premium] always rises significantly from whatever level you are starting at. In other words, if you think a mild recession is coming, you cannot assume the market has priced it given the ERP is at its lowest level since the run up to the Great Financial Crisis in 2008.”
Please see below:
To explain, the ERP measures the expected return over the risk-free rate that investors require to own stocks. When economic conditions are prosperous, the ERP declines because risks to corporate earnings fall. However, when recessions arrive, the dynamic reverses; and while nine of the last 10 bouts of rising inflation have ended with recessions, the prospect is far from priced in.
For example, the blue line on the right side of the chart shows how the ERP is near its pre-GFC lows, despite ~40-year high inflation and a hawkish Fed. More importantly, the vertical pink bars highlight how when recessions arrive, the ERP often rallies by 400 to 700 basis points; and with higher risk premiums culminating with lower stock prices, another bout of panic could reprise what occurred in September and October.
Wilson concluded:
Lower inflation “ignores the ramifications of falling prices on profit margins, which is likely to outweigh any benefit from the perceived Fed dovishness equity investors are dreaming about later this year....
“The bottom line, we don't think a 3,500-3,600 S&P 500 is consistent with the consensus view for a mild recession. That is one way the consensus could be right directionally, but wrong in terms of magnitude.”
So, while the S&P 500 may be in the midst of a short-term uptrend, the medium-term implications are much more ominous.
Speaking of which, the consensus expects an unrealistic outcome where inflation recedes rapidly and corporate profits remain uplifted. As such, they expect ~$229 in S&P 500 earnings in 2023 (as of Jan. 9), which amounts to 4.3% year-over-year (YoY) growth.
Please see below:
Conversely, Wilson’s base case is $195, and his bear case is $180. Likewise, UBS’ strategists told clients on Jan. 5:
“With UBS econ forecasting a U.S. recession for Q2-Q4 '23, the setup is essentially a race between easing inflation and financial conditions versus the coming hit to growth and earnings.
"We forecast S&P 500 2023 EPS to fall >11% to $198 with margins declining below '20 levels for S&P ex Fins/Energy. We see 3,200 in Q2 on 14.5x fwd EPS of $220 as a reasonable trough assuming further cuts to estimates in line with a pre-recession pace.”
As a result, if sub-$200 EPS occurs alongside a recession in 2023, a sharp spike in the ERP could dramatically impact silver’s performance.
Overall, risk assets remain in la-la land, as investors’ expectations contrast fundamental reality. In 2021, corporate revenues and profits were uplifted by inflation, as nominal metrics benefited from price increases, even alongside flat volume. But, many companies had little real (inflation-adjusted) growth, and those price increases were paramount to meeting expectations.
Therefore, if those price increases go away and inflation recedes, nominal revenue and earnings should decline along with them. Consequently, the crowd should confront plenty of ‘surprises’ throughout 2023.
How do you see the fundamentals unfolding? Why is positioning so optimistic despite the economic risks? Can inflation decline without crimping the S&P 500’s EPS?
The Bottom Line
Momentum continues to reign, as a lack of bearish catalysts keeps investors sanguine for the time being. Moreover, with ~13 years of dovish pivots programming investors to believe that the Fed can solve every problem, recency bias has the crowd more worried about missing a melt-up than suffering through a meltdown. In contrast, high inflation makes the fundamentals much different than the post-GFC environment, and while it’s hard to teach an old dog new tricks, that reality should dawn on the dip buyers in the months ahead.
In conclusion, the PMs were mixed on Jan. 10, as mining stocks tracked the S&P 500 higher. However, the USD Index rallied and the U.S. 10-Year real yield followed suit. Thus, while the pair’s recent consolidations have calmed the bulls’ nerves, new highs for both should result in new lows for the PMs and the S&P 500 over the medium term.
Overview of the Upcoming Part of the Decline
- It seems to me that the corrective upswing is over (or about to be over) and that the next big move lower is already underway (or that it’s about to start).
- If we see a situation where miners slide in a meaningful and volatile way while silver doesn’t (it just declines moderately), I plan to – once again – switch from short positions in miners to short positions in silver. At this time, it’s too early to say at what price levels this could take place and if we get this kind of opportunity at all – perhaps with gold prices close to $1,500 - $1,550.
- I plan to switch from the short positions in junior mining stocks or silver (whichever I’ll have at that moment) to long positions in junior mining stocks when gold / mining stocks move to their 2020 lows (approximately). While I’m probably not going to write about it at this stage yet, this is when some investors might consider getting back in with their long-term investing capital (or perhaps 1/3 or 1/2 thereof).
- I plan to return to short positions in junior mining stocks after a rebound – and the rebound could take gold from about $1,450 to about $1,550, and it could take the GDXJ from about $20 to about $24. In other words, I’m currently planning to go long when GDXJ is close to $20 (which might take place when gold is close to $1,450), and I’m planning to exit this long position and re-enter the short position once we see a corrective rally to $24 in the GDXJ (which might take place when gold is close to $1,550).
- I plan to exit all remaining short positions once gold shows substantial strength relative to the USD Index while the latter is still rallying. This may be the case with gold prices close to $1,400 and GDXJ close to $15 . This moment (when gold performs very strongly against the rallying USD and miners are strong relative to gold after its substantial decline) is likely to be the best entry point for long-term investments, in my view. This can also happen with gold close to $1,400, but at the moment it’s too early to say with certainty.
- The above is based on the information available today, and it might change in the following days/weeks.
You will find my general overview of the outlook for gold on the chart below:
Please note that the above timing details are relatively broad and “for general overview only” – so that you know more or less what I think and how volatile I think the moves are likely to be – on an approximate basis. These time targets are not binding nor clear enough for me to think that they should be used for purchasing options, warrants, or similar instruments.
Letters to the Editor
We received a few messages over e-mail, but as we are moving to our new Golden Meadow platform, we will be transferring them below the articles as comments – and that’s where we’ll be replying to them.
On the platform, please ask your questions below the articles or in the spaces called “Ask the Community” or “Position Sizes” directly – it will help us deliver a reply sooner. In some cases, someone from the community might reply and help even before we do.
Please remember about the Pillars of our Community, especially about the Kindness of Speech Pillar.
Also, if there’s anything that you’re unhappy with, it’s best to send us a message at [email protected].
Please note that this section is going to go away within the next 1-8 weeks, as you can add comments/questions below the article on Golden Meadow – the platform that we’re using to provide our analyses. Your notification e-mails include an invitation link that allows you to access the “Gold Trading Alerts” space.
Also, if you haven’t had the chance to see the video, in which I’m talking about the new platform and why we essentially moved from Sunshine Profits to Golden Meadow, I strongly encourage you to do so:
Summary
Summing up, it seems that the major bottom in the USD Index is in, while the correction in stocks, gold, silver, and mining stocks is over or very close to being over.
The nature of the recent corrections was mostly technical and rumor-based. The rumor was that the Fed would be making a dovish U-turn soon, and it recently became clear that this was not going to be the case. Consequently, the corrective upswing is likely to be reversed, and medium-term downtrends are likely to resume.
In my opinion, the current trading position is going to become profitable in the following weeks, and quite possibly in the following days. And while I can’t promise any kind of performance, I fully expect it to become very profitable before it’s over and to prolong our 2022 winning streak.
After the final sell-off (that takes gold to about $1,350-$1,500), I expect the precious metals to rally significantly. The final part of the decline might take as little as 1-5 weeks, so it's important to stay alert to any changes.
As always, we'll keep you – our subscribers – informed.
To summarize:
Trading capital (supplementary part of the portfolio; our opinion): Full speculative short positions (300% of the full position) in junior mining stocks are justified from the risk to reward point of view with the following binding exit profit-take price levels:
Mining stocks (price levels for the GDXJ ETF): binding profit-take exit price: $20.32; stop-loss: none (the volatility is too big to justify a stop-loss order in case of this particular trade)
Alternatively, if one seeks leverage, we’re providing the binding profit-take levels for the JDST (2x leveraged). The binding profit-take level for the JDST: $22.87; stop-loss for the JDST: none (the volatility is too big to justify a SL order in case of this particular trade).
For-your-information targets (our opinion; we continue to think that mining stocks are the preferred way of taking advantage of the upcoming price move, but if for whatever reason one wants / has to use silver or gold for this trade, we are providing the details anyway.):
Silver futures downside profit-take exit price: $14.32
SLV profit-take exit price: $13.42
ZSL profit-take exit price: $48.87
Gold futures downside profit-take exit price: $1,504
HGD.TO – alternative (Canadian) 2x inverse leveraged gold stocks ETF – the upside profit-take exit price: $16.47
HZD.TO – alternative (Canadian) 2x inverse leveraged silver ETF – the upside profit-take exit price: $36.87
Long-term capital (core part of the portfolio; our opinion): No positions (in other words: cash)
Insurance capital (core part of the portfolio; our opinion): Full position
Whether you’ve already subscribed or not, we encourage you to find out how to make the most of our alerts and read our replies to the most common alert-and-gold-trading-related-questions.
Please note that we describe the situation for the day that the alert is posted in the trading section. In other words, if we are writing about a speculative position, it means that it is up-to-date on the day it was posted. We are also featuring the initial target prices to decide whether keeping a position on a given day is in tune with your approach (some moves are too small for medium-term traders, and some might appear too big for day-traders).
Additionally, you might want to read why our stop-loss orders are usually relatively far from the current price.
Please note that a full position doesn't mean using all of the capital for a given trade. You will find details on our thoughts on gold portfolio structuring in the Key Insights section on our website.
As a reminder - "initial target price" means exactly that - an "initial" one. It's not a price level at which we suggest closing positions. If this becomes the case (as it did in the previous trade), we will refer to these levels as levels of exit orders (exactly as we've done previously). Stop-loss levels, however, are naturally not "initial", but something that, in our opinion, might be entered as an order.
Since it is impossible to synchronize target prices and stop-loss levels for all the ETFs and ETNs with the main markets that we provide these levels for (gold, silver and mining stocks - the GDX ETF), the stop-loss levels and target prices for other ETNs and ETF (among other: UGL, GLL, AGQ, ZSL, NUGT, DUST, JNUG, JDST) are provided as supplementary, and not as "final". This means that if a stop-loss or a target level is reached for any of the "additional instruments" (GLL for instance), but not for the "main instrument" (gold in this case), we will view positions in both gold and GLL as still open and the stop-loss for GLL would have to be moved lower. On the other hand, if gold moves to a stop-loss level but GLL doesn't, then we will view both positions (in gold and GLL) as closed. In other words, since it's not possible to be 100% certain that each related instrument moves to a given level when the underlying instrument does, we can't provide levels that would be binding. The levels that we do provide are our best estimate of the levels that will correspond to the levels in the underlying assets, but it will be the underlying assets that one will need to focus on regarding the signs pointing to closing a given position or keeping it open. We might adjust the levels in the "additional instruments" without adjusting the levels in the "main instruments", which will simply mean that we have improved our estimation of these levels, not that we changed our outlook on the markets. We are already working on a tool that would update these levels daily for the most popular ETFs, ETNs and individual mining stocks.
Our preferred ways to invest in and to trade gold along with the reasoning can be found in the how to buy gold section. Furthermore, our preferred ETFs and ETNs can be found in our Gold & Silver ETF Ranking.
As a reminder, Gold & Silver Trading Alerts are posted before or on each trading day (we usually post them before the opening bell, but we don't promise doing that each day). If there's anything urgent, we will send you an additional small alert before posting the main one.
Thank you.
Przemyslaw K. Radomski, CFA
Founder, Editor-in-chief


