Briefly: in our opinion, full (300% of the regular position size) speculative short positions in junior mining stocks are justified from the risk/reward point of view at the moment of publishing this Alert.
Some might consider an additional (short) position in the FCX.
What a slide! The GDXJ ETF moved over 5% lower yesterday, and it closed at a fresh 2023 low. Is the bottom in or is the slide likely to continue?
Let’s take a closer look at the charts to find out.
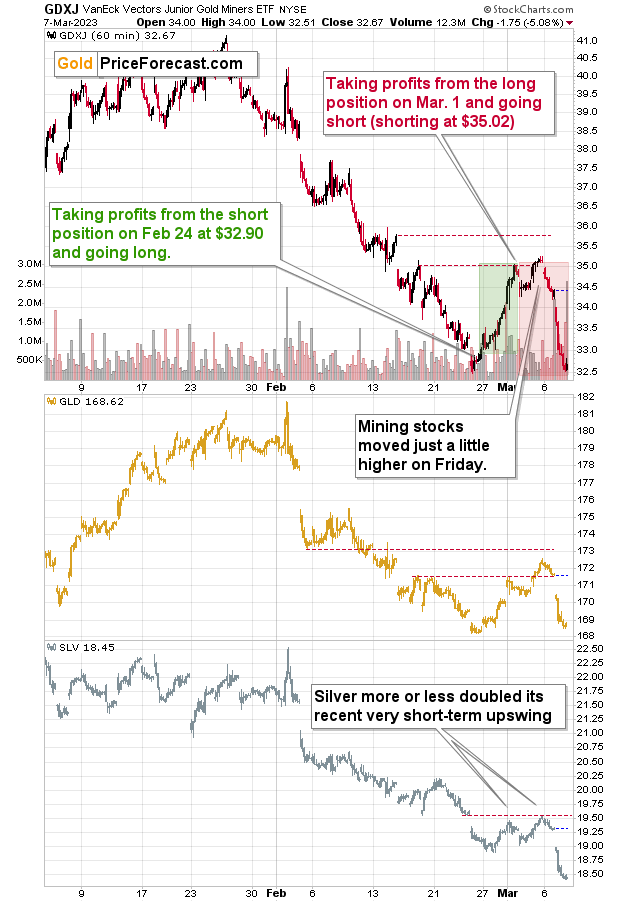
The clue to answering the above question lies in the final part of the rally that we saw last week.
That’s when miners clearly underperformed gold and when silver outperformed. Junior miners (upper part of the chart) moved just slightly above their initial high, gold moved somewhat higher, and silver pretty much doubled the size of its initial rally.
That’s what tends to happen right before bigger declines – and the emphasis really does go on “bigger”.
What has happened so far? Well, not that much. Even though yesterday’s rally was huge on a stand-alone basis, it only took miners back to their previous lows in intraday terms (we did see a move to new yearly lows in terms of the closing prices, though), and gold is not at its new lows yet.
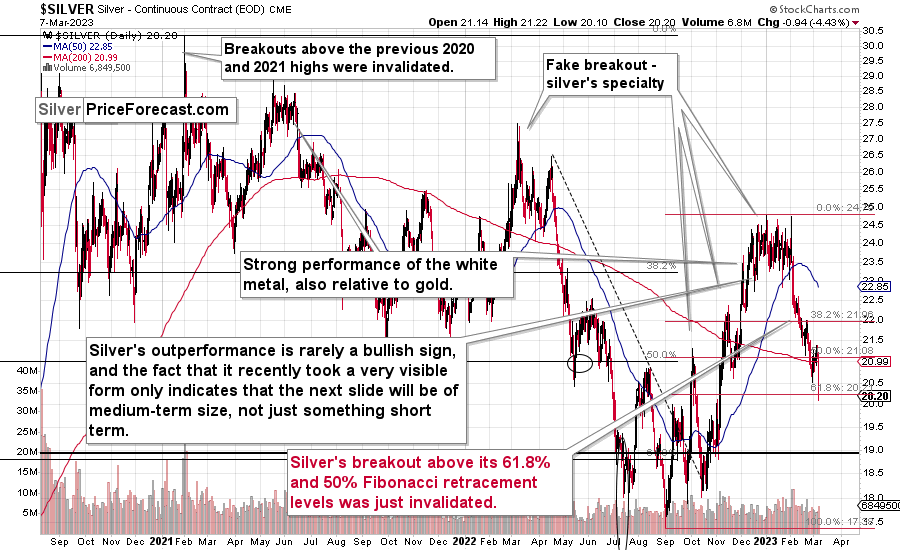
Silver plunged – quite decisively so.
Interestingly, the latter happened only a bit over a month after the moment when silver tried to move above the $25 level. On a side note, we saw the same indication in the first days of February – miners were underperforming gold, and based, i.a., on it, I warned that a decline was coming.
Now, the white metal has declined below its 61.8% Fibonacci retracement level, which is a great indication that this decline is not just a correction but actually a new, big move lower.
Let’s keep in mind that miners and silver are linked not only to gold and the USD Index but also to the stock market.
Mining stocks, because they are, well, stocks.
Silver due to its multiple industrial uses.
And what are stocks likely to do next?
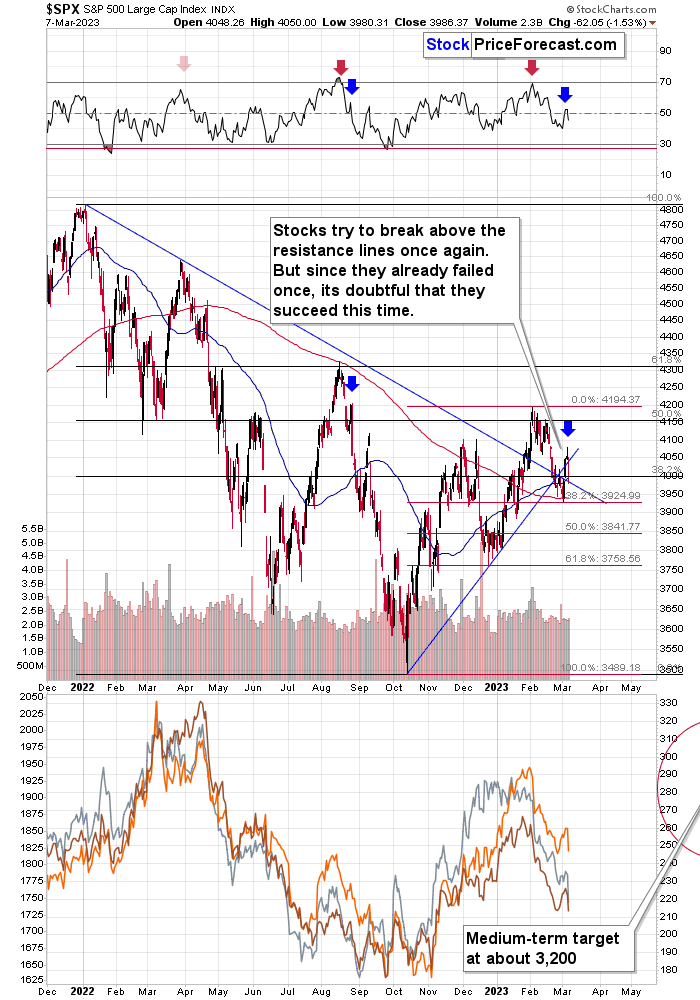
Stocks formed a clear reversal on Monday, so they were likely to decline on Tuesday. And that’s exactly what happened.
However, given the analogy to the previous decline that started in August 2022, it seems that the rally has only begun.
The recent bump in the RSI indicator and a top in it that I marked with a blue arrow suggest that the current situation is similar to what we saw in the early part of the slide.
So, silver and miners have been so weak that they managed to decline even without the stock markets’ help. What’s likely to happen when they finally do get this bearish “help”?
That’s right, you guessed it – miners and silver are likely to decline in a truly profound manner. Just as I warned you at the beginning of February, I’m warning you right now – in my opinion, another big move lower is already underway. And the profits of those who are positioned to gain from the upcoming decline (like my subscribers, for example) are likely to increase much more than they increased based on yesterday’s slide.
===
Extra Opportunity
So, yeah… The profits are coming in nicely, and it’s a great feeling to ride this downswing, knowing that we entered the short positions mere $0.10 below the top in terms of the closing prices.
But do you know what would be even better?
More profits.
Yes, that’s what I’ve been researching lately, weighing pros and cons, and I finally came to the conclusion that this is likely the way to go. That the opportunity that I’ve been researching is worth taking advantage of from a risk-to-reward point of view. Especially now that the Fed just admitted what you (if you’ve been reading my analyses) have known for many weeks (actually, months). The rates will have to move higher.
The precious metals sector is definitely likely to decline based on the increases in real interest rates, but… Gold, silver, and mining stocks are not the only asset out there that’s likely to be hit hard by this increase.
The economic slowdown that’s likely to happen on a global scale (after all, rates are being increased globally) is likely to take commodities lower, too. For example, copper.
I’ve been covering copper’s chart in my flagship weekly analyses for a while now, so you know that I’m expecting copper to move substantially lower in the future.
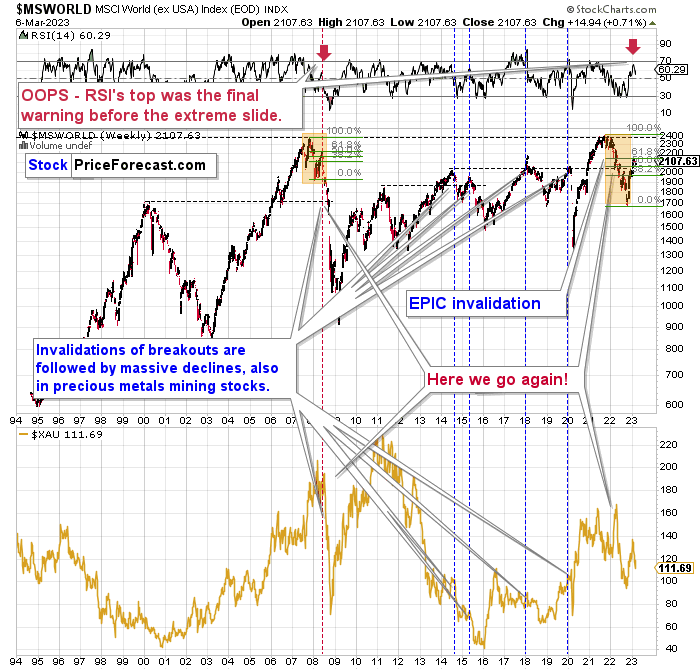
Also, do you remember the world stock chart (also visible in the above-linked analysis, close to its end) that showed how the current situation is similar to 2008?
There is a company that’s likely to decline in value due to all the above-mentioned declines: in gold, in copper, and in stocks.
Freeport-McMoRan Inc., trading under the FCX symbol, is a producer of copper, gold, and molybdenum.
The above wouldn’t have been all that interesting if it wasn’t for the charts that have breathtaking sell flags all over them.
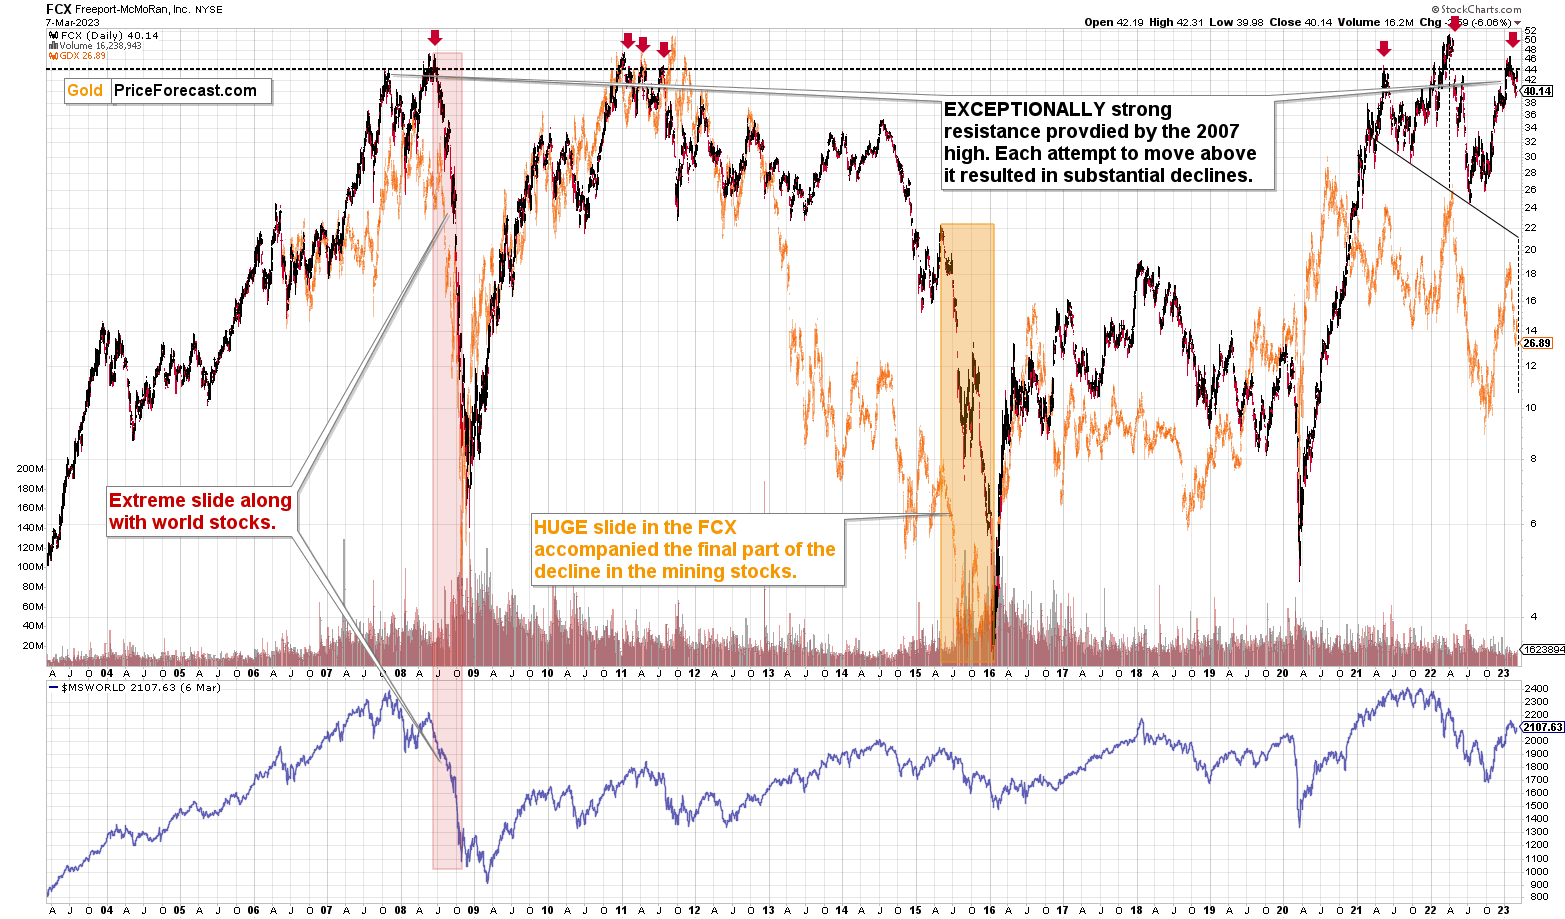
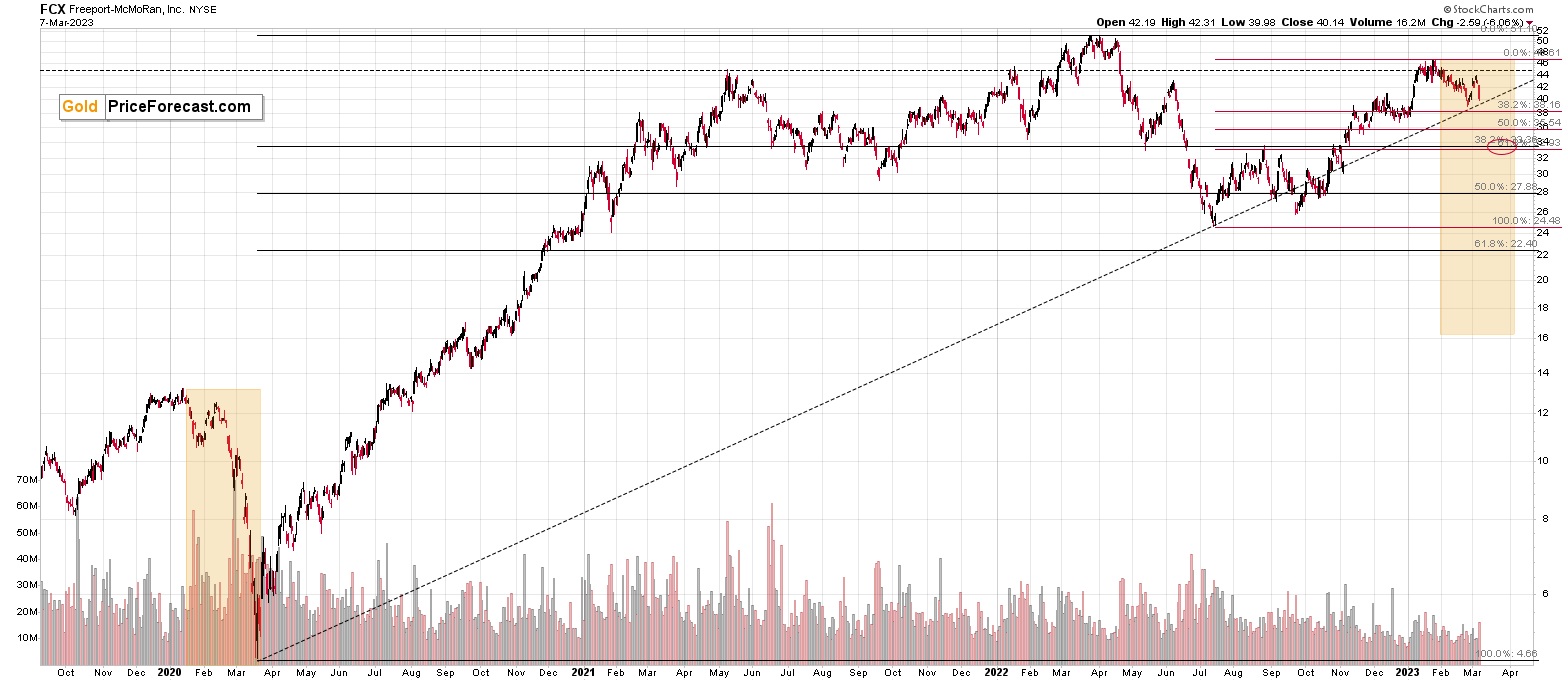
Let’s start with FCX’s long-term chart.
It just once again approached the level that stopped its prices in all previous cases. Whenever the price moved to or above the $44 level, it then declined, and it usually declines profoundly.
This key resistance was created by the 2007 high, and there were seven attempts to move above it and then hold those levels. Each attempt failed – including the most recent one.
Now, here’s where it gets really interesting.
Based on the world stock chart below – and in particular – based on the action in the RSI indicator, we’re likely to see a massive slide in their values.
Again, I wrote about it in greater detail on Thursday, but in short, stocks failed to rally to new highs (above their 2008 highs), declined even more than they did back then, and then they corrected by approximately as much as they did back then (to their 61.8% Fibonacci retracement).
The action in the RSI is also analogous and, based on it, we are right after the final top before the huge slide.
Of course, I can’t guarantee that this is the case, but… that’s exactly what I think is likely.
Now, the reason that I’m bringing this up, is that I’d like you to take a look at the previous chart once again, and focus on the carnage that happened in the FCX in 2008.
Yup. You see it right. From above $45 to below $6.
There’s also one other very interesting decline in FCX – the one that we saw in 2015. It was the second-biggest decline – ever. When did it happen? Well, that’s when the precious metals sector was ending its medium-term decline.
This is exactly what I’ve been writing about with regard to the precious metals market for months! I expect this upcoming (huge) slide to be the final move lower before the precious metals sector picks up again and starts a big rally.
If this is indeed going to be the case, then the FCX seems to have another good reason to truly slide in the following weeks/months.
But wait, there’s more!
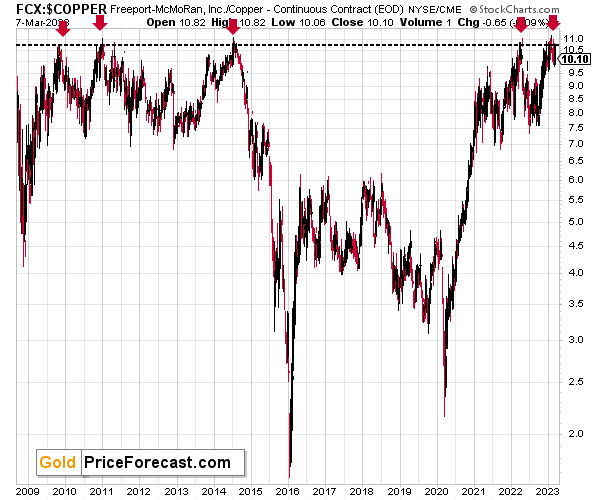
The above chart features the price of FCX divided by the price of copper. So, it’s essentially a ratio that compares the price of the share with the key underlying asset that it’s producing/selling. This helps to determine if the stock is overvalued or undervalued.
The ratio just failed to break above its long-term resistance level that had been in place for over a decade now.
This is a clear sell sign.
So if copper is about to decline significantly, and the FCX-to-copper ratio is likely to decline as well, then the FCX is likely to truly slide.
And that’s not even it!
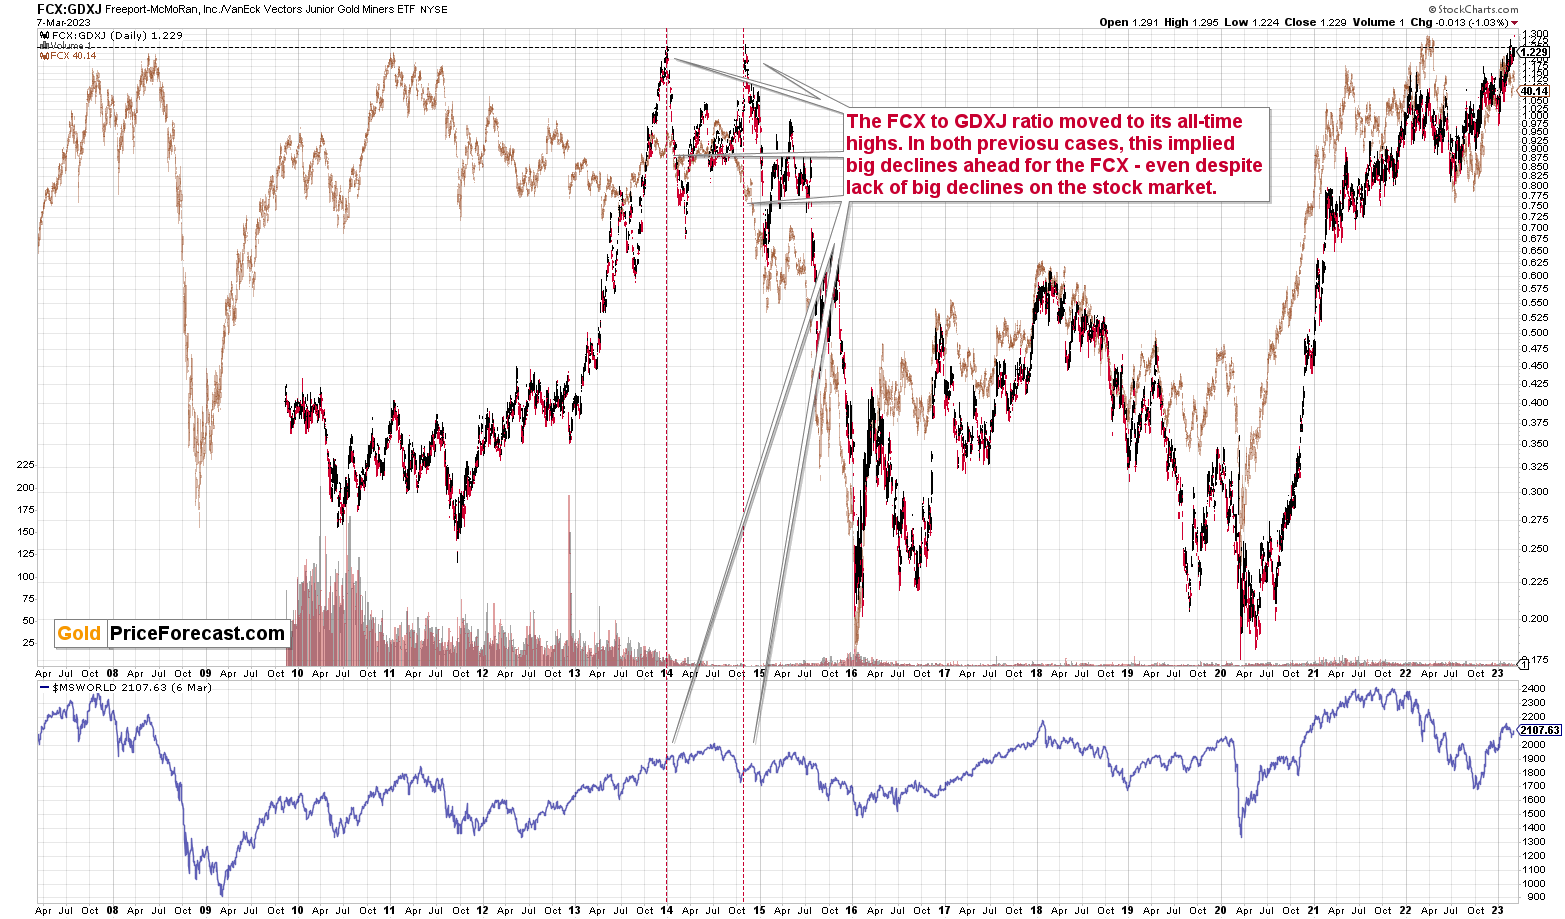
Here’s a ratio that might be most interesting from our point of view, since we’re profiting from the decline in the GDXJ. The chart below compares the price of the FCX with the price of the GDXJ.
There were only two cases when the FCX:GDXJ ratio was as high as it is right now, and in both cases, the FCX declined in the aftermath.
The moment when FCX didn’t decline immediately thereafter was in late 2014, when the stock market continued to move higher for a while – which is now unlikely to be the case.
So, as you see above, the situation in the FCX likely presents us with an extraordinary shorting opportunity, even though it’s debatable if it’s a gold stock or a copper stock (molybdenum stock?).
What are the ways in which one could approach this situation?
One could, for example, simply short FCX with some capital.
Or one could buy put options on FCX with some (in this case, much smaller) capital. Or one could sell call options.
Or one could not do anything with regard to it, because while the FCX provides a great opportunity in my view, the biggest risk to reward is provided by the short position junior miners, because that’s the market I specialize in (in precious metals in general) and where I think I’m most likely to detect local bottoms and tops (just like I did last week).
I will not officially add this to our trading position (it is going to be featured in the same section, though), because it’s rather outside of the scope of the service provided by my Gold Trading Alerts, and I’m writing all this as a courtesy (and truth be told, even though I plan to take a position myself, and I’m under no obligation to wait for it, I am waiting to enter my position, and I will only proceed after this analysis is posted and at least several minutes pass, so that you have the ability to act on it first – this is what feels right).
So, how am I going to feature a trade in the FCX? I’m going to provide a target level for it, where it seems that we might see a short-term rebound – slightly below $34, which is based on two Fibonacci retracements, one long-term and one medium-term.
The target is a bit below $34, so my profit take is slightly above $34 (to increase the chances of realizing the trade).
That’s just a short-term target, though. It seems quite likely that FCX will move below $20, perhaps even below $10, before the entire decline is completely over. But we’ll cross the next bridges when we get to them.
When do I expect this downside target (~$34) to be reached? Late March or early April.
What options – specifically what strike prices and expiration dates do I suggest? I’m intentionally not going to provide those details. Options are for advanced traders/investors, and those should have no trouble picking the combination of strike prices and expiration dates based on the above analysis and information.
If it’s perplexing and/or you don’t know how to proceed, it’s likely a good indication that you shouldn’t be using options for this trade at all. In this case, you might consider simply shorting the FCX stock or passing on this additional (and optional) trade, while focusing on the position in junior mining stocks.
How would I combine the size of the position in the FCX and the one in junior miners? As above, I would consider this just an addition, and I’d use approximately one third of the capital used for juniors. However, I would like to stress that this is highly you-specific and what kind of risk tolerance, strategy, liquidity requirements, etc. you have.
Overview of the Upcoming Part of the Decline
- It seems to me that the corrective upswing is over or about to be over.
- If we see a situation where miners slide in a meaningful and volatile way while silver doesn’t (it just declines moderately), I plan to – once again – switch from short positions in miners to short positions in silver. At this time, it’s too early to say at what price levels this could take place and if we get this kind of opportunity at all – perhaps with gold prices close to $1,500 - $1,550.
- I plan to switch from the short positions in junior mining stocks or silver (whichever I’ll have at that moment) to long positions in junior mining stocks when gold / mining stocks move to their 2020 lows (approximately). While I’m probably not going to write about it at this stage yet, this is when some investors might consider getting back in with their long-term investing capital (or perhaps 1/3 or 1/2 thereof).
- I plan to return to short positions in junior mining stocks after a rebound – and the rebound could take gold from about $1,450 to about $1,550, and it could take the GDXJ from about $20 to about $24. In other words, I’m currently planning to go long when GDXJ is close to $20 (which might take place when gold is close to $1,450), and I’m planning to exit this long position and re-enter the short position once we see a corrective rally to $24 in the GDXJ (which might take place when gold is close to $1,550).
- I plan to exit all remaining short positions once gold shows substantial strength relative to the USD Index while the latter is still rallying. This may be the case with gold prices close to $1,400 and GDXJ close to $15 . This moment (when gold performs very strongly against the rallying USD and miners are strong relative to gold after its substantial decline) is likely to be the best entry point for long-term investments, in my view. This can also happen with gold close to $1,400, but at the moment it’s too early to say with certainty.
- The above is based on the information available today, and it might change in the following days/weeks.
You will find my general overview of the outlook for gold on the chart below:
Please note that the above timing details are relatively broad and “for general overview only” – so that you know more or less what I think and how volatile I think the moves are likely to be – on an approximate basis. These time targets are not binding nor clear enough for me to think that they should be used for purchasing options, warrants, or similar instruments.
Letters to the Editor
Please post your questions in the comments feed below the articles, if they are about issues raised within the article (or in the recent issues), and if they are about other, more universal matters, I encourage you to use the Ask the Community space (I’m also part of the community, after all), so that more people can contribute to the reply and then enjoy the answer. Of course, let’s keep the target-related discussions in the Gold Trading Alerts space.
Summary
To summarize, in my view, the real interest rates are up and about to soar higher, the USD Index is likely to soar, and the precious metals are already sliding.
The corrective upswing was rather quick and quite lucrative, given that the capital was used for it for just a few trading days. Let’s not forget that we were able to re-enter the short positions at higher levels, so the benefits are actually even bigger than they seem at first sight. It turned out that we started shorting the market just $0.10 from the top in terms of the closing prices. Congratulations once again!
===
Today’s analysis also features an additional – by all means “optional” – trade idea outside of the regular scope of the service, which I’m sharing with you as a bonus – simply because it feels right. The FCX shares are likely to tumble, in my opinion, and taking advantage of this decline is something that you might (or might not) want to consider.
===
As a reminder, we still have a “promotion” that allows you to extend your subscription for up to three (!) years at the current prices… With a 20% discount! And it would apply to all those years, so the savings could be substantial. Given inflation this high, it’s practically certain that we will be raising our prices, and the above would not only protect you from it (at least on our end), but it would also be a perfect way to re-invest some of the profits that you just made.
The savings can be even bigger if you apply it to our All-inclusive Package (Stock- and Oil- Trading Alerts are also included). Actually, in this case, a 25% discount (even up to three years!) applies, so the savings are huge!
If you’d like to upgrade your plan (e.g., to the All-inclusive Package) and take advantage of the discount, please use this link to continue.
If you’d like to extend your subscription (and perhaps also upgrade your plan while doing so), please contact us – our support staff will be happy to help and make sure that your subscription is set up perfectly.
If anything about the above is unclear, but you’d like to proceed – please contact us anyway :).
As always, we'll keep you – our subscribers – informed.
To summarize:
Trading capital (supplementary part of the portfolio; our opinion): Full speculative short positions (300% of the full position) in junior mining stocks are justified from the risk to reward point of view with the following binding exit profit-take price levels:
Mining stocks (price levels for the GDXJ ETF): binding profit-take exit price: $26.13; stop-loss: none (the volatility is too big to justify a stop-loss order in case of this particular trade)
Alternatively, if one seeks leverage, we’re providing the binding profit-take levels for the JDST (2x leveraged). The binding profit-take level for the JDST: $13.87; stop-loss for the JDST: none (the volatility is too big to justify a SL order in case of this particular trade).
For-your-information targets (our opinion; we continue to think that mining stocks are the preferred way of taking advantage of the upcoming price move, but if for whatever reason one wants / has to use silver or gold for this trade, we are providing the details anyway.):
Silver futures downside profit-take exit price: $17.83
SLV profit-take exit price: $16.73
ZSL profit-take exit price: $32.97
Gold futures downside profit-take exit price: $1,743
HGD.TO – alternative (Canadian) 2x inverse leveraged gold stocks ETF – the upside profit-take exit price: $10.97
HZD.TO – alternative (Canadian) 2x inverse leveraged silver ETF – the upside profit-take exit price: $25.47
///
Optional / additional trade idea that I think is justified from the risk to reward point of view:
Short position in the FCX with $34.13 as the short-term profit-take level.
Long-term capital (core part of the portfolio; our opinion): No positions (in other words: cash)
Insurance capital (core part of the portfolio; our opinion): Full position
Whether you’ve already subscribed or not, we encourage you to find out how to make the most of our alerts and read our replies to the most common alert-and-gold-trading-related-questions.
Please note that we describe the situation for the day that the alert is posted in the trading section. In other words, if we are writing about a speculative position, it means that it is up-to-date on the day it was posted. We are also featuring the initial target prices to decide whether keeping a position on a given day is in tune with your approach (some moves are too small for medium-term traders, and some might appear too big for day-traders).
Additionally, you might want to read why our stop-loss orders are usually relatively far from the current price.
Please note that a full position doesn't mean using all of the capital for a given trade. You will find details on our thoughts on gold portfolio structuring in the Key Insights section on our website.
As a reminder - "initial target price" means exactly that - an "initial" one. It's not a price level at which we suggest closing positions. If this becomes the case (as it did in the previous trade), we will refer to these levels as levels of exit orders (exactly as we've done previously). Stop-loss levels, however, are naturally not "initial", but something that, in our opinion, might be entered as an order.
Since it is impossible to synchronize target prices and stop-loss levels for all the ETFs and ETNs with the main markets that we provide these levels for (gold, silver and mining stocks - the GDX ETF), the stop-loss levels and target prices for other ETNs and ETF (among other: UGL, GLL, AGQ, ZSL, NUGT, DUST, JNUG, JDST) are provided as supplementary, and not as "final". This means that if a stop-loss or a target level is reached for any of the "additional instruments" (GLL for instance), but not for the "main instrument" (gold in this case), we will view positions in both gold and GLL as still open and the stop-loss for GLL would have to be moved lower. On the other hand, if gold moves to a stop-loss level but GLL doesn't, then we will view both positions (in gold and GLL) as closed. In other words, since it's not possible to be 100% certain that each related instrument moves to a given level when the underlying instrument does, we can't provide levels that would be binding. The levels that we do provide are our best estimate of the levels that will correspond to the levels in the underlying assets, but it will be the underlying assets that one will need to focus on regarding the signs pointing to closing a given position or keeping it open. We might adjust the levels in the "additional instruments" without adjusting the levels in the "main instruments", which will simply mean that we have improved our estimation of these levels, not that we changed our outlook on the markets. We are already working on a tool that would update these levels daily for the most popular ETFs, ETNs and individual mining stocks.
Our preferred ways to invest in and to trade gold along with the reasoning can be found in the how to buy gold section. Furthermore, our preferred ETFs and ETNs can be found in our Gold & Silver ETF Ranking.
As a reminder, Gold & Silver Trading Alerts are posted before or on each trading day (we usually post them before the opening bell, but we don't promise doing that each day). If there's anything urgent, we will send you an additional small alert before posting the main one.
Thank you.
Przemyslaw K. Radomski, CFA
Founder, Editor-in-chief


