Briefly: in our opinion, full (300% of the regular position size) speculative short positions in junior mining stocks are justified from the risk/reward point of view at the moment of publishing this Alert.
Today’s short-term analysis will once again be in video format. However, to make a long story short, the precious metals sector declined yesterday, and what we wrote previously remains up-to-date.
https://www.youtube.com/watch?v=jClXiIk07UY&ab_channel=GoldPriceForecast
Besides, on a technical note, from now on, video analyses will be published on our other channel, GoldPriceForecast, and we strongly encourage you to subscribe there as well. You can hear more about the transition in the video below:
Having said that, let’s take a look at the markets from a more fundamental angle.
Is ‘Gold Up, Dollar Down’ the New Normal?
With the Bank of Canada (BoC) expected to raise its overnight lending rate by 25 basis points today, the global liquidity drain remains highly bearish; and with the ramifications of the unprecedented withdrawal poised to end with mild-to-major recessions, the U.S. dollar’s best days should lie ahead.
Conversely, with Eurozone economic data outperforming the U.S. recently, the crowd assumes that a new EUR/USD bull market has begun.
However, with their optimism shortsighted, they don’t realize that the ECB is in a much more precarious position than the Fed. For example, the ECB must conduct monetary policy for 19 countries, while the Fed only has to worry about one. Therefore, the latter has fewer chess pieces to maneuver, and it’s much easier to monitor the real-time effects of a higher U.S. federal funds rate (FFR).
Second, the ominous fiscal conundrum confronting Italy – the Eurozone’s third-largest economy – means the ECB will need to manage the situation more carefully than the Fed. As such, the FOMC has more ammunition to remain hawkish for longer. To explain, we wrote on Dec. 30:
The EUR/USD accounts for nearly 58% of the USD Index’s movement; and with the currency pair bouncing off a ~20-year low, the momentum has upended the dollar basket. Yet, investors have applied relative interest rate analysis to support their bullish euro positioning.
In a nutshell: with the ECB late to the party, Eurozone rate hike expectations have increased at a faster pace than U.S. rate hike expectations (which remain near 5%) in recent weeks, and the development has helped boost the euro. But, with the economic ramifications of higher interest rates poised to weigh on the Eurozone economy, a hawkish ECB is counterintuitively bearish for the EUR/USD.
Please see below:
 To that point, the fundamental weakness confronting the USD Index stems from renewed hopes for a soft landing. With China’s reopening increasing growth optimism and Europe avoiding the worst of its energy crisis, the crowd assumes that prominent risks have been eliminated. In contrast, the recent calm for risk assets is likely a lull in what should be a tumultuous 2023.
Please see below:
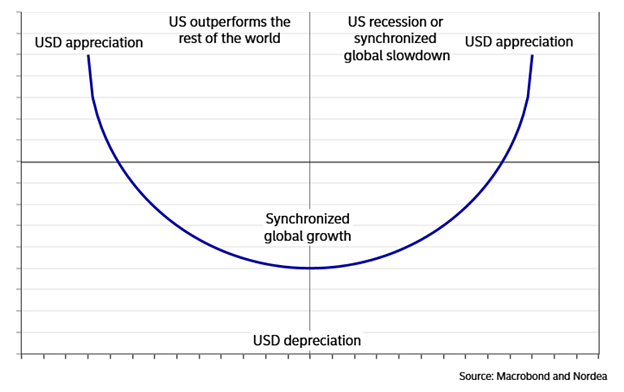 To explain, the ‘dollar smile’ visualizes how the greenback rallies during periods of U.S. outperformance and global panic. Although, the new narrative of “synchronized global growth” has risk-on currencies rising as fear dissipates from the financial markets. As a result, while the USD Index is stuck in the bottom part of the smile right now, we expect a profound reversal over the medium term.
As further evidence, fund flows into emerging market (EM) debt and equities have soared recently, which highlights the consensus belief in “synchronized global growth.”
Please see below:
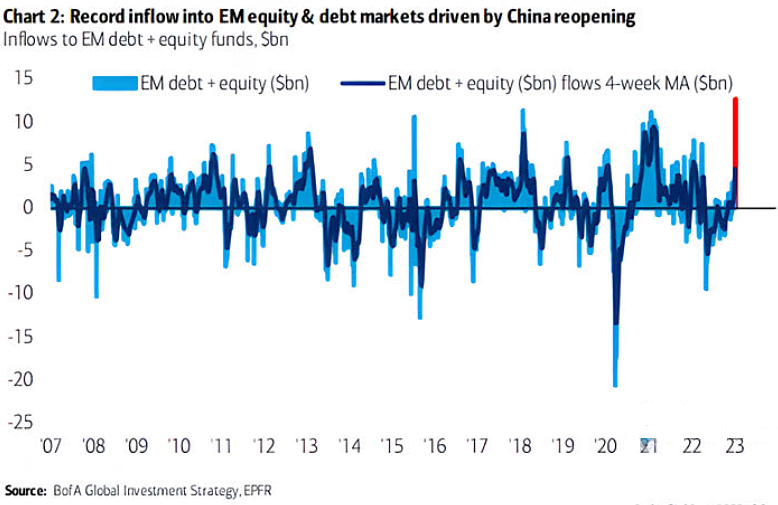 To explain, the red bar on the right side of the chart depicts how China’s reopening has created a record bid for EM assets. Yet, EM securities are highly risky, susceptible to U.S. dollar strength, and much more exposed to the global business cycle than developed countries. Consequently, the misguided belief that the inflation crisis is over has led to substantial re-pricings across several markets.
Conversely, with real recession fears poised to amplify in the months ahead, a sharp reversal of these flows should support the USD Index and upend gold, silver and mining stocks.
Please see below:
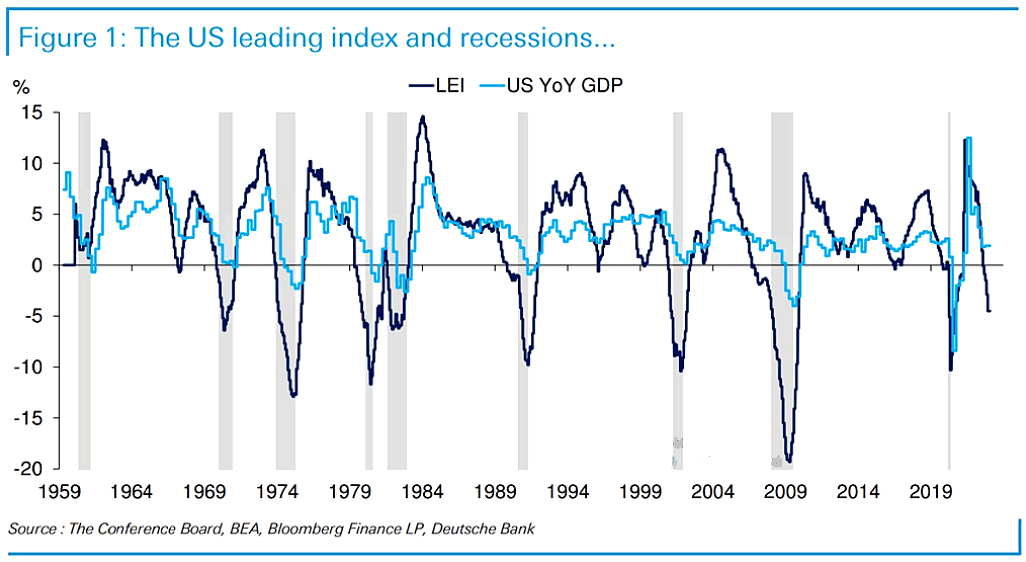 To explain, the dark blue line above tracks the change in The Conference Board’s Leading Economic Index (LEI), while the light blue line above tracks the year-over-year (YoY) percentage change in U.S. GDP. If you analyze the vertical gray bars, you can see that every time the LEI turned negative since 1969, the U.S. experienced a recession.
Likewise, if you focus your attention on the right side of the chart, you can see that the dark blue line has reached that negative milestone. Ataman Ozyildirim, Senior Director of Economics at The Conference Board, said on Jan. 23:
“There was widespread weakness among leading indicators in December, indicating deteriorating conditions for labor markets, manufacturing, housing construction, and financial markets in the months ahead. Meanwhile, the coincident economic index (CEI) has not weakened in the same fashion as the LEI because labor market related indicators (employment and personal income) remain robust.”
And therein lies the conundrum. We have been bullish on the U.S. economy and the FFR and have maintained that demand is resilient, despite the crowd’s recession calls in July and October. Furthermore, Ozyildirim noted how the CEI contrasts the LEI right now because U.S. labor markets “remain robust.”
Therefore, our thesis has been consistent that as long as Americans have jobs and record checkable deposits, a real recession (GFC-like) is unlikely to materialize in the short term. However, that doesn’t mean it won’t happen in the months ahead.
Remember, nine of the last 10 inflation fights since 1948 have ended with recessions, and the results support the conclusions from the LEI; and we expect this bear market to end with a sharp recession and major Cboe Volatility Index (VIX) spike that pushes the USD Index to new highs and risk assets like gold and the S&P 500 to new lows. It’s simply a matter of timing.
Please see below:
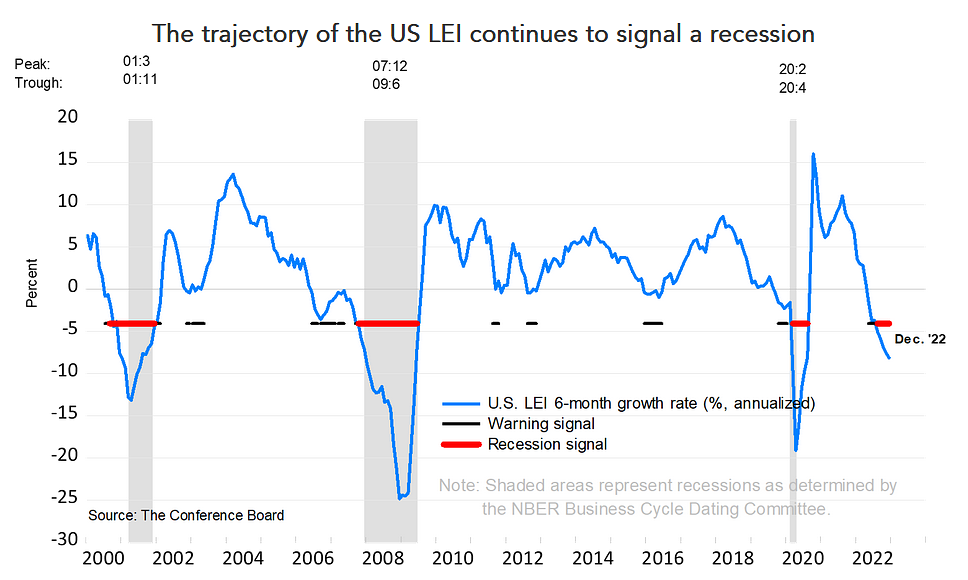 To explain, the horizontal red line on the right side of the chart shows how the LEI’s recession signal has already flashed; and with this and the chart above highlighting its historical accuracy, it’s simply a matter of when, not if, the next bout of panic arrives.
Finally, we warned numerous times that the PMs’ price action has been driven by momentum and not fundamentals; and with positioning drastically out of whack with what’s likely to occur, when the reversal arrives, it should be epic.
For perspective, EUR/USD speculative net longs are near their ~10-year high, EM flows have surged, and a reversal of these two metrics alone could upend the financial markets. Yet, there is a positioning imbalance specific to the PMs that highlights why the bulls should be nervous.
Please see below:
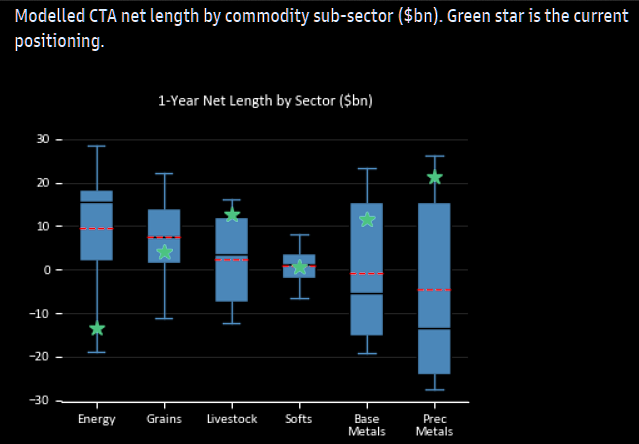 To explain, the candlesticks above track Goldman Sachs’ tally of Commodity Trading Advisors (CTAs) positioning across different assets. For context, most of these players use trend-following algorithms.
If you analyze the candlestick furthest to the right, you can see that CTAs are overwhelmingly net long the PMs (the green star). As a result, their affection has helped keep the PMs afloat over the last few months. But, this is purely a momentum bid, and when it reverses, CTAs’ net positioning can go from +20 to -20 in a heartbeat. So, while patience may be required, we view gold, silver and mining stocks as having little upside and substantial downside.
Overall, a lack of fundamental catalysts have kept risk assets calm; and with the crowd assuming the Fed is near the end of its rate hike cycle and global growth is poised to accelerate, they are eager to sell risk-off assets. However, we believe this optimism will prove unprofitable, and risk assets’ medium-term lows still await us.
Do you believe in mean reversion? If the CTAs are nearly all in, who is left to buy gold? Should we trust the soft landing narrative or follow the LEI?
Silver Still Shows Little Energy
With silver’s disdain for $24 on display again on Jan. 24, the white metal has been unable to break through its glass ceiling. Moreover, if silver can’t showcase strength when the VIX is low and optimism is high, what will happen if (when) the backdrop reverses?
For example, famed investor Jeremy Grantham released his latest research report on Jan. 24. He wrote:
“The first and easiest leg of the bursting of the bubble we called for a year ago is complete. The most speculative growth stocks that led the market on the way up have been crushed, and a large chunk of the total losses across markets that we expected to see a year ago have already occurred…..
“My calculations of trendline value of the S&P 500, adjusted upwards for trendline growth and for expected inflation, is about 3,200 by the end of 2023. I believe it is likely (3 to 1) to reach that trend and spend at least some time below it this year or next.”
To that point, while he admits that timing is difficult due to a confluence of factors, he repeated our warning that rate cuts often occur when liquidations are already underway. Therefore, while the perception of a dovish 180 is bullish, real pivots are highly bearish. Grantham wrote:
“You should focus only on the four great U.S. bubbles. The fundamentals had so much negative momentum that for three of them (1929, 2000, 2007) the largest part of the market decline occurred after the first rate cut.
“In 1974 the market did turn up, after a horrific 62% real decline in two years, exactly as the first rate cut took place. (That rate cut was delayed by the surge in inflation caused by the infamous oil shock.)”
Thus, while he noted that a lower FFR marked the short-term bottom in 1974, it took a 62% real (inflation-adjusted) decline in the S&P 500 before the carnage was priced in. Conversely, the other major bear markets still experienced subsequent S&P 500 drawdowns of 41% to 79%.
Please see below:
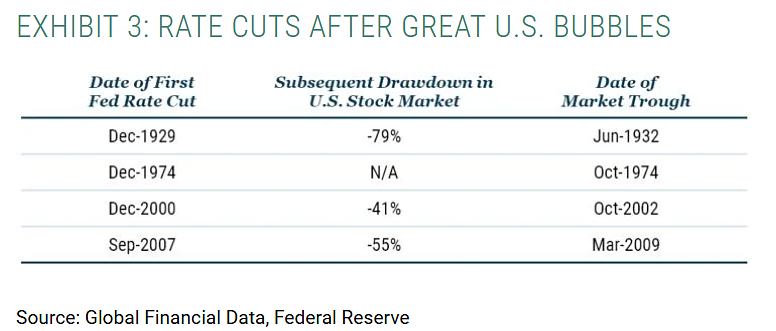 So, while the crowd maintains that a new bull market has begun, valuation has Grantham’s firm GMO predicting negative U.S. equity returns over the next seven years, versus their long-term historical annual average of 6.5%.
Please see below:
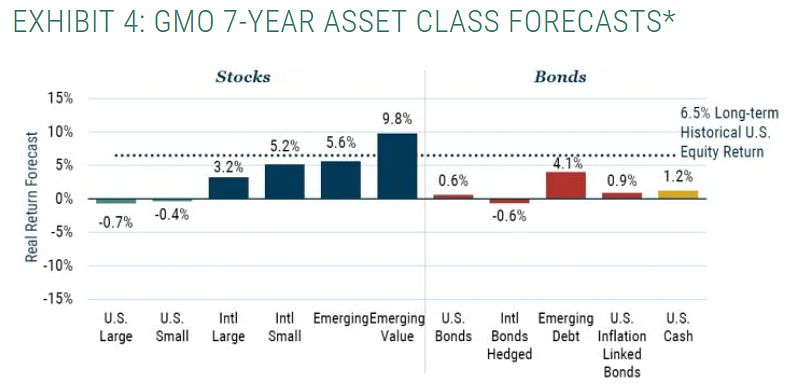 To explain, the two bars furthest to the left show how GMO expects U.S. large and small caps to return -0.7% and -0.4% annually over the next seven years. Furthermore, since average returns don’t occur in small drips, periods of abnormally high and abnormally low performance often dominate; and with the U.S. market still overvalued, another sharp S&P 500 drawdown could crush silver, just like it did when the pair hit their 2022 lows in September and October.
As a result, while the physical silver market may outperform, the panic that often occurs alongside major S&P 500 drawdowns makes the silver futures price highly vulnerable. Therefore, we see many risks that are likely to occur but are far from priced in.
Overall, while the silver price awaits the next fundamental catalyst, we believe there is much more downside than upside. With CTAs highly net long the PMs, inflation showing renewed strength, and even commodity bulls like Goldman Sachs expecting a pullback to $21 over the next three months, the medium-term outlook remains profoundly bearish.
How should we interpret Grantham’s prediction? Do you think there is a 75% chance the S&P 500 will hit 3,200? How would the Fed react?
The Bottom Line
The mood music on Wall Street remains sanguine, as the ‘show me’ market wants tangible evidence before turning bearish. However, with imbalances present across many markets, complacency is high at a time when risks are elevated. Consequently, a significant wake-up call should occur sooner rather than later.
In conclusion, the PMs rallied on Jan. 24, as drama remains devoid in the financial markets. With many assets in consolidation mode, the bond and FX markets are waiting for the next fundamental trigger. But, inflation has quietly re-emerged, and the hawkish ramifications should shift sentiment over the medium term.
Overview of the Upcoming Part of the Decline
- It seems to me that the corrective upswing is over (or about to be over) and that the next big move lower is already underway (or that it’s about to start).
- If we see a situation where miners slide in a meaningful and volatile way while silver doesn’t (it just declines moderately), I plan to – once again – switch from short positions in miners to short positions in silver. At this time, it’s too early to say at what price levels this could take place and if we get this kind of opportunity at all – perhaps with gold prices close to $1,500 - $1,550.
- I plan to switch from the short positions in junior mining stocks or silver (whichever I’ll have at that moment) to long positions in junior mining stocks when gold / mining stocks move to their 2020 lows (approximately). While I’m probably not going to write about it at this stage yet, this is when some investors might consider getting back in with their long-term investing capital (or perhaps 1/3 or 1/2 thereof).
- I plan to return to short positions in junior mining stocks after a rebound – and the rebound could take gold from about $1,450 to about $1,550, and it could take the GDXJ from about $20 to about $24. In other words, I’m currently planning to go long when GDXJ is close to $20 (which might take place when gold is close to $1,450), and I’m planning to exit this long position and re-enter the short position once we see a corrective rally to $24 in the GDXJ (which might take place when gold is close to $1,550).
- I plan to exit all remaining short positions once gold shows substantial strength relative to the USD Index while the latter is still rallying. This may be the case with gold prices close to $1,400 and GDXJ close to $15 . This moment (when gold performs very strongly against the rallying USD and miners are strong relative to gold after its substantial decline) is likely to be the best entry point for long-term investments, in my view. This can also happen with gold close to $1,400, but at the moment it’s too early to say with certainty.
- The above is based on the information available today, and it might change in the following days/weeks.
You will find my general overview of the outlook for gold on the chart below:
Please note that the above timing details are relatively broad and “for general overview only” – so that you know more or less what I think and how volatile I think the moves are likely to be – on an approximate basis. These time targets are not binding nor clear enough for me to think that they should be used for purchasing options, warrants, or similar instruments.
Letters to the Editor
We received a few messages over e-mail, but as we are moving to our new Golden Meadow platform, we will be transferring them below the articles as comments – and that’s where we’ll be replying to them.
On the platform, please ask your questions below the articles or in the spaces called “Ask the Community” or “Position Sizes” directly – it will help us deliver a reply sooner. In some cases, someone from the community might reply and help even before we do.
Please remember about the Pillars of our Community, especially about the Kindness of Speech Pillar.
Also, if there’s anything that you’re unhappy with, it’s best to send us a message at [email protected].
Please note that this section is going to go away within the next 1-8 weeks, as you can add comments/questions below the article on Golden Meadow – the platform that we’re using to provide our analyses. Your notification e-mails include an invitation link that allows you to access the “Gold Trading Alerts” space.
Also, if you haven’t had the chance to see the video, in which I’m talking about the new platform and why we essentially moved from Sunshine Profits to Golden Meadow, I strongly encourage you to do so:
Summary
Summing up, it seems that the major bottom in the USD Index is in, while the correction in stocks, gold, silver, and mining stocks is over or very close to being over.
The nature of the recent corrections was mostly technical and rumor-based. The rumor was that the Fed would be making a dovish U-turn soon, and it recently became clear that this was not going to be the case. Consequently, the corrective upswing is likely to be reversed, and medium-term downtrends are likely to resume.
In my opinion, the current trading position is going to become profitable in the following weeks, and quite possibly in the following days. And while I can’t promise any kind of performance, I fully expect it to become very profitable before it’s over and to prolong our 2022 winning streak.
After the final sell-off (that takes gold to about $1,350-$1,500), I expect the precious metals to rally significantly. The final part of the decline might take as little as 1-5 weeks, so it's important to stay alert to any changes.
As always, we'll keep you – our subscribers – informed.
To summarize:
Trading capital (supplementary part of the portfolio; our opinion): Full speculative short positions (300% of the full position) in junior mining stocks are justified from the risk to reward point of view with the following binding exit profit-take price levels:
Mining stocks (price levels for the GDXJ ETF): binding profit-take exit price: $20.32; stop-loss: none (the volatility is too big to justify a stop-loss order in case of this particular trade)
Alternatively, if one seeks leverage, we’re providing the binding profit-take levels for the JDST (2x leveraged). The binding profit-take level for the JDST: $22.87; stop-loss for the JDST: none (the volatility is too big to justify a SL order in case of this particular trade).
For-your-information targets (our opinion; we continue to think that mining stocks are the preferred way of taking advantage of the upcoming price move, but if for whatever reason one wants / has to use silver or gold for this trade, we are providing the details anyway.):
Silver futures downside profit-take exit price: $14.32
SLV profit-take exit price: $13.42
ZSL profit-take exit price: $48.87
Gold futures downside profit-take exit price: $1,504
HGD.TO – alternative (Canadian) 2x inverse leveraged gold stocks ETF – the upside profit-take exit price: $16.47
HZD.TO – alternative (Canadian) 2x inverse leveraged silver ETF – the upside profit-take exit price: $36.87
Long-term capital (core part of the portfolio; our opinion): No positions (in other words: cash)
Insurance capital (core part of the portfolio; our opinion): Full position
Whether you’ve already subscribed or not, we encourage you to find out how to make the most of our alerts and read our replies to the most common alert-and-gold-trading-related-questions.
Please note that we describe the situation for the day that the alert is posted in the trading section. In other words, if we are writing about a speculative position, it means that it is up-to-date on the day it was posted. We are also featuring the initial target prices to decide whether keeping a position on a given day is in tune with your approach (some moves are too small for medium-term traders, and some might appear too big for day-traders).
Additionally, you might want to read why our stop-loss orders are usually relatively far from the current price.
Please note that a full position doesn't mean using all of the capital for a given trade. You will find details on our thoughts on gold portfolio structuring in the Key Insights section on our website.
As a reminder - "initial target price" means exactly that - an "initial" one. It's not a price level at which we suggest closing positions. If this becomes the case (as it did in the previous trade), we will refer to these levels as levels of exit orders (exactly as we've done previously). Stop-loss levels, however, are naturally not "initial", but something that, in our opinion, might be entered as an order.
Since it is impossible to synchronize target prices and stop-loss levels for all the ETFs and ETNs with the main markets that we provide these levels for (gold, silver and mining stocks - the GDX ETF), the stop-loss levels and target prices for other ETNs and ETF (among other: UGL, GLL, AGQ, ZSL, NUGT, DUST, JNUG, JDST) are provided as supplementary, and not as "final". This means that if a stop-loss or a target level is reached for any of the "additional instruments" (GLL for instance), but not for the "main instrument" (gold in this case), we will view positions in both gold and GLL as still open and the stop-loss for GLL would have to be moved lower. On the other hand, if gold moves to a stop-loss level but GLL doesn't, then we will view both positions (in gold and GLL) as closed. In other words, since it's not possible to be 100% certain that each related instrument moves to a given level when the underlying instrument does, we can't provide levels that would be binding. The levels that we do provide are our best estimate of the levels that will correspond to the levels in the underlying assets, but it will be the underlying assets that one will need to focus on regarding the signs pointing to closing a given position or keeping it open. We might adjust the levels in the "additional instruments" without adjusting the levels in the "main instruments", which will simply mean that we have improved our estimation of these levels, not that we changed our outlook on the markets. We are already working on a tool that would update these levels daily for the most popular ETFs, ETNs and individual mining stocks.
Our preferred ways to invest in and to trade gold along with the reasoning can be found in the how to buy gold section. Furthermore, our preferred ETFs and ETNs can be found in our Gold & Silver ETF Ranking.
As a reminder, Gold & Silver Trading Alerts are posted before or on each trading day (we usually post them before the opening bell, but we don't promise doing that each day). If there's anything urgent, we will send you an additional small alert before posting the main one.
Thank you.
Przemyslaw K. Radomski, CFA
Founder, Editor-in-chief


