Briefly: in our opinion, full (250% of the regular size of the position) speculative short position in gold, silver, and mining stocks is justified from the risk/reward perspective at the moment of publishing this Alert.
After all, gold closed last week on a bullish note. Some would be tempted to ascribe a deeper meaning to this reversal. That is, if they hadn’t examined the context in an exhaustive way. How does yesterday’s price move change the short-term picture? In today’s analysis, you’ll find the dynamics explained. Scenarios are explored and the most likely ones pointed out. Get ready.
Gold’s Questionable Reversal
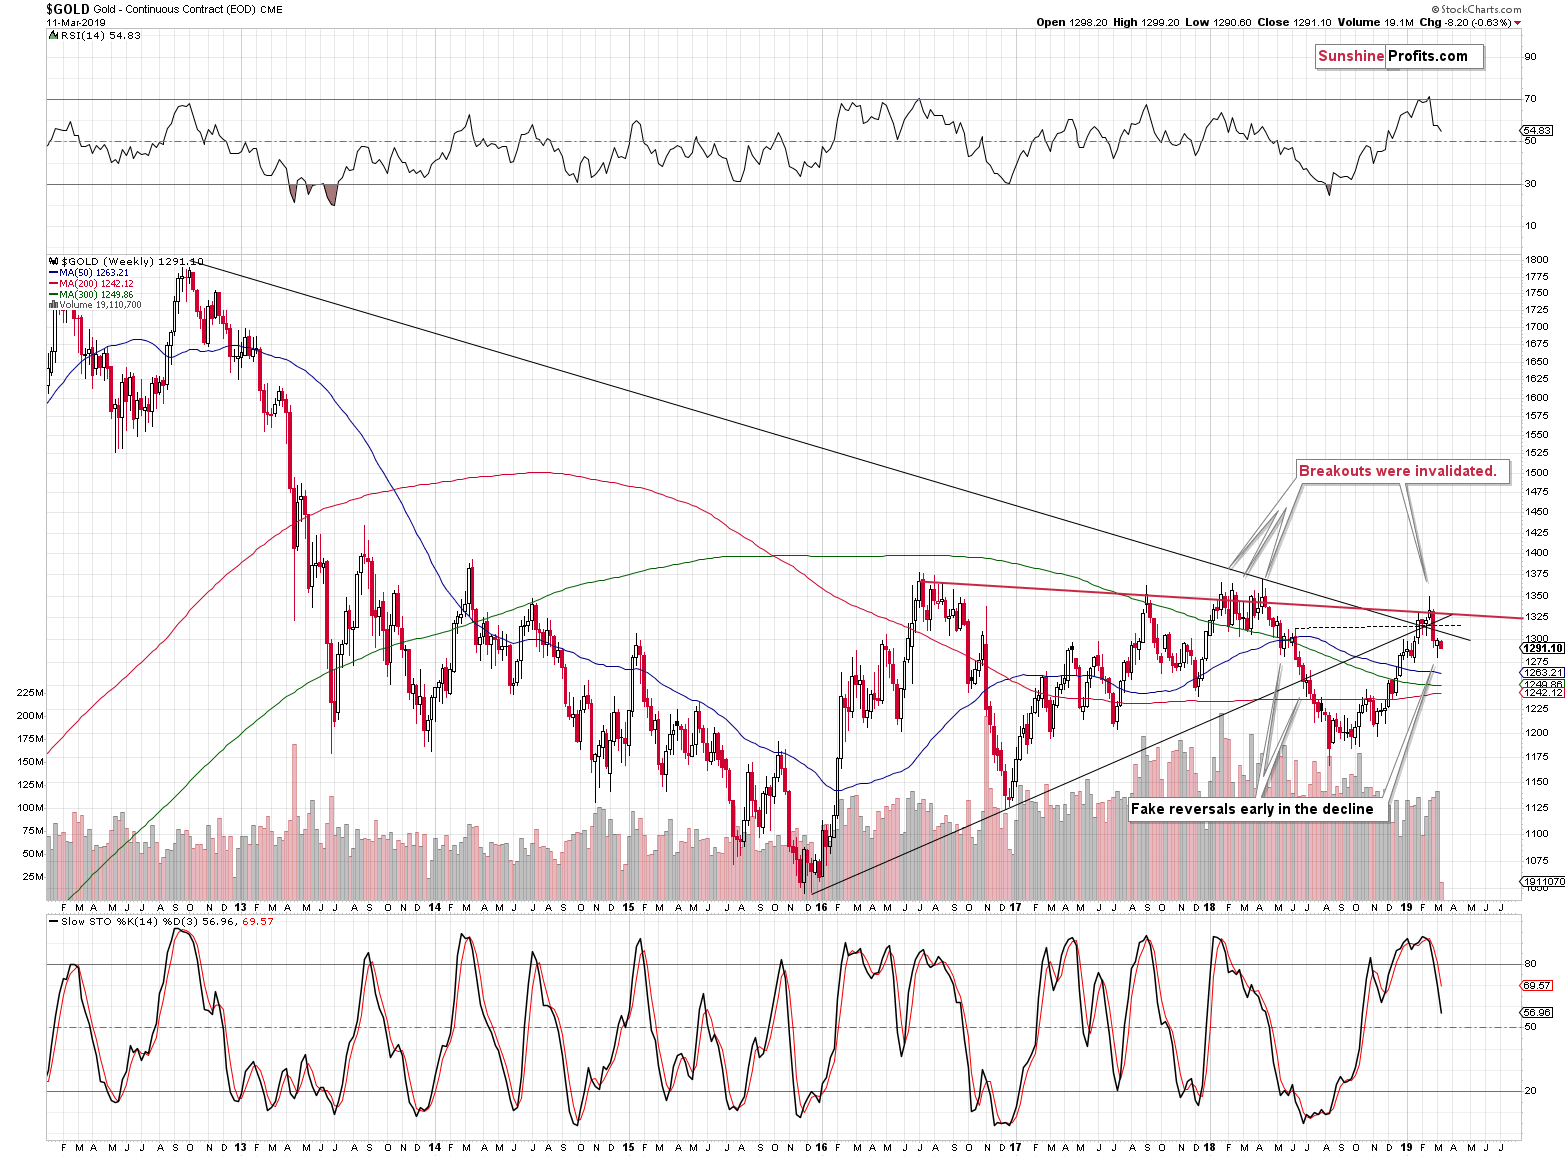
At first sight it seemed that last week’s reversal was a bullish sign. However, based on what we discovered beneath the surface, it turned out that the implications were actually neutral. Quoting our yesterday’s analysis of gold’s long-term chart:
It’s bullish on a stand-alone basis, but comparing last week’s reversal to the most similar moves form the recent past – the mid-2018 reversals – suggests otherwise. The early-May 2018 reversal and the early-July 2018 reversal were both just pauses within the broader decline. The weekly reversals were followed by only slightly higher prices and then by much bigger declines. It seems to have been a better choice to simply have waited out the tiny (from the medium-term point of view) corrections than chase the market higher. That proved to be a very tricky business.
On the bullish note, last week’s reversal was confirmed by significant volume, which adds to its credibility.
Should we therefore take last week’s candlestick regular implications into account, or should we pay attention to the most recent analogy? Should we view it as bullish or bearish? Both interpretations have their merits, so it seems prudent to view last week’s performance as neutral. This means that it didn’t change the very bearish implications for the next several months.
Indeed, gold didn’t soar yesterday, even though it “should have” based on the weekly reversal. We saw a daily decline instead. It’s now more likely than it was before yesterday’s session that gold will continue its decline shortly, after only a brief pause. This doesn’t mean that gold has to plunge immediately, though. The yellow metal moved back and for at least a few days before resuming the decline in both similar cases that we marked on the above chart.
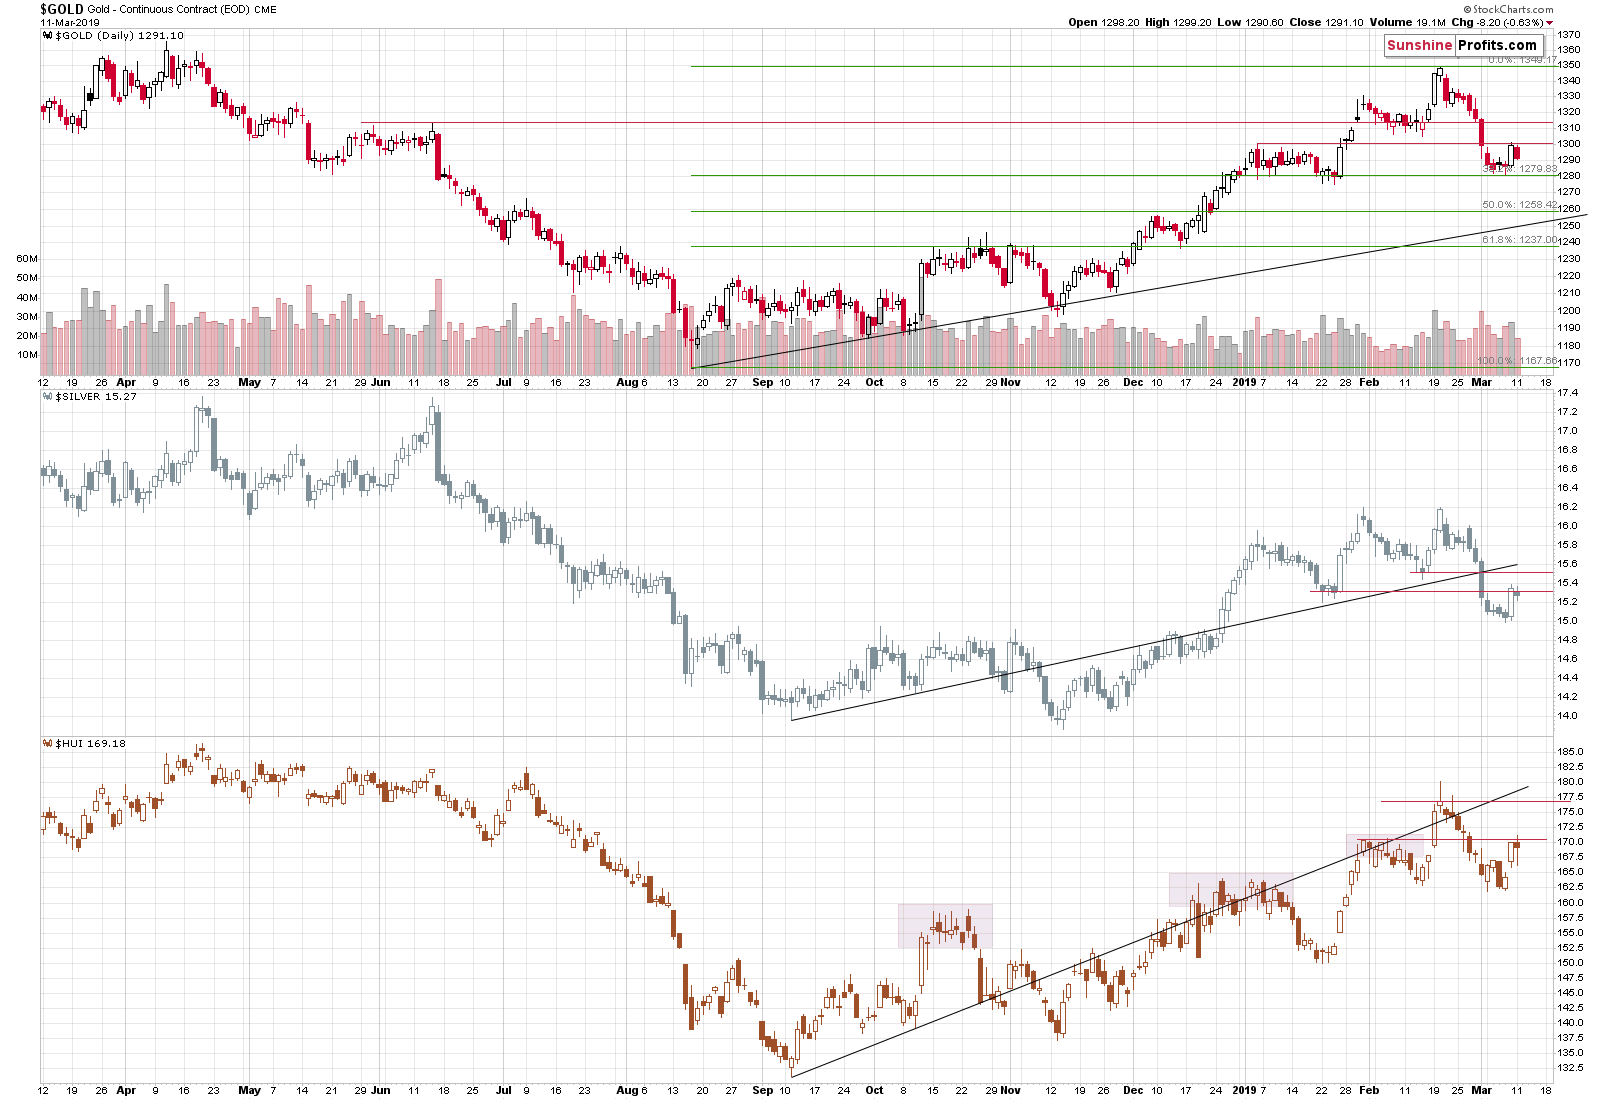
The examination of short-term price moves supports the above.
Corroborating Evidence
The most interesting confirmation comes from the mining stocks that you see in the lower part of the above chart. We marked three tops that the miners formed, and it took several days at least before the tops were completed. Gold, silver, and miners have all moved to their respective resistance levels. Gold and miners moved to their previous tops, and silver moved to its previous low. Can the PM market move even higher in the very short run? Yes. It’s not very likely, but it can happen. We marked additional resistance levels on the above chart. In the case of gold, the resistance is at about $1,310, whereas the resistance for silver is at about $15.50 and for mining stocks it’s at 177. The latter is particularly doubtful, because miners tend to underperform at or right before the local tops.
We are featuring these additional resistance levels, not because they are likely targets. We are featuring them to keep you informed and provide you with an early heads-up on what might happen if the PMs move higher – these are the levels that might be reached. Naturally, reaching none of them would invalidate the very strong medium-term bearish points that we made in the earlier Alerts.
If the analogy to 2012 repeats itself to the letter, we can expect gold to form the next local (not final) low at about $1,260 – the 50% Fibonacci retracement level based on the previous upswing.
The thing that determines whether the pause either ends right away, or continues for several more days might be the US dollar.
Consulting the USD
In yesterday’s Alert, we commented on the USD Index in the following way:
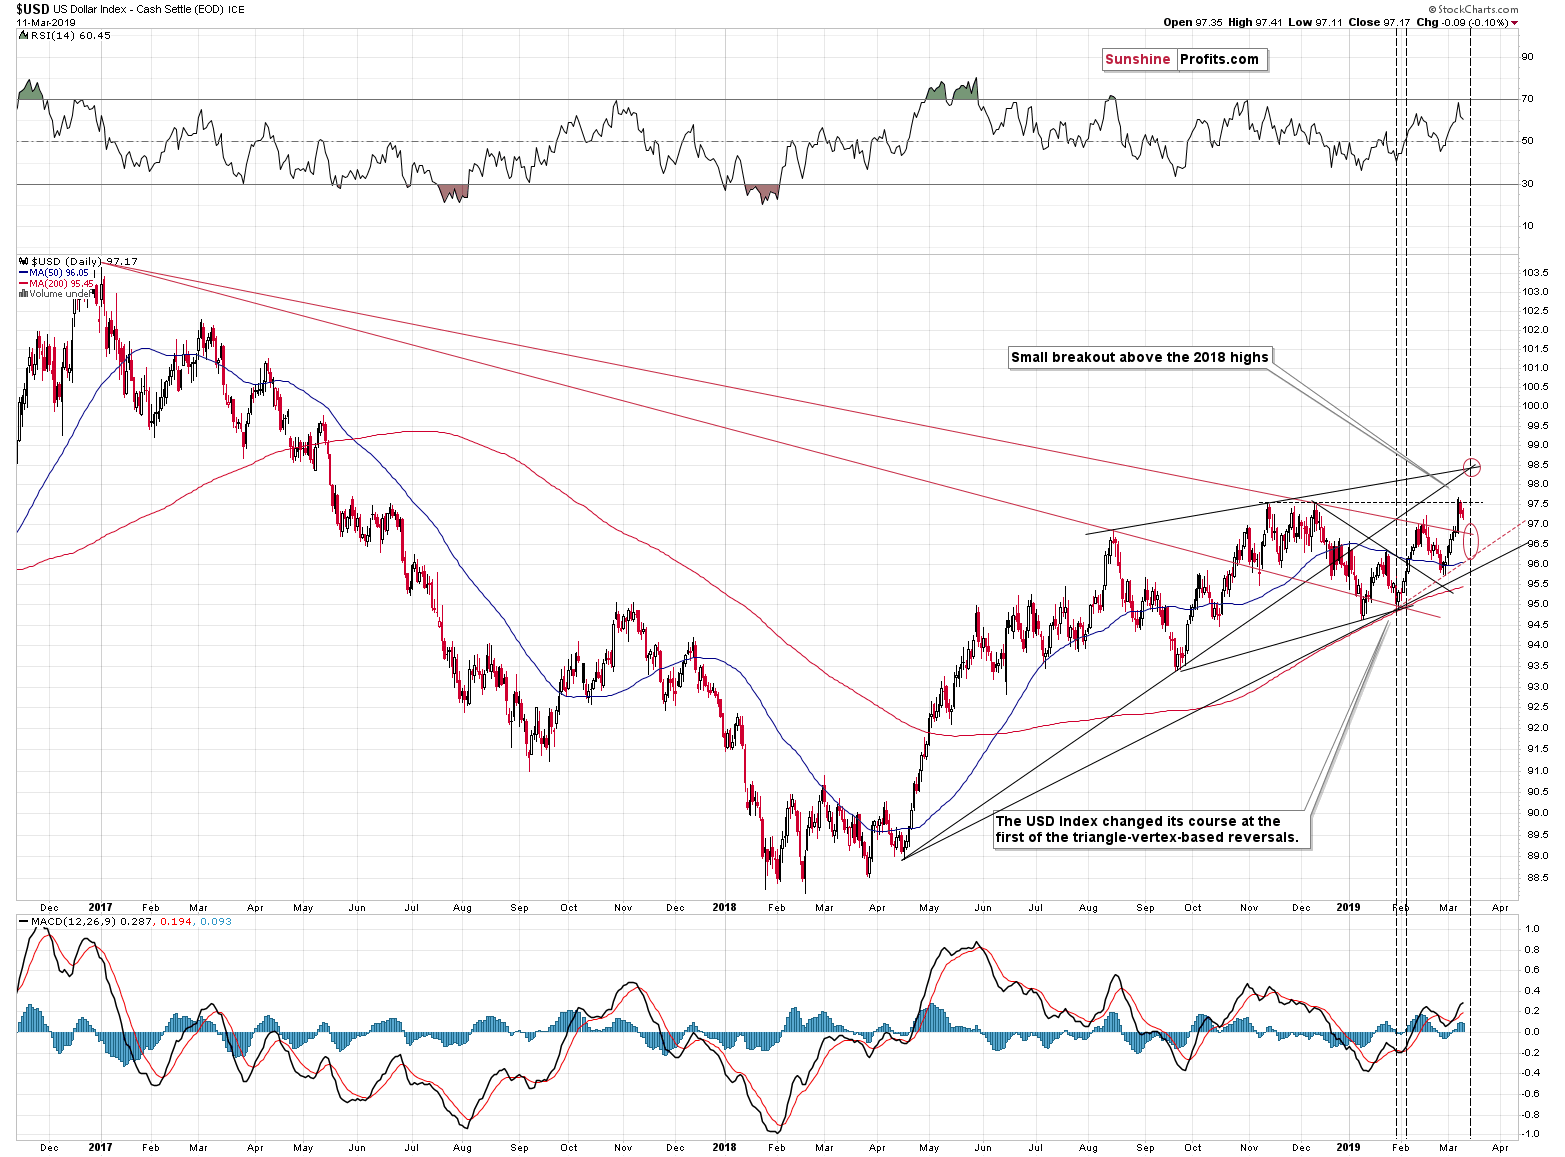
Meanwhile, the USD Index invalidated its tiny move above the previous highs and that was likely the thing that triggered the upswing in the PMs. The next triangle-vertex-based reversal is just around the corner and while it was possible that the USDX would rally and top at about 98.5 in several days, based on Friday’s invalidation, we need to consider a bearish resolution possibility.
The bearish possibility is USD’s decline to the previously broken declining resistance line (about 0.4 below Friday’s close) that could now be verified as support. That’s the nearest support and while the USD Index could move even lower based on the invalidation, it’s not very likely. After all, the fundamental situation for the EUR/USD just deteriorated based on ECB’s dovish turnaround comments.
Overall, implications for the precious market continue to be extremely bearish for the medium term. However, there is still a chance that we’ll see a bit more short-term strength before the slide continues. But – as you will also see below – it’s not particularly likely.
The USD Index declined yesterday, and it didn’t move to the previously broken declining resistance line either. This means that the bearish scenario is most likely being realized and thus that we can expect the USDX to move to about 96.6 before it rallies once again. Gold, silver, and mining stocks might move a bit higher during the USDX likely move, but they don’t have to. They just paused / declined yesterday, when the USDX moved lower, which means that they might just as well ignore another move lower.
Summary
Summing up, it’s almost certain that the next big move lower has already begun and that the 2013-like slide is in its early stage. Based on the updated version of the 2013-now link, the implications are even more bearish than we had initially assumed. The downside target for gold remains intact ($890), and the corrective upswing that we just saw seems to be rather natural part of the bigger move lower – not a beginning of an important move higher.
As always, we’ll keep you – our subscribers – informed.
To summarize:
Trading capital (supplementary part of the portfolio; our opinion): Full short position (250% of the full position) in gold, silver, and mining stocks is justified from the risk/reward perspective with the following stop-loss orders and exit profit-take price levels:
- Gold: profit-take exit price: $1,062; stop-loss: $1,357; initial target price for the DGLD ETN: $82.96; stop-loss for the DGLD ETN $39.87
- Silver: profit-take exit price: $12.32; stop-loss: $16.44; initial target price for the DSLV ETN: $47.67; stop-loss for the DSLV ETN $23.68
- Mining stocks (price levels for the GDX ETF): profit-take exit price: $13.12; stop-loss: $24.17; initial target price for the DUST ETF: $76.87; stop-loss for the DUST ETF $15.47
Note: the above is a specific preparation for a possible sudden price drop, it does not reflect the most likely outcome. You will find a more detailed explanation in our August 1st Alert. In case one wants to bet on junior mining stocks’ prices (we do not suggest doing so – we think senior mining stocks are more predictable in the case of short-term trades – if one wants to do it anyway, we provide the details), here are the stop-loss details and target prices:
- GDXJ ETF: profit-take exit price: $17.52; stop-loss: $35.67
- JDST ETF: initial target price: $143.87 stop-loss: $30.97
Long-term capital (core part of the portfolio; our opinion): No positions (in other words: cash)
Insurance capital (core part of the portfolio; our opinion): Full position
Important Details for New Subscribers
Whether you already subscribed or not, we encourage you to find out how to make the most of our alerts and read our replies to the most common alert-and-gold-trading-related-questions.
Please note that the in the trading section we describe the situation for the day that the alert is posted. In other words, it we are writing about a speculative position, it means that it is up-to-date on the day it was posted. We are also featuring the initial target prices, so that you can decide whether keeping a position on a given day is something that is in tune with your approach (some moves are too small for medium-term traders and some might appear too big for day-traders).
Plus, you might want to read why our stop-loss orders are usually relatively far from the current price.
Please note that a full position doesn’t mean using all of the capital for a given trade. You will find details on our thoughts on gold portfolio structuring in the Key Insights section on our website.
As a reminder – “initial target price” means exactly that – an “initial” one, it’s not a price level at which we suggest closing positions. If this becomes the case (like it did in the previous trade) we will refer to these levels as levels of exit orders (exactly as we’ve done previously). Stop-loss levels, however, are naturally not “initial”, but something that, in our opinion, might be entered as an order.
Since it is impossible to synchronize target prices and stop-loss levels for all the ETFs and ETNs with the main markets that we provide these levels for (gold, silver and mining stocks – the GDX ETF), the stop-loss levels and target prices for other ETNs and ETF (among other: UGLD, DGLD, USLV, DSLV, NUGT, DUST, JNUG, JDST) are provided as supplementary, and not as “final”. This means that if a stop-loss or a target level is reached for any of the “additional instruments” (DGLD for instance), but not for the “main instrument” (gold in this case), we will view positions in both gold and DGLD as still open and the stop-loss for DGLD would have to be moved lower. On the other hand, if gold moves to a stop-loss level but DGLD doesn’t, then we will view both positions (in gold and DGLD) as closed. In other words, since it’s not possible to be 100% certain that each related instrument moves to a given level when the underlying instrument does, we can’t provide levels that would be binding. The levels that we do provide are our best estimate of the levels that will correspond to the levels in the underlying assets, but it will be the underlying assets that one will need to focus on regarding the signs pointing to closing a given position or keeping it open. We might adjust the levels in the “additional instruments” without adjusting the levels in the “main instruments”, which will simply mean that we have improved our estimation of these levels, not that we changed our outlook on the markets. We are already working on a tool that would update these levels on a daily basis for the most popular ETFs, ETNs and individual mining stocks.
Our preferred ways to invest in and to trade gold along with the reasoning can be found in the how to buy gold section. Additionally, our preferred ETFs and ETNs can be found in our Gold & Silver ETF Ranking.
As a reminder, Gold & Silver Trading Alerts are posted before or on each trading day (we usually post them before the opening bell, but we don't promise doing that each day). If there's anything urgent, we will send you an additional small alert before posting the main one.
=====
Latest Free Trading Alerts:
The World Gold Council has issued quite a few interesting papers recently. In this edition of the Gold News Monitor, we discuss the most provocative ones. Such as the money worthiness of gold compared to Bitcoin. Or the ongoing gold repatriation trend as Romania recently joined the fray. What kind of learnings can the precious metals investors draw here?
Will Cryptocurrencies Replace Gold?
=====
Thank you.
Sincerely,
Przemyslaw Radomski, CFA
Editor-in-chief, Gold & Silver Fund Manager


