

Briefly: In our opinion, full (100% of the regular full position) speculative short positions in gold, silver and mining stocks are justified from the risk/reward perspective at the moment of publishing this alert.
The USD Index soared on Monday, while gold declined and broke through its short-term support levels. Silver plunged as well and the key question is if these moves were temporary, or is this an extension of the rally that we had seen previously.
In short, it seems that the latter is more probable. The key detail didn’t come from the price of gold, or silver, but from the way they both reacted to the movement in the USD Index. Let’s start by looking at its key component, the EUR/USD (chart courtesy of http://stockcharts.com).
Euro Index
In the previous alerts, we wrote the following:
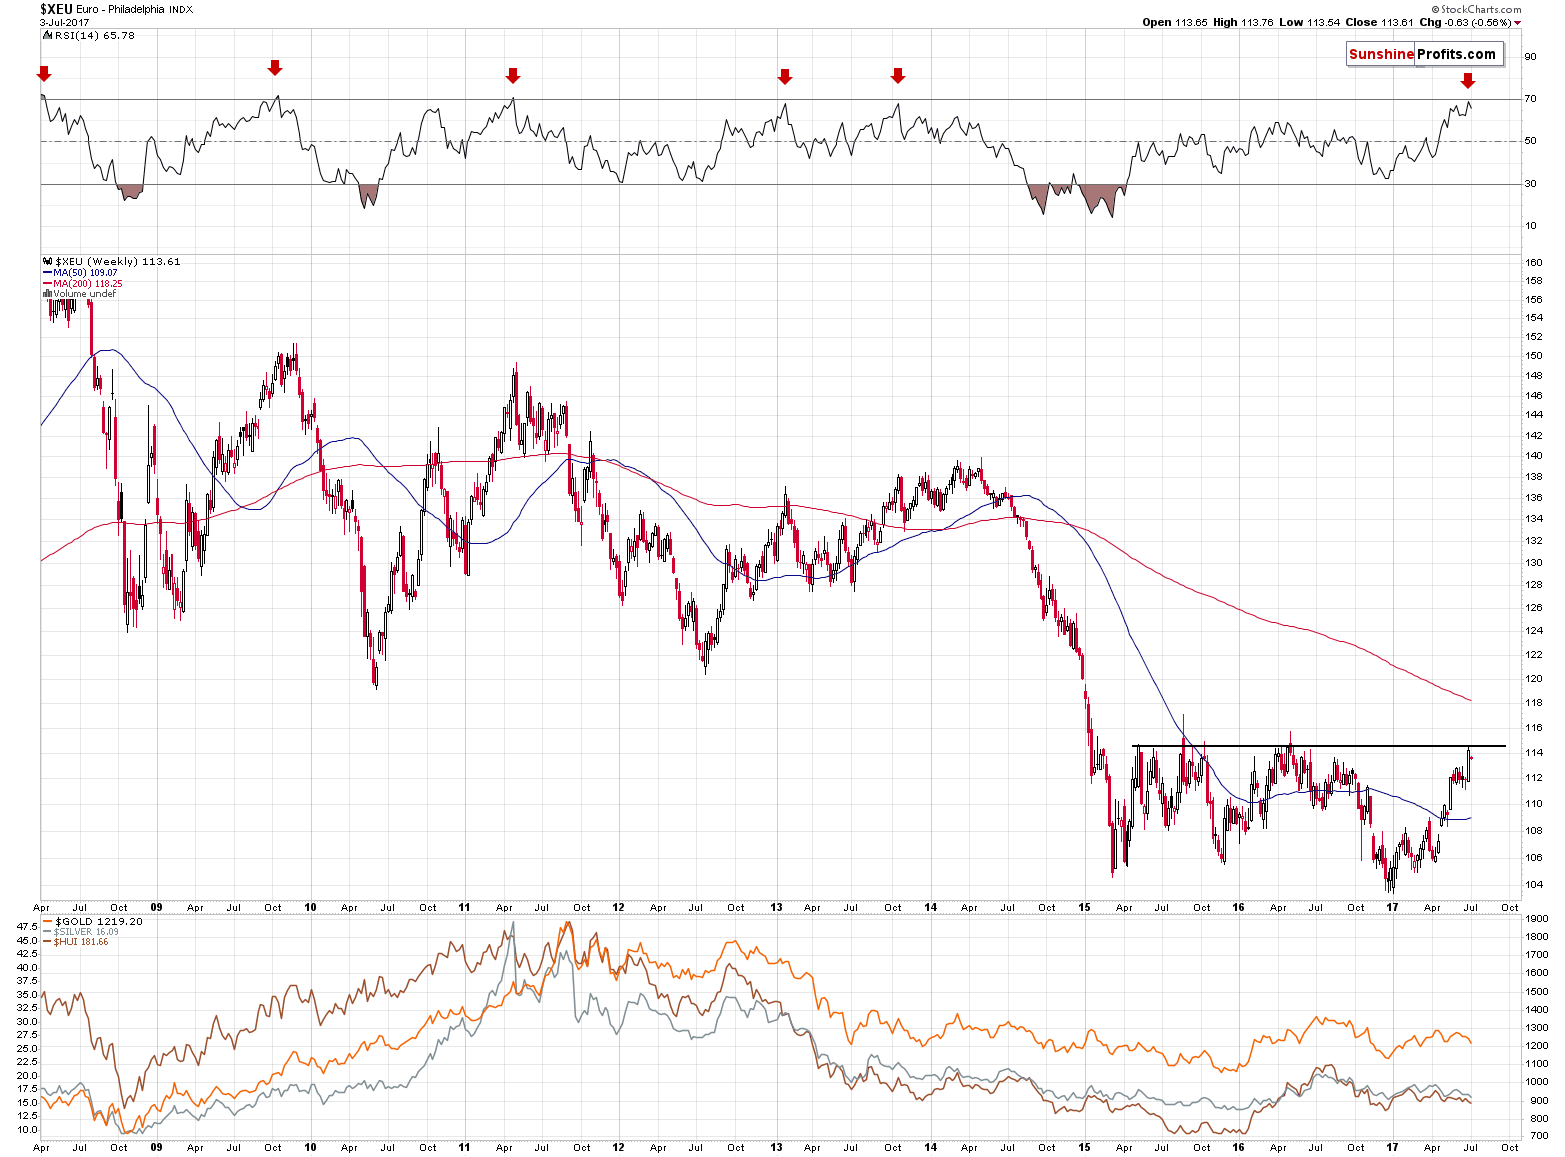
In short, it strongly appears that the euro has either reached its top or is about to do so shortly (perhaps today). The horizontal resistance line that you can see on the above chart is based on the highest weekly closes of the previous years. The weekly closing prices are the key closes to keep in mind in the case of bigger trends and the level that was just reached stopped the rally twice. There were temporary moves above it, but they all were very temporary. Since the week is ending today, it appears that the top is in or that we will see only a temporary upswing and a weekly close back at/below the resistance line.
A strong bearish confirmation comes from the RSI indicator – practically in all recent cases (the last 9 years), the readings of the RSI that were as high as the current ones meant that the euro was going to reverse shortly.
So, despite the bullish action [last] week, the outlook for the euro is actually very bearish and the chart is quite clear about that.
The key question is: how does this relate to the gold market?
In most cases, the euro and gold moved together and thus, in most cases, the interpretation was quite straightforward – what’s bearish for the euro is bearish for gold. However, it was recently the case that the same reason caused the euro to rally and gold to decline – indications that the fundamental situation in the Eurozone is improving.
Consequently, applying the regular relation between the euro and gold in this case may be misleading, as gold showed that this time it behaves differently. The analytical problem here is that it could be the case that as the euro reverses, other things that resulted from the previous upswing in it will also reverse. This would imply a move higher in gold along with a declining euro.
Monday’s session seems to have solved the above dilemma – gold plunged along with a decline in the euro. Consequently, based on what happened on Monday, it appears that the correct interpretation going forward is that the additional declines in the euro (which are likely to be seen), will trigger additional declines in gold and the rest of the precious metals sector.
Furthermore, it likely means (ideally, we would like this relationship provide an additional proof of its existence, by moving together for an additional day or two) that the previous move lower in gold along with a move higher in the euro can be seen as gold’s weakness – even though gold normally rallies along with the euro, it didn’t do so this time. A failure to react to bullish signals is a bearish signal on its own.
Summing up, Monday’s session was very informative as it revealed gold’s intentions going forward.
Speaking of currencies, let’s take a look at the Japanese yen.
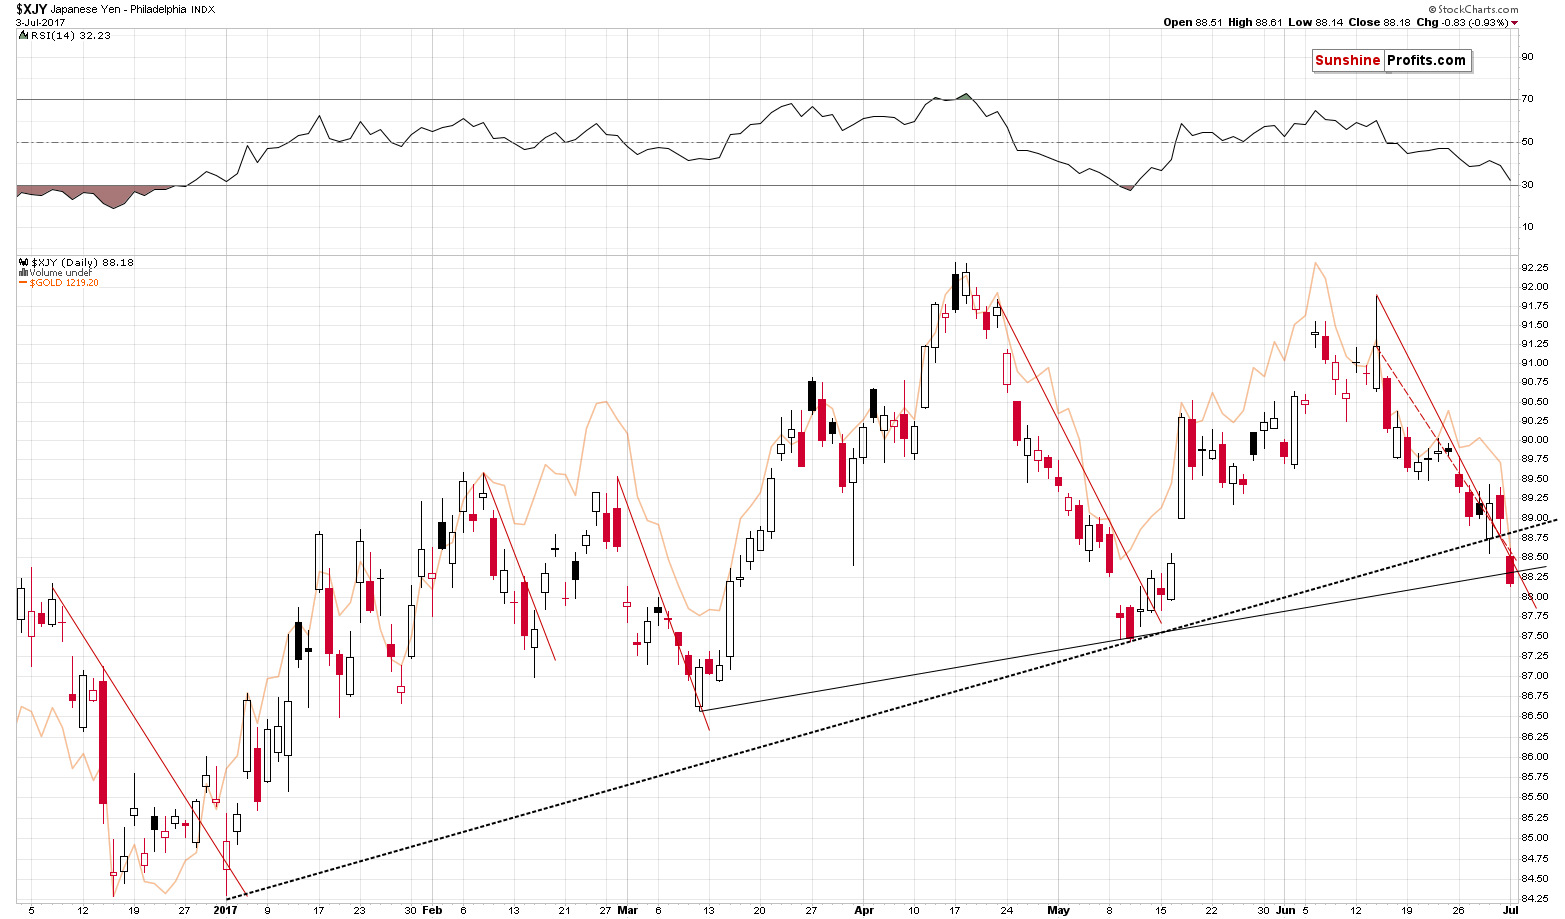
The yen did something unlikely – even though it had moved to support levels and broke above the resistance line (and it still seems that taking profits from the trading position in this currency pair was justified), it declined sharply on Monday, breaking through (and closing below) 3 support lines: the short-term one based on the recent tops and 2 medium-term ones based on previous lows. The short-term outlook for the Japanese yen has just deteriorated substantially.
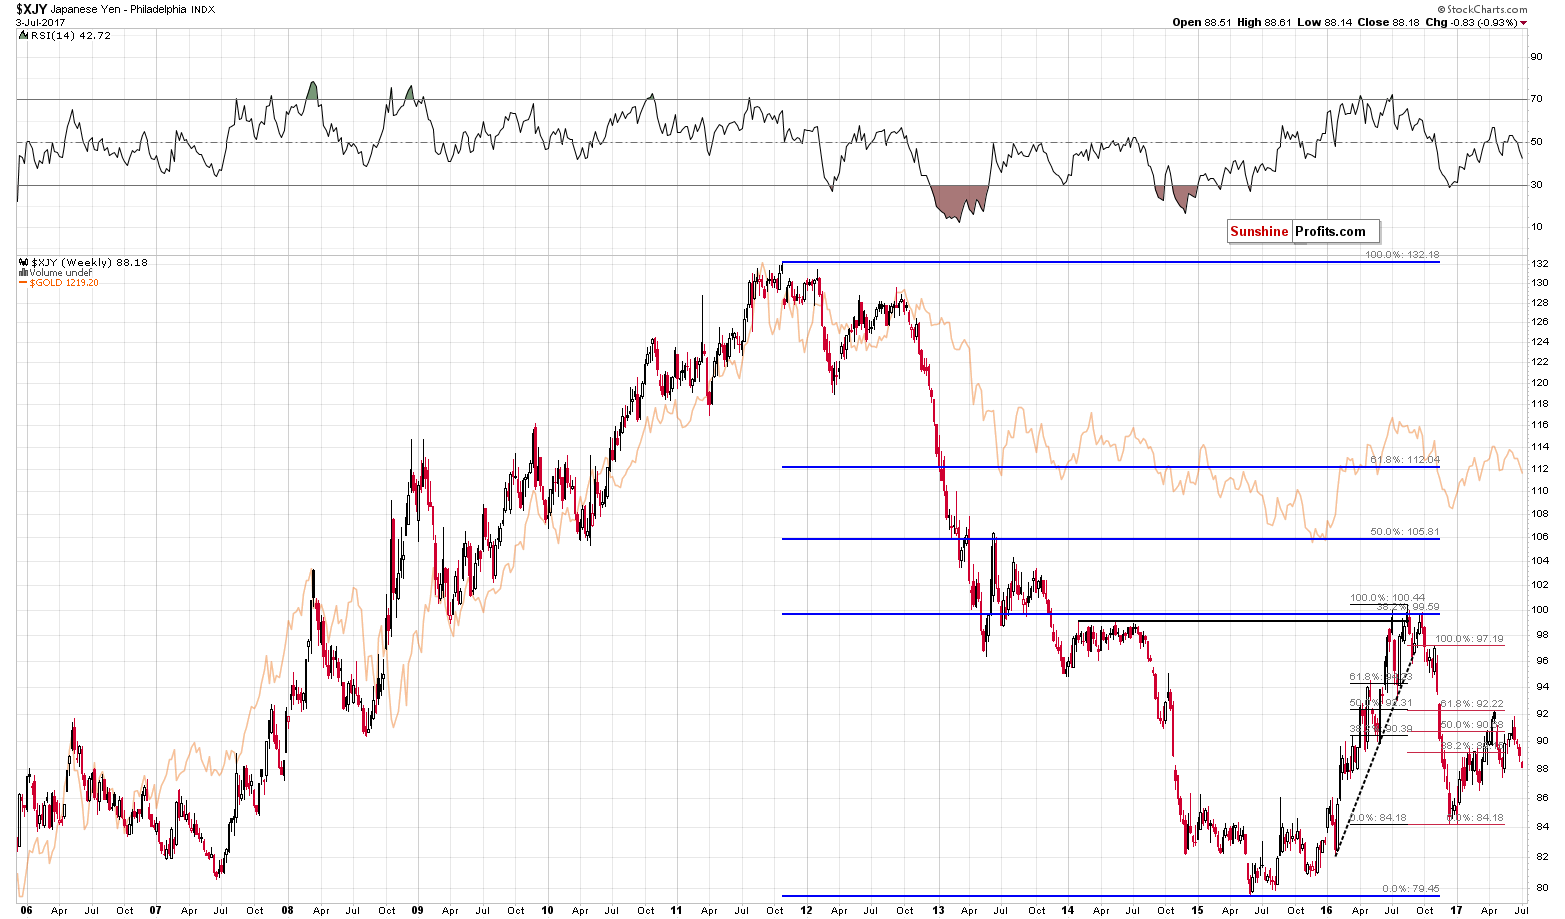
Given the above long-term yen chart, the change in the short-term outlook implies that the 2017 corrective upswing is over and that the yen can now move substantially lower (below the 2016 low and quite possibly below the 2015 low as well). Given the strong gold-yen link, the above has profoundly bearish implications for the precious metals market.
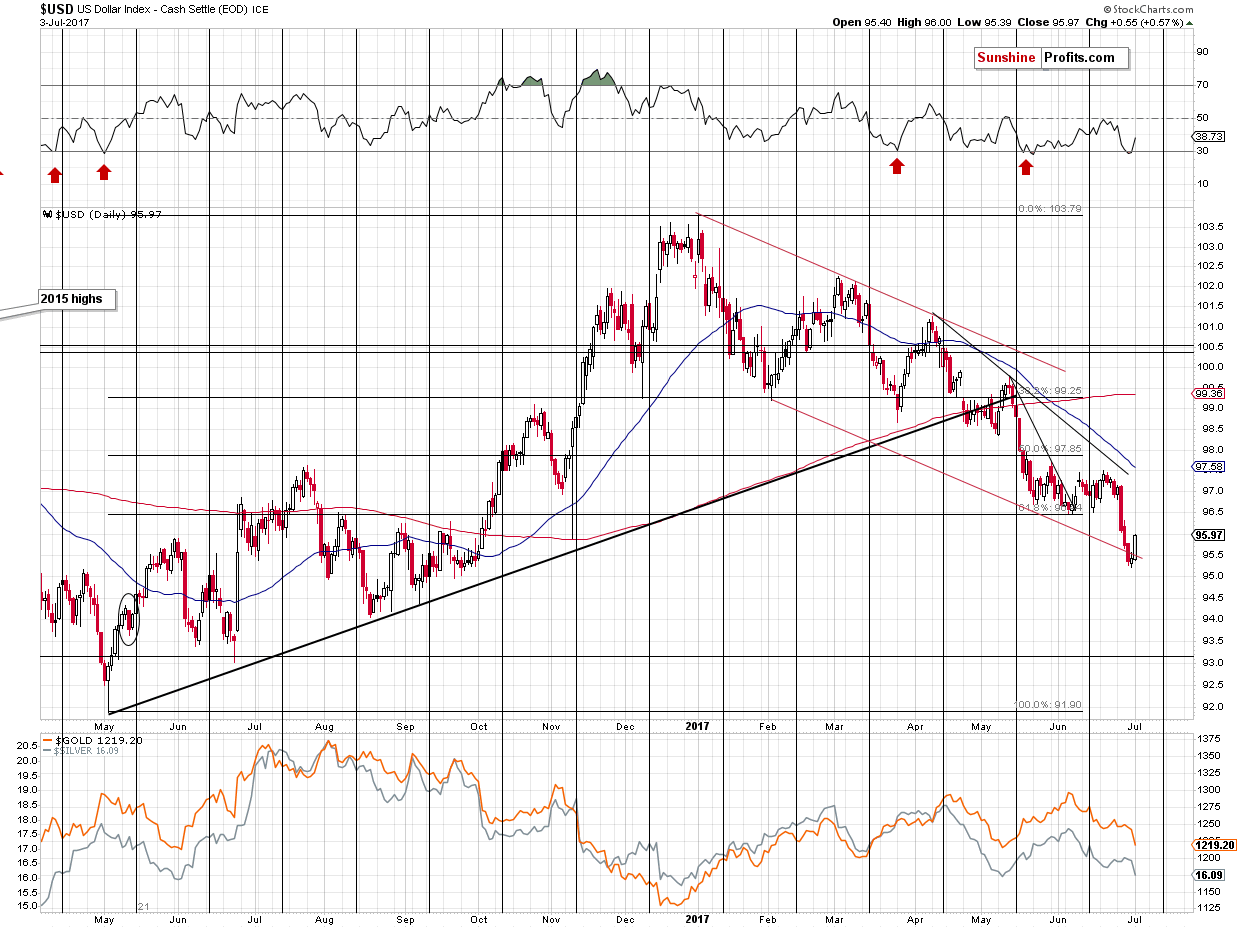
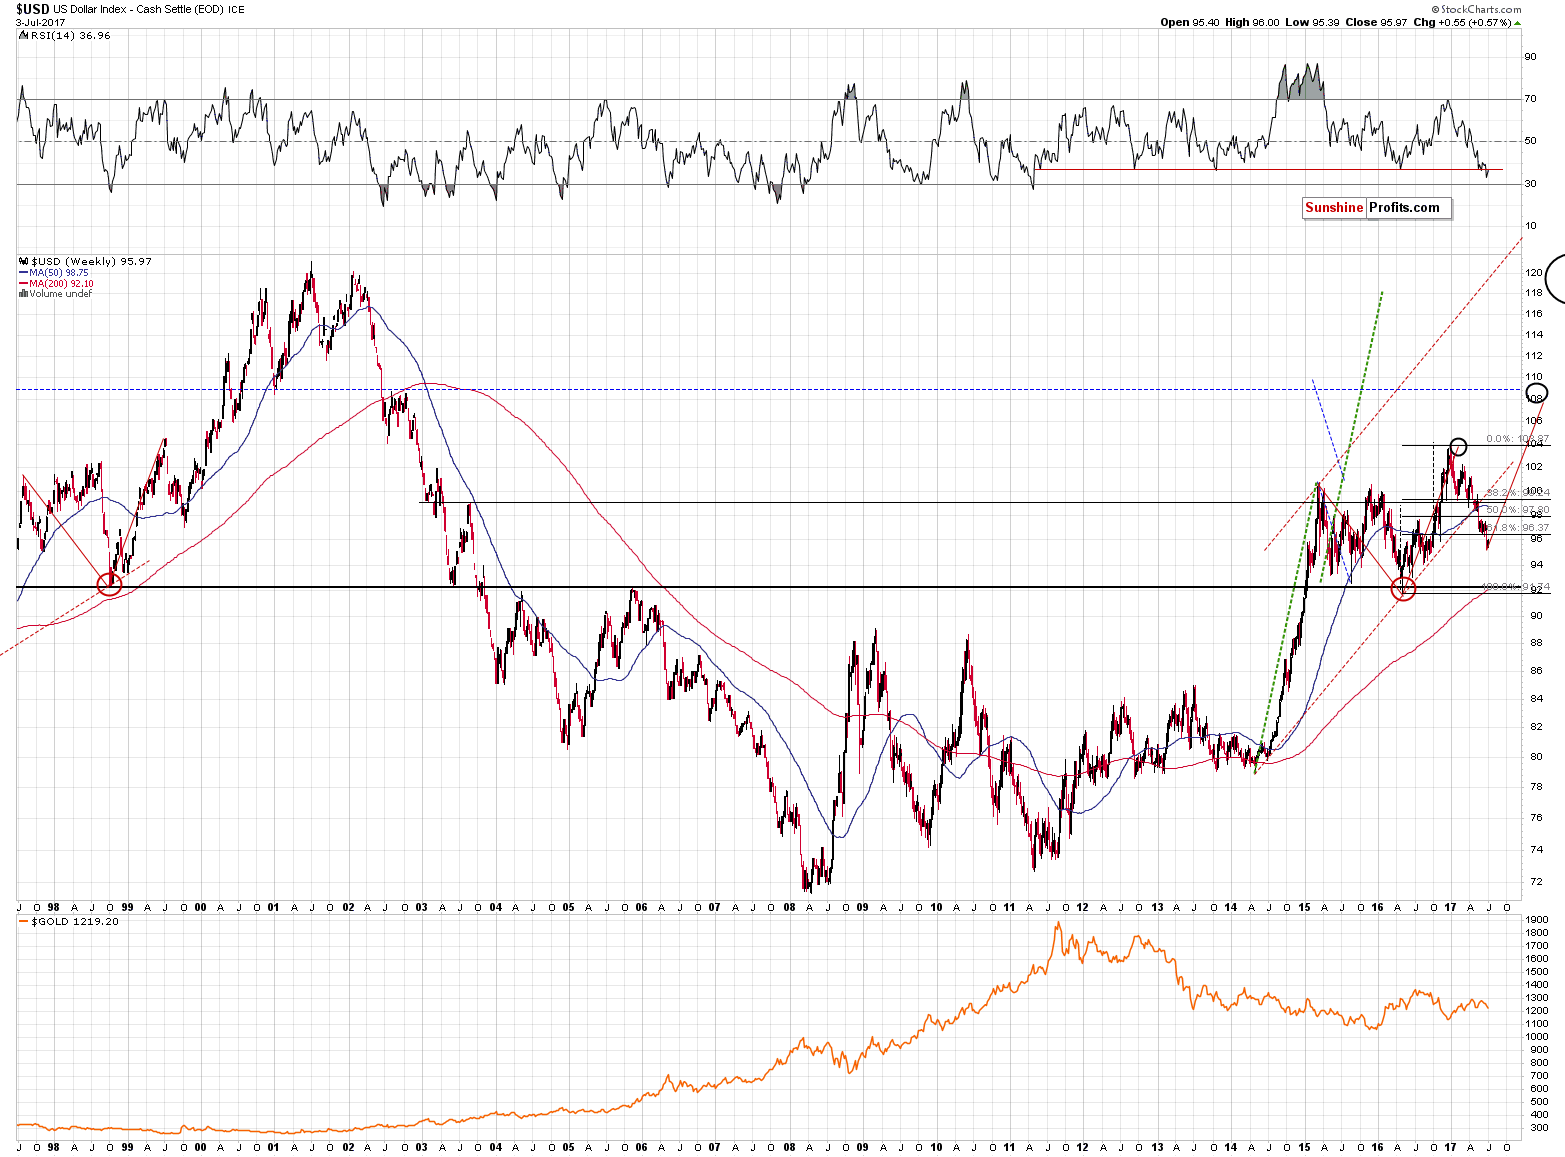
The above changes in individual currency pairs are reflected by the changes in the USD Index – it invalidated the breakdown below the declining red support line (visible on the short-term chart; marked in red) and it seems that it’s about to invalidate the breakdown below the 61.8% Fibonacci retracement level seen on the long-term chart. The latter is at about 96.37 and the USD Index already moved to 96.24 today. The target for the following months at about 108 – 110 remains up-to-date and so do the bearish implications for the precious metals market.
Gold’s Price Changes
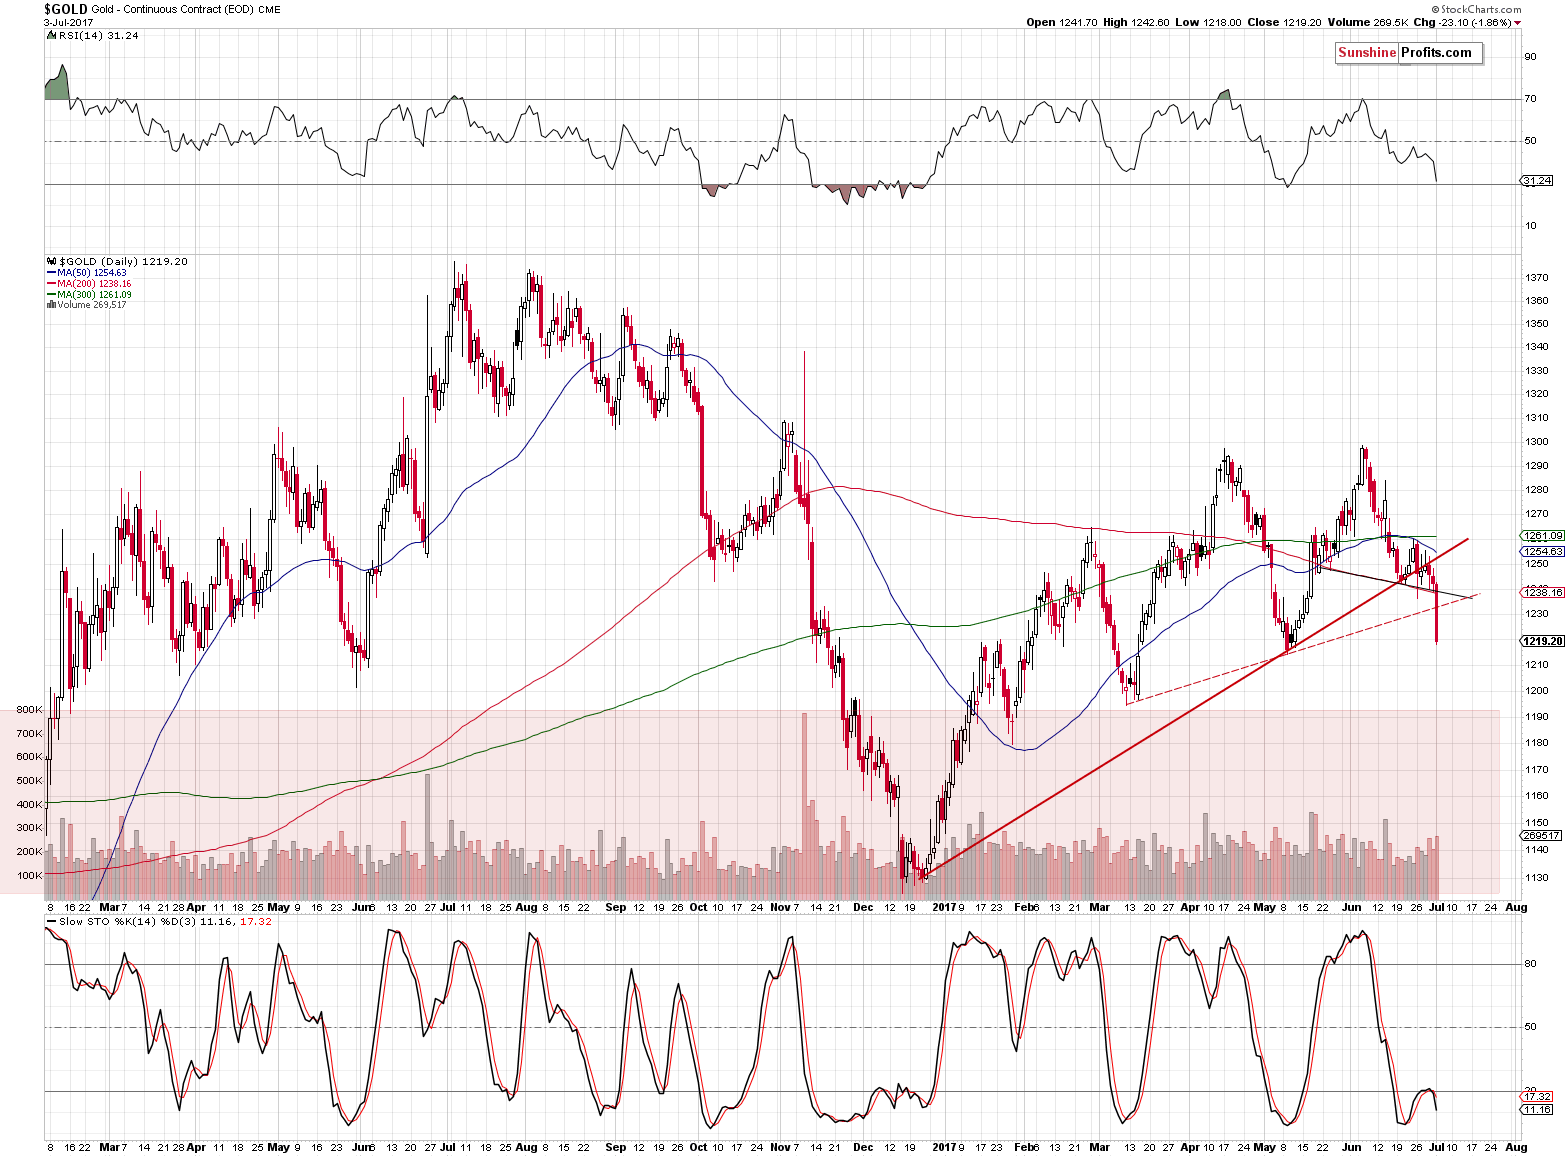
Just like the Japanese yen, gold broke below its support levels and the implications are clearly bearish.
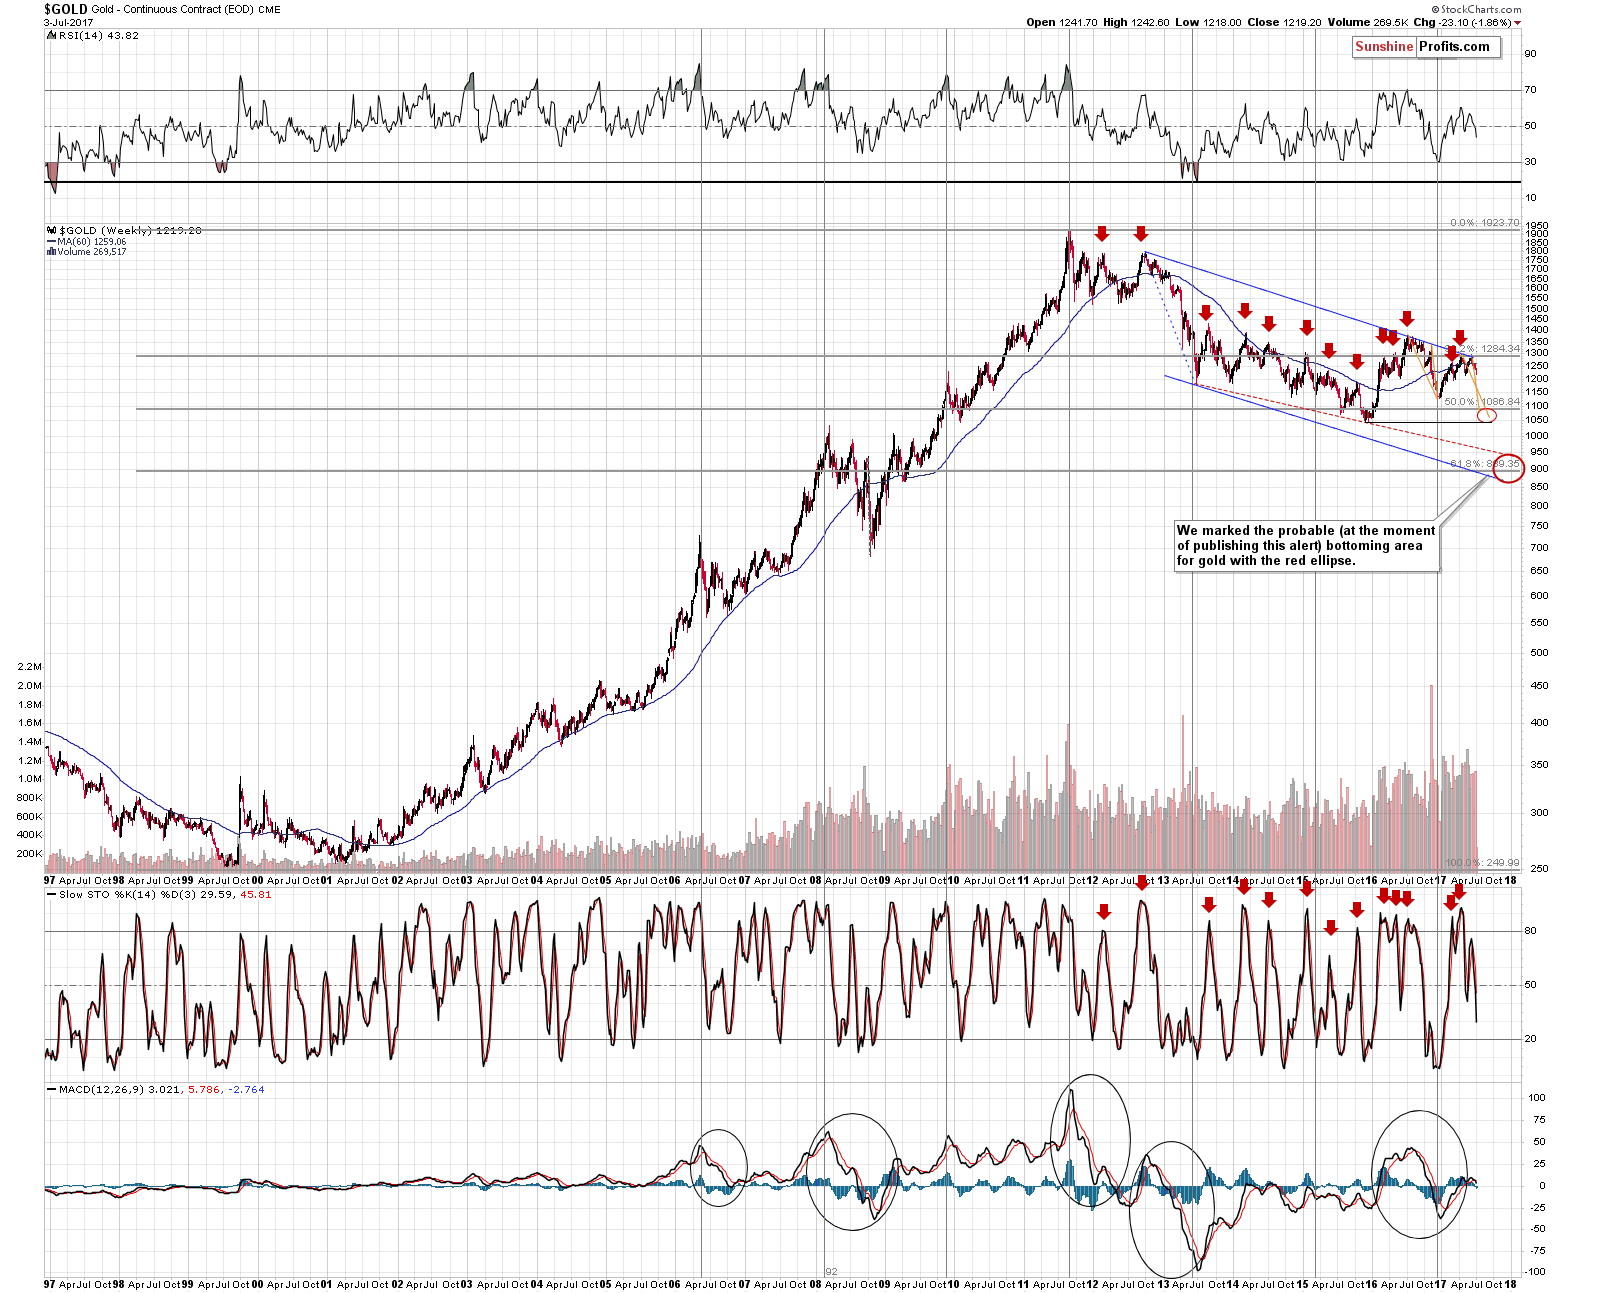
The long-term gold chart additionally shows a move in the RSI indicator below its previous lows (negative divergence), and sell signals from the Stochastic and MACD indicators. The medium-term outlook didn’t change based on the recent events as it hadn’t become bullish – it’s been bearish and remains bearish at this time as well.
It continues to be very likely that we will see much lower gold prices in the coming months and that we will be able to take advantage of an extremely favorable buying opportunity (most likely this winter).
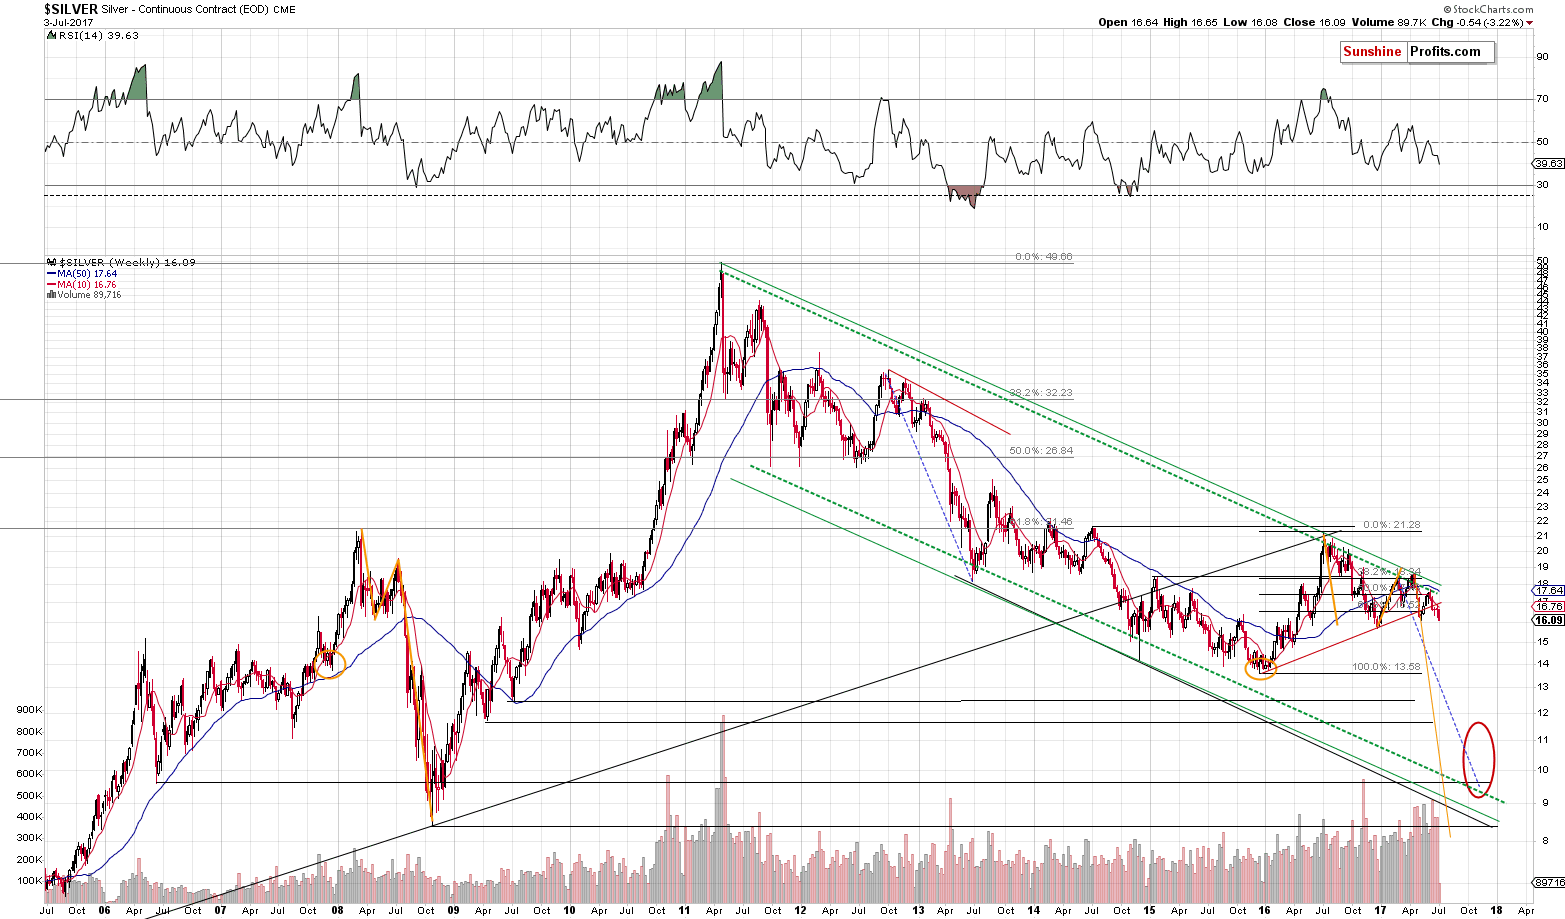
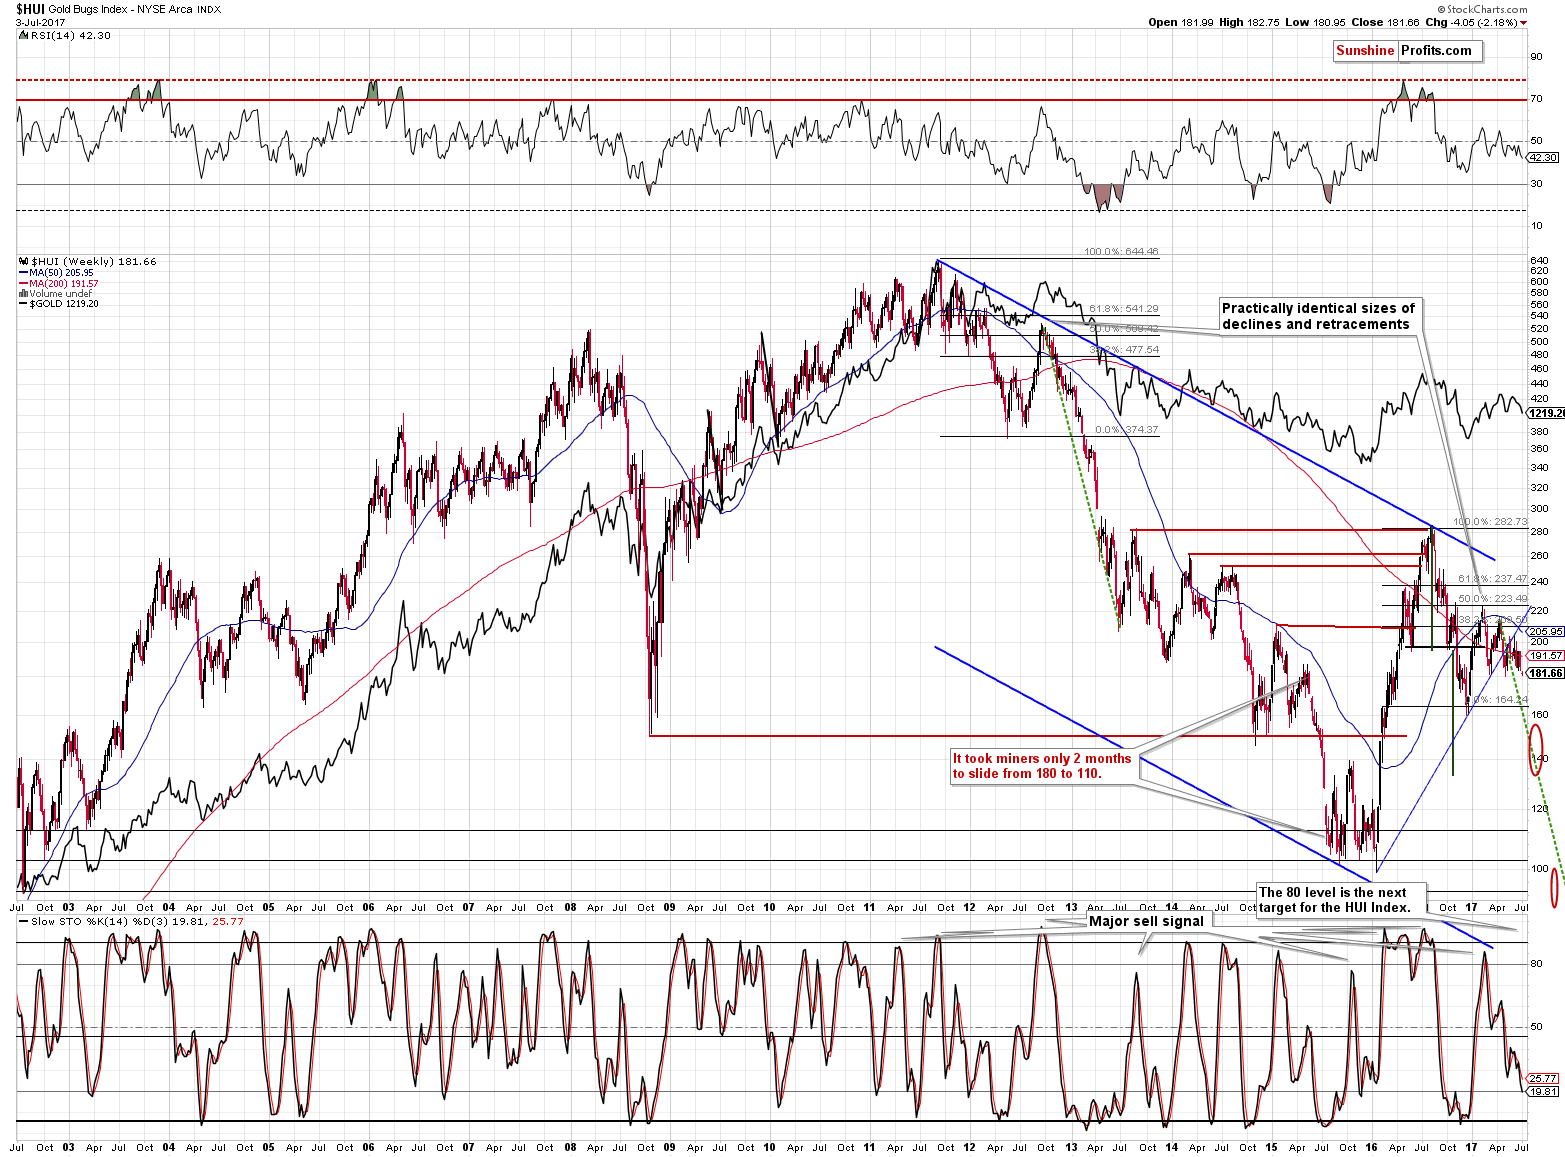
The long-term charts for silver and gold stocks also paint a very bearish picture for the following months.
Silver moved to the previously broken rising red support line and verified it as resistance and the same thing had already taken place in the case of the HUI Index – the recent strength was yet another verification. The sell signal from the Stochastic indicator in case of mining stocks also remains in place.
Summing up, the outlook remains very bearish for the following months and based on what we saw on Monday, it seems that the pre-plunge short-term upswing is already behind us. Once we see additional bearish confirmations (for instance in the form of a comeback above the 61.8% Fibonacci retracement in the case of the USD Index along with another decline in gold that will further prove the comeback of the regular gold-USD link), we’ll likely further increase the size of the current speculative short position.
Most importantly, however, please keep in mind that the biggest buying opportunity for the precious metals is likely just months (not years) away.
As always, we will keep you – our subscribers – informed.
To summarize:
Trading capital (supplementary part of the portfolio; our opinion): Short positions (100% of the full position) in gold, silver and mining stocks are justified from the risk/reward perspective with the following stop-loss orders and initial target price levels / profit-take orders:
- Gold: exit-profit-take level: $1,063; stop-loss: $1,317; initial target price for the DGLD ETN: $81.88; stop-loss for the DGLD ETN $44.57
- Silver: initial target price: $13.12; stop-loss: $19.22; initial target price for the DSLV ETN: $46.18; stop-loss for the DSLV ETN $17.93
- Mining stocks (price levels for the GDX ETF): initial target price: $9.34; stop-loss: $26.34; initial target price for the DUST ETF: $143.56; stop-loss for the DUST ETF $21.37
In case one wants to bet on junior mining stocks' prices (we do not suggest doing so – we think senior mining stocks are more predictable in the case of short-term trades – if one wants to do it anyway, we provide the details), here are the stop-loss details and initial target prices:
- GDXJ ETF: initial target price: $14.13; stop-loss: $45.31
- JDST ETF: initial target price: $417.04; stop-loss: $43.12
Long-term capital (core part of the portfolio; our opinion): No positions (in other words: cash)
Insurance capital (core part of the portfolio; our opinion): Full position
Please note that the in the trading section we describe the situation for the day that the alert is posted. In other words, it we are writing about a speculative position, it means that it is up-to-date on the day it was posted. We are also featuring the initial target prices, so that you can decide whether keeping a position on a given day is something that is in tune with your approach (some moves are too small for medium-term traders and some might appear too big for day-traders).
Plus, you might want to read why our stop-loss orders are usually relatively far from the current price.
Please note that a full position doesn’t mean using all of the capital for a given trade. You will find details on our thoughts on gold portfolio structuring in the Key Insights section on our website.
As a reminder – “initial target price” means exactly that – an “initial” one, it’s not a price level at which we suggest closing positions. If this becomes the case (like it did in the previous trade) we will refer to these levels as levels of exit orders (exactly as we’ve done previously). Stop-loss levels, however, are naturally not “initial”, but something that, in our opinion, might be entered as an order.
Since it is impossible to synchronize target prices and stop-loss levels for all the ETFs and ETNs with the main markets that we provide these levels for (gold, silver and mining stocks – the GDX ETF), the stop-loss levels and target prices for other ETNs and ETF (among other: UGLD, DGLD, USLV, DSLV, NUGT, DUST, JNUG, JDST) are provided as supplementary, and not as “final”. This means that if a stop-loss or a target level is reached for any of the “additional instruments” (DGLD for instance), but not for the “main instrument” (gold in this case), we will view positions in both gold and DGLD as still open and the stop-loss for DGLD would have to be moved lower. On the other hand, if gold moves to a stop-loss level but DGLD doesn’t, then we will view both positions (in gold and DGLD) as closed. In other words, since it’s not possible to be 100% certain that each related instrument moves to a given level when the underlying instrument does, we can’t provide levels that would be binding. The levels that we do provide are our best estimate of the levels that will correspond to the levels in the underlying assets, but it will be the underlying assets that one will need to focus on regarding the signs pointing to closing a given position or keeping it open. We might adjust the levels in the “additional instruments” without adjusting the levels in the “main instruments”, which will simply mean that we have improved our estimation of these levels, not that we changed our outlook on the markets. We are already working on a tool that would update these levels on a daily basis for the most popular ETFs, ETNs and individual mining stocks.
Our preferred ways to invest in and to trade gold along with the reasoning can be found in the how to buy gold section. Additionally, our preferred ETFs and ETNs can be found in our Gold & Silver ETF Ranking.
As always, we'll keep you - our subscribers - updated should our views on the market change. We will continue to send out Gold & Silver Trading Alerts on each trading day and we will send additional Alerts whenever appropriate.
The trading position presented above is the netted version of positions based on subjective signals (opinion) from your Editor, and the Tools and Indicators.
As a reminder, Gold & Silver Trading Alerts are posted before or on each trading day (we usually post them before the opening bell, but we don't promise doing that each day). If there's anything urgent, we will send you an additional small alert before posting the main one.
=====
Latest Free Trading Alerts:
Last week, the Federal Reserve released the results of supervisory bank stress tests. What do they mean for the gold market?
Fed's 2017 Stress Tests and Gold
Crude oil soared for the first time in 6 weeks and the rally continued on Monday – is it high time for the black gold to end its rally or at least take a breather?
Crude Oil: How High is Too High?
=====
Hand-picked precious-metals-related links:
UBS Wealth Recommends Buying Gold Near $1,200 for Insurance
Black gold: India tax hike could boost illegal bullion, jewelry sales
=====
In other news:
Global stocks recover as eyes shift to Fed minutes
North Korea says its ICBM can carry nuclear warhead; U.S. calls for global action
Bitcoin Could Surge To Nearly $4,000 — Goldman Sachs
=====
Thank you.
Sincerely,
Przemyslaw Radomski, CFA
Founder, Editor-in-chief, Gold & Silver Fund Manager
Gold & Silver Trading Alerts
Forex Trading Alerts
Oil Investment Updates
Oil Trading Alerts

