Trading position (short-term; our opinion): Already profitable short positions with a stop-loss order at $77.44 and the initial downside target at $67.95 are justified from the risk/reward perspective.
On Thursday, the overall situation in crude oil hasn’t changed much as the commodity slipped to the nearest support and rebounded slightly. Are the bears tired of running south or is it a well thought out trap for investors who only see single trees instead of the whole forest?
Let’s examine the recent changes on the charts below (charts courtesy of http://stockcharts.com).
Technical Picture of Crude Oil
Quoting our last Oil Trading Alert:
(…) the price of crude oil moved sharply lower during yesterday’s session, making our short positions profitable.
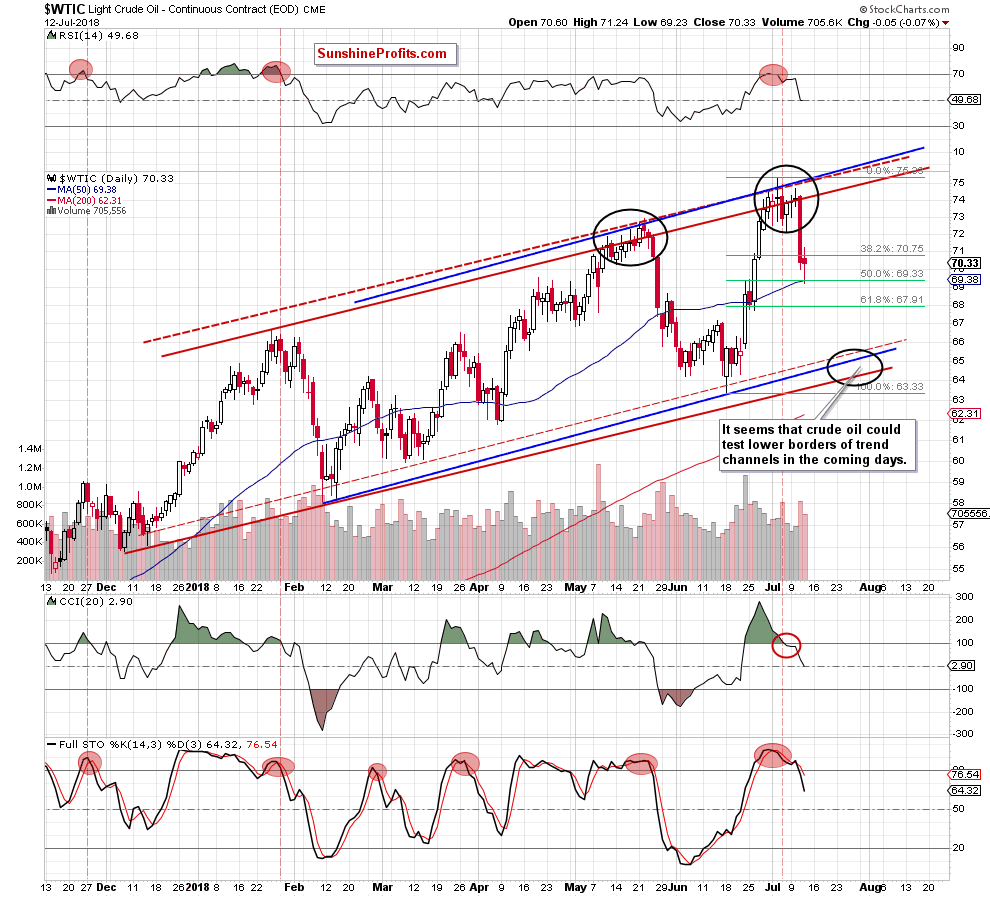
Thanks to yesterday’s price action, light crude broke not only below the last week’s low but also under the 38.2% Fibonacci retracement based on the entire June’s upward move, opening the way to lower levels.
Additionally, the volume increased significantly (comparing to what we saw during recent “increases”), confirming oil bears’ strength and suggesting a test of the next Fibonacci retracements in the near future. At this point, it is worth noting that the nearest support (the 50% retracement) is reinforced by the 50-day moving average, which could encourage oil bulls to stop their opponents.
Looking at the daily chart, we see that the situation developed in tune with our yesterday’s assumptions and oil bulls bounced off the above-mentioned support area. Does it mean that declines are over? In our opinion, not at all.
Why? (we know that you like this question)
First, invalidations of the earlier breakouts above the upper lines of the trend channels their negative impact on the price are still in effect.
Second, size of yesterday’s rebound is tiny compared to the Wednesday’s decline.
Third, the sell signals generated by all daily indicators remain in the card, supporting oil bears and lower prices of crude oil.
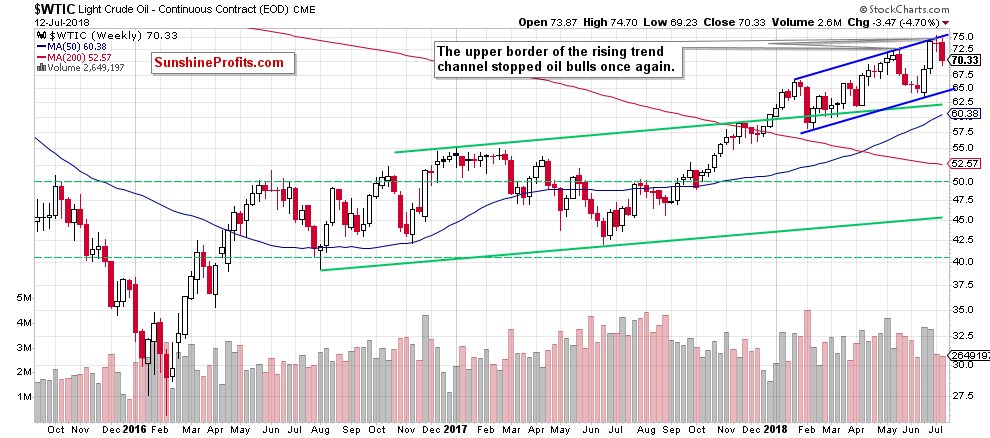
Additionally, when we take a look at the medium-term chart below we can notice one more potential pro-bearish sign.

From this perspective, we see that the recent decline erased most of the gains posted in the last week of June, which could translate into a bearish candlestick formation called an evening star. This pattern is quite often used by investors as an early indication that the uptrend is about to reverse. Therefore, if we see such development later in the day oil bears will receive one more reason to act.
How did this week’s drop affect the long-term picture? Let’s check.

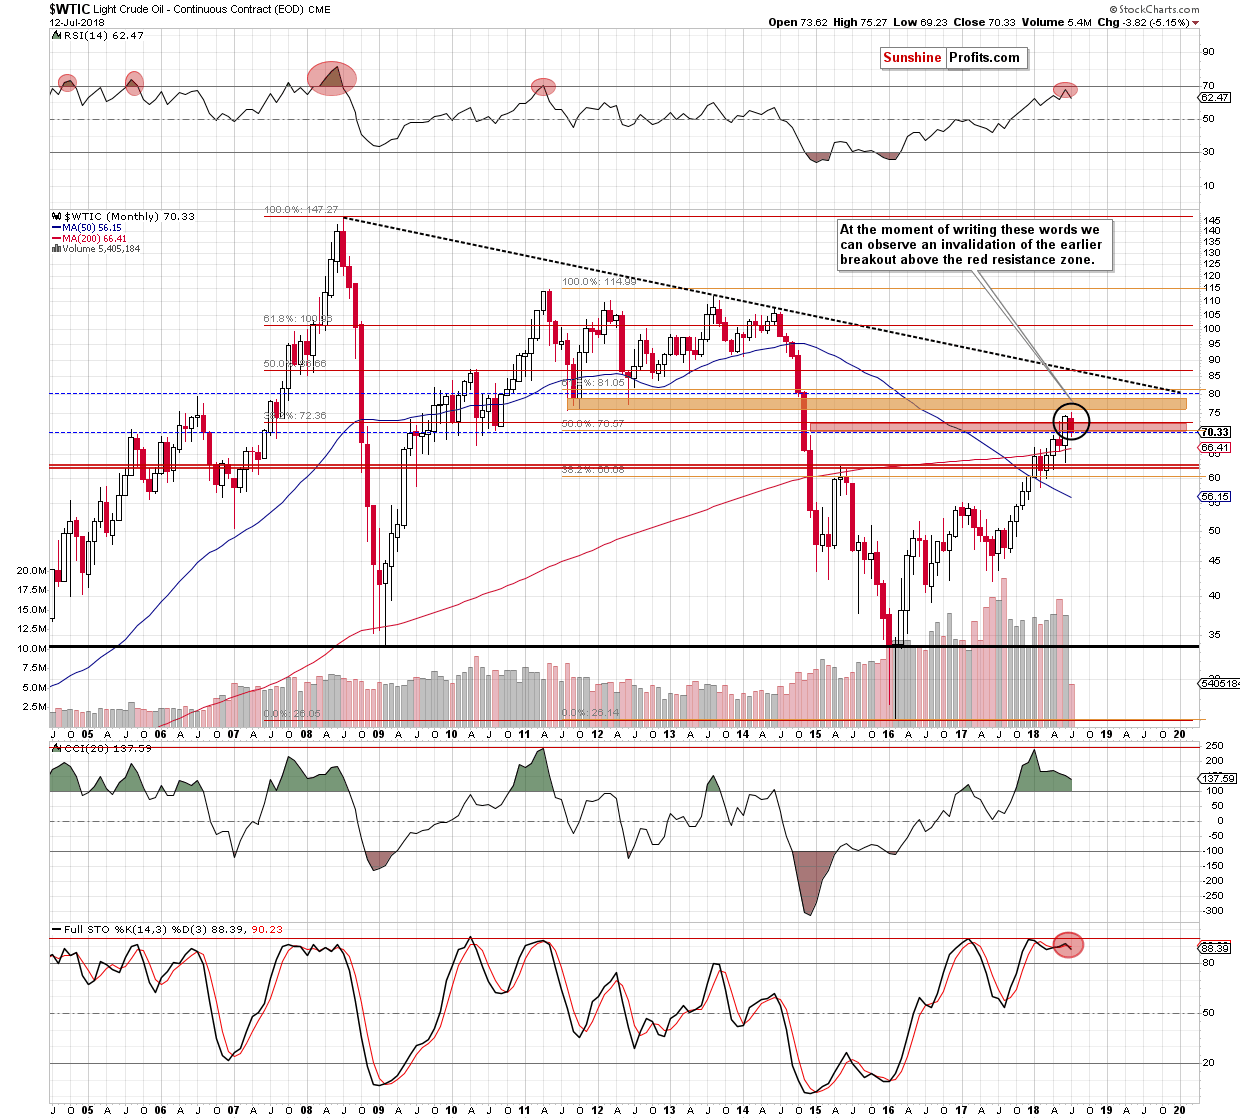
On the monthly chart, we see that thanks to the recent oil bears’ action black gold invalidated the earlier breakout above the red resistance zone, which doesn’t bode well for higher prices of black gold. Nevertheless, this situation will turn into very bearish if we see a monthly closure under the above-mentioned area. Will we such price action?
The current position of the indicators says yes. Looking at the above chart, we see that the RSI reversed to the south after it came close to the level of 70. Last time when we saw the indicator at similar levels took place in April 2011 (we marked it with the red ellipse). What happened then? As you see, such high reading of the indicator preceded a sizable move to the downside, which increases the probability that we’ll see something similar in the following month(s).
Additionally, the Stochastic Oscillator generated a sell signal, supporting the sellers and suggesting that the move to the downside is not over yet.
And speaking about the time… let’s take a look at the monthly chart once again, but from a bit different point of view.

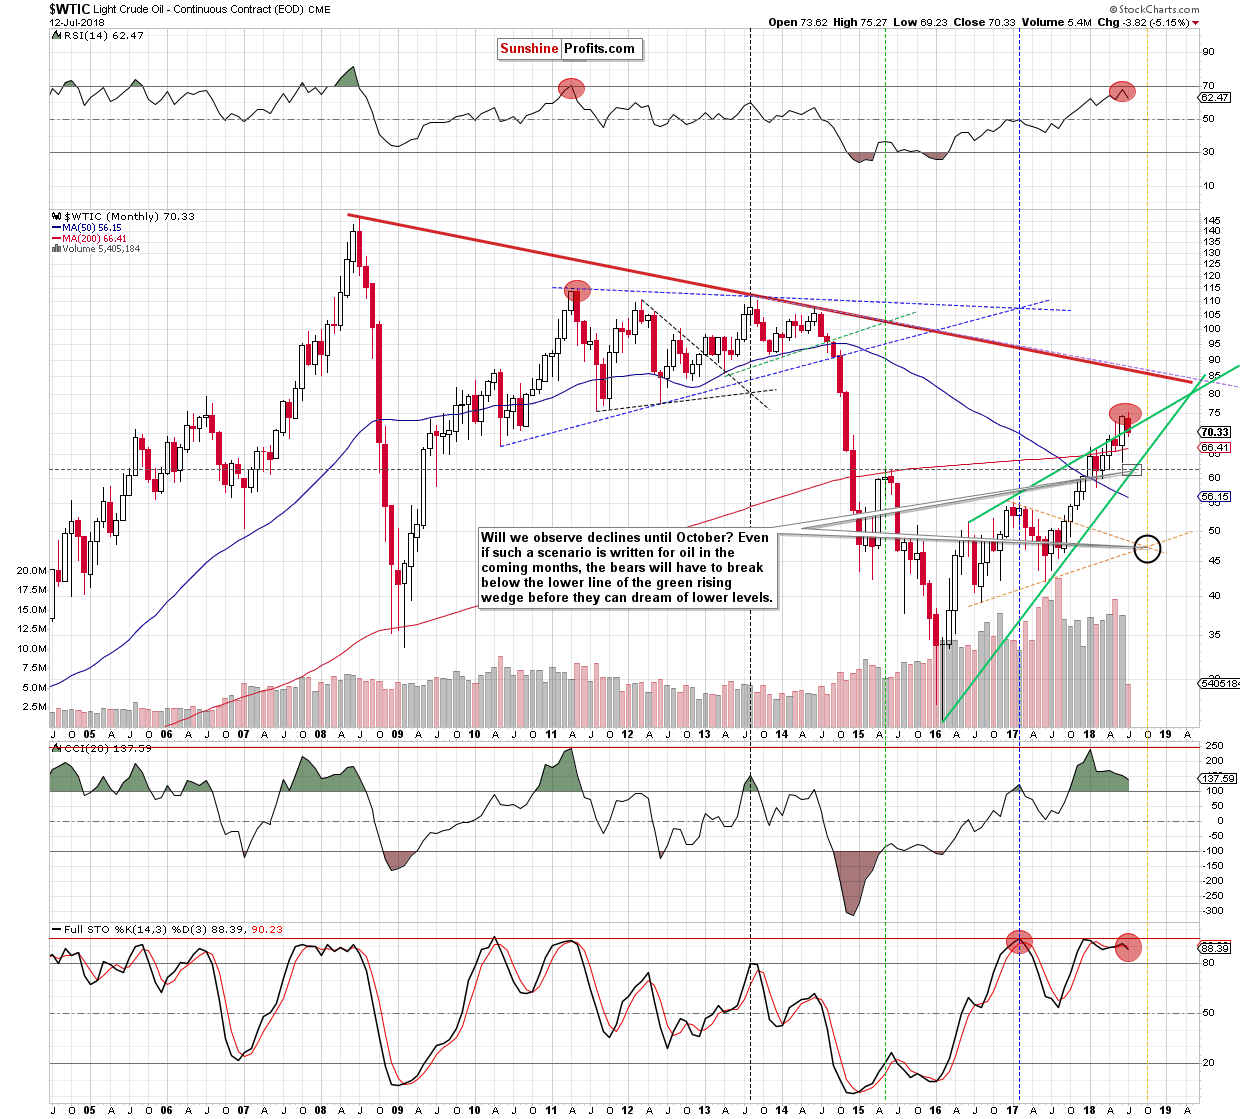
From this perspective, we see that recent move to the downside took crude oil (at least at the moment of writing this alert) below the upper border of the long-term green rising wedge, which looks pretty gloomy - especially if you are currently a fan of further growth in black gold.
If the commodity extends looses from here and closes July under this important resistance line, we could even see a test of the lower border of the formation in the following months (currently around $62). What’s interesting, if oil bears manage to break below it, the way to lower prices will be open.
How long can the journey to the south take?
Based on the triangles that are visible in the above chart and places of intersection of their arms, it seems to us that black gold could decline even to the beginning of October. Why so long? Because at the turn of September 2018 and October 2018 we’ll see an intersection of the resistance line based on January 2017 and March 2017 highs and the support line based on the August 2016 and June 2017 lows (the upper and the lower borders of the yellow triangle marked with dashed lines).
Are the places of such intersections reliable?
Looking at the long-term chart, we clearly see that many times in the past they were able to trigger reversals, which means that we should be more vigilant than usual at the turn of September and October (if you were reading about the meaning of the above-mentioned intersections, we encourage you to read more about this topic in our dictionary: Triangle Apex Reversal Pattern).
On top of that, the pro-bearish scenario is also reinforced by the overall situation in all our interesting ratios about which we wrote in our recent alerts (the oil-to-gold, the oil-to-silver and the oil-to-stocks ratios) and the current relationship between crude oil and platinum about which you could read for the first time ever yesterday:
Black Gold – Platinum Link
Finishing today’s Oil Trading Alert please note that all the above suggests that crude oil will likely drop to around $65 and test lower borders of the rising trend channels in the following days (we marked this area with the black ellipse on the daily chart).
Summing up, already profitable short positions continue to be justified from the risk/reward perspective as crude oil remains under many important resistances, which in combination with the sell signals generated by the indicators, all negative factors about which we wrote in our previous alerts and a very pro-bearish picture that emerges from the oil-to-platinum ratio suggests that further deterioration and lower prices of crude oil are more likely than not in the coming week.
Trading position (short-term; our opinion): Already profitable short positions with a stop-loss order at $77.44 and the initial downside target at $67.95 are justified from the risk/reward perspective. We will keep you informed should anything change, or should we see a confirmation/invalidation of the above.
Thank you.
Nadia Simmons
Forex & Oil Trading Strategist
Przemyslaw Radomski, CFA
Founder, Editor-in-chief, Gold & Silver Fund Manager
Gold & Silver Trading Alerts
Forex Trading Alerts
Oil Investment Updates
Oil Trading Alerts


