Trading position (short-term; our opinion): Short positions (with a stop-loss order at $52.52 and the initial downside target at $45.80) are justified from the risk/reward perspective.
On Monday, crude oil lost 2.72% as Tropical Storm Harvey caused the closure of the refineries in the Gulf of Mexico region, which raised fears of an increase in crude oil inventories. In this environment, light crude hit a fresh August low and closed the day below $47, breaking below two supports. What does it mean for the black gold?
Crude Oil’s Technical Picture
Let’s take a closer look at the charts and find out (charts courtesy of http://stockcharts.com).

Quoting our yesterday’s Oil Trading Alert:
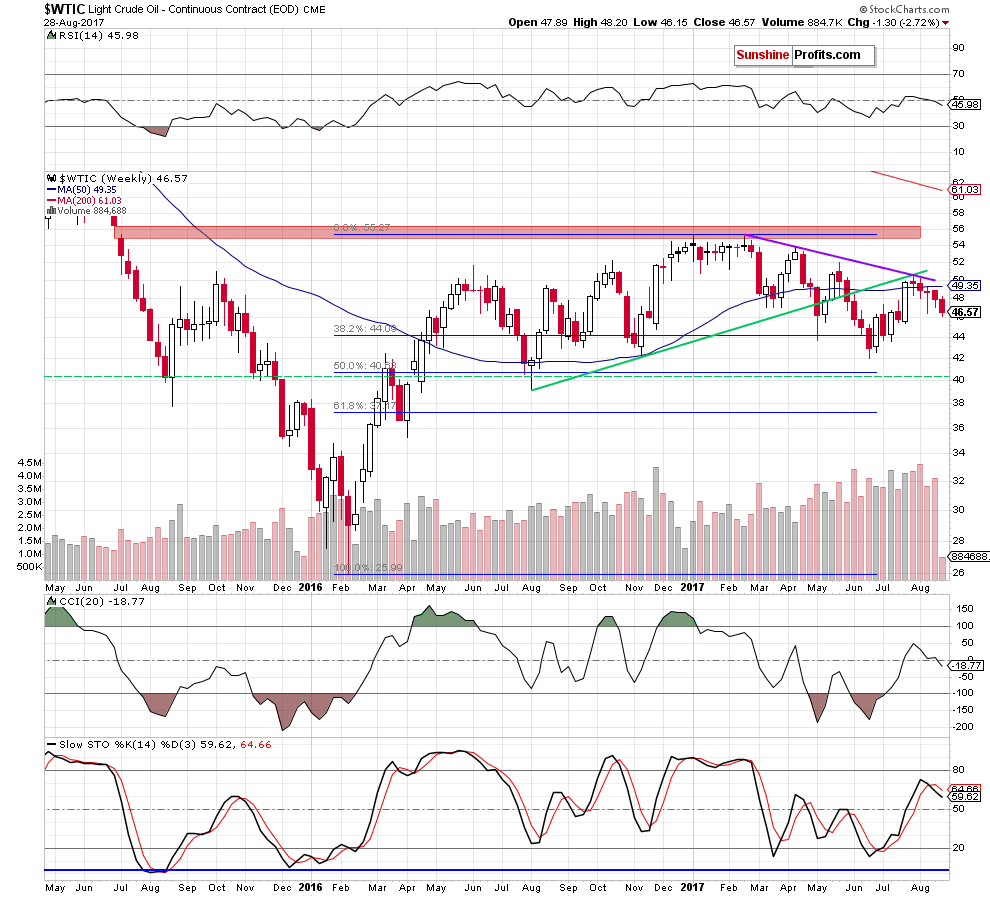
(…) crude oil remains under the green and purple resistance lines. Additionally, the black gold closed another week under the previously-broken 50-week moving average, increasing the probability of further declines. This pro bearish scenario is also reinforced by the sell signal generated by the Stochastic Oscillator and the size of volume, which accompanied last week’s drop (it was visibly higher than a week earlier, which confirms oil bears’ strength).
Looking at the weekly chart, we see that oil bears took advantage of the above-mentioned negative factors and pushed the price of light crude lower at the beginning of this week. As a result, crude oil hit a fresh August low, making our short positions even more profitable (as a reminder, we opened them on July 31, when the commodity was trading around $50).
What impact did this drop have on the very short-term chart? Let’s check.

Yesterday, we wrote the following:
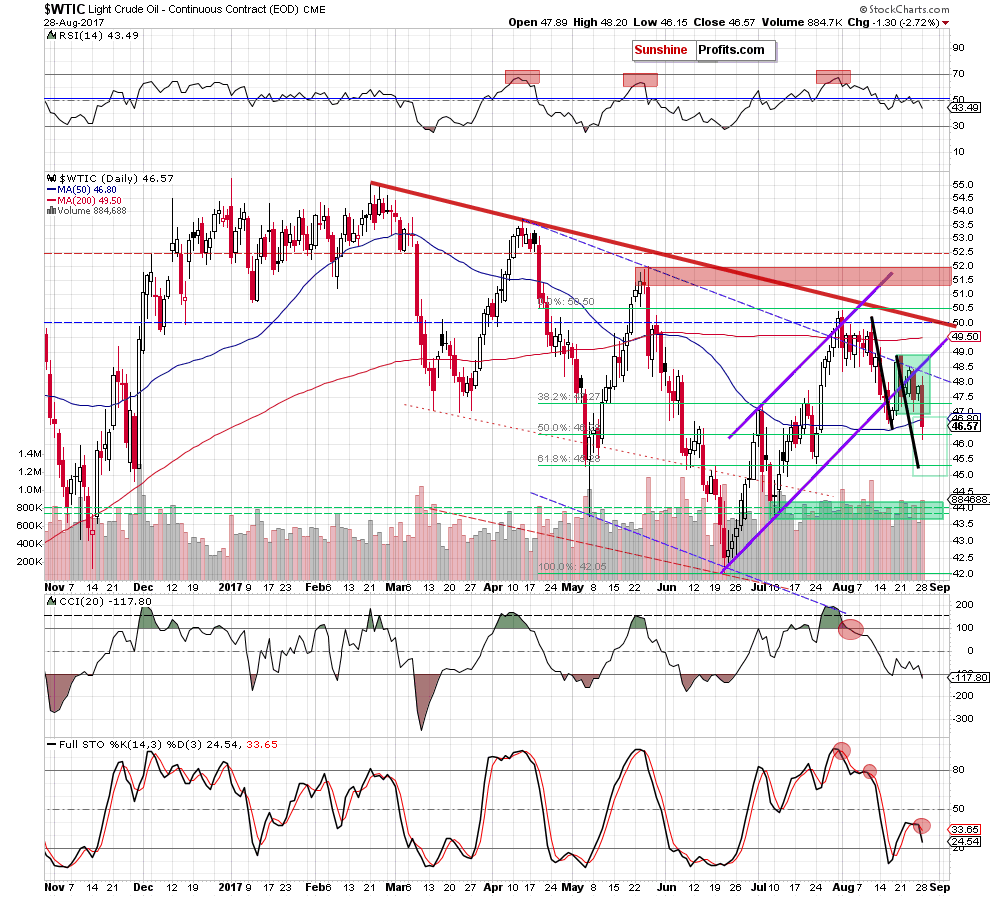
(…) crude oil moved a bit higher on Friday, but did this increase change anything in the overall picture of light crude? In our opinion, it didn’t. Why? (…) oil bulls didn’t even manage to push the price of crude oil to the lower border of the purple rising trend channel, which is a sign of weakness.
Additionally, the size of volume which accompanied Friday’s upswing was much smaller (compared to the volume during Thursday’s decline), which increases the probability of another reversal – similarly to what we saw in the recent weeks.
On top of that, the sell signal generated by the Stochastic Oscillator remain in place and light crude is still trading below the lower border of the purple rising trend channel, which means that an invalidation of the breakout above this line and its potential negative impact on the price are still in effect, supporting oil bears and another attempt to move lower in the coming days.
How low could the commodity go (…)?
We believe that the best answer to this question will be the quote from our Wednesday’s Oil Trading Alert:
(…) In our opinion, if crude oil declines from current levels, the first downside target will be the recent low, the 50-day moving average and the 50% Fibonacci retracement (around $46.32-$46.60).
From today’s point of view, we see that the situation developed in line with the above scenario and crude oil extended losses. As you see on the daily chart, although the black gold moved a bit higher after the market open yesterday, oil bulls didn’t manage to push the commodity even to the previously-broken lower border of the trend channel, which showed their weakness once again.
As a result, their opponents took control and pushed the price of light crude sharply lower, breaking below the lower border of the green consolidation and the 50-day moving average. Thanks to yesterday’s drop the commodity also tested the 50% Fibonacci retracement, but then rebounded slightly and closed the day above it.
Will we see further deterioration in the coming days?
In our opinion, although crude oil invalidated the tiny breakdown under the above-mentioned Fibonacci retracement, the next move to the downside is still ahead of us.
Why? Firstly, crude oil broke below the lower border of the green consolidation, which opened the way to around $45, where the size of the move will correspond to the height of the formation. Secondly, the commodity closed the day under the 50-day moving average, which invalidated the earlier breakout above it. Thirdly, when we take a closer look at the daily chart, we notice that slightly below our next downside targets (the late July low of $45.40 and the 61.8% Fibonacci retracement) the size of the current downward move will be equal to the downswing, which we saw between August 10 and August 17 (both moved we marked with the black line).
Additionally, yesterday’s downswing materialized on significant volume, which confirms oil bears’ strength and the direction of the current trend. On top of that, the Stochastic Oscillator re-generated the sell signal, giving oil bears another reason to act in the following days.
Summing up, profitable short positions continue to be justified from the risk/reward perspective as crude oil extended losses, hitting a fresh August low and breaking below the lower border of the green consolidation and the 50-day moving average. Additionally, the size of volume was significant yesterday, which increases the probability of another move to the downside in the coming days.
Very short-term outlook: bearish
Short-term outlook: bearish
MT outlook: mixed
LT outlook: mixed
Trading position (short-term; our opinion): Short positions with a stop-loss order at $52.52 and the initial downside target at $45.80 are justified from the risk/reward perspective. We will keep you informed should anything change, or should we see a confirmation/invalidation of the above.
As a reminder – “initial target price” means exactly that – an “initial” one, it’s not a price level at which we suggest closing positions. If this becomes the case (like it did in the previous trade) we will refer to these levels as levels of exit orders (exactly as we’ve done previously). Stop-loss levels, however, are naturally not “initial”, but something that, in our opinion, might be entered as an order.
Thank you.
Nadia Simmons
Forex & Oil Trading Strategist
Przemyslaw Radomski, CFA
Founder, Editor-in-chief, Gold & Silver Fund Manager
Gold & Silver Trading Alerts
Forex Trading Alerts
Oil Investment Updates
Oil Trading Alerts


