

Trading position (short-term; our opinion): No positions are justified from the risk/reward perspective.
Good days, bad days, declines, increases ... and the oil market life goes on. Looking at yesterday’s price action, we can summarize it one statement: Tuesday’s session belonged to oil bulls, who dictated conditions of the game almost from the beginning until the end of the day. Thanks to their determination black gold returned above the level of $ 70 with the major question: will we see higher prices of light crude in the coming days? What do we think about this question? We invite you to read today's alert.
Let’s take a closer look at the charts below (charts courtesy of http://stockcharts.com).
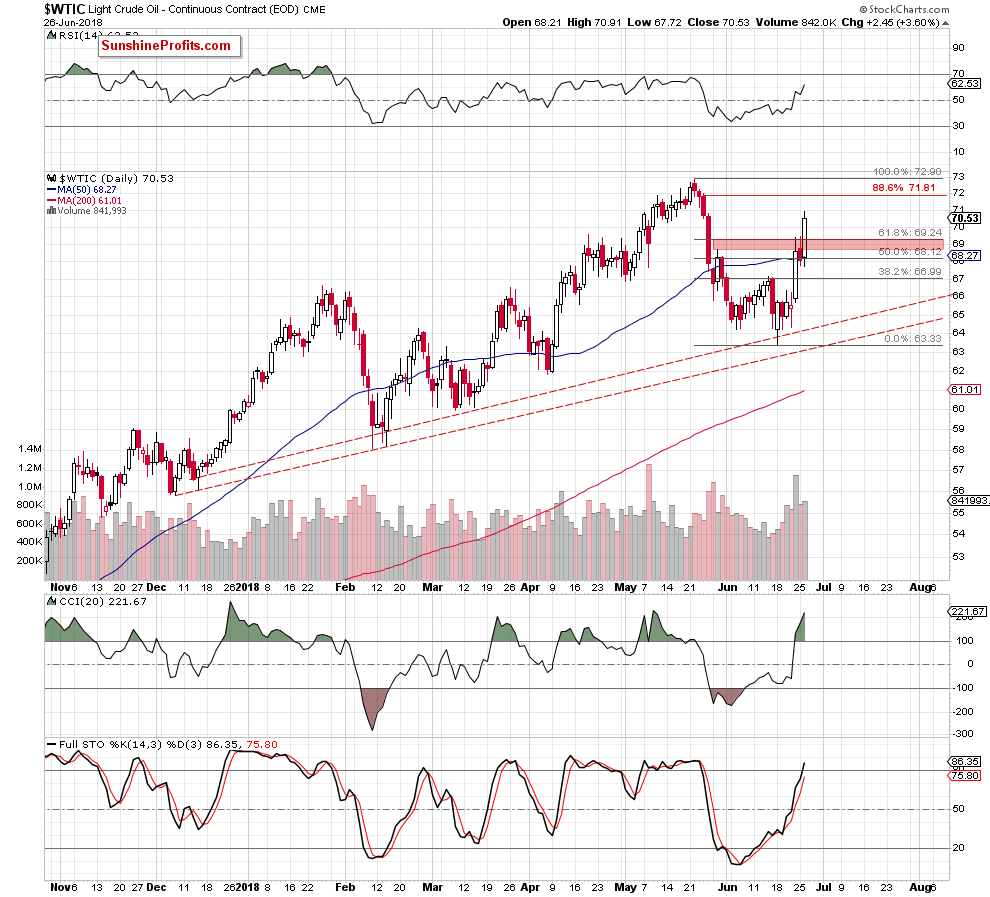
Looking at the daily chart, we see that despite a slight decrease just after the opening of yesterday's session, the comeback above the 50-day moving average and 50% Fibonacci retracement encouraged the buyers to fight for higher levels.
From today’s point of view, we can say: third time lucky, because this time the red resistance zone was broken, and the price of oil went above $ 70. The rest of the day also belonged to the bulls and the commodity climbed up to an intraday high of $70.91.
Unfortunately thanks to this price action our short position was closed. Unlike previously several positions, this one was closed at a loss. Yet, it doesn’t seem that it changes the medium-term or the long-term outlook and it’s likely that we’ll be able to get back the capital on the next short position, when black gold moves lower again, erasing all the recent gains.
Why do we suppose that the price of crude oil will turn back to the south? We think that the best answer to this question will be the monthly chart below. Let's take a look.
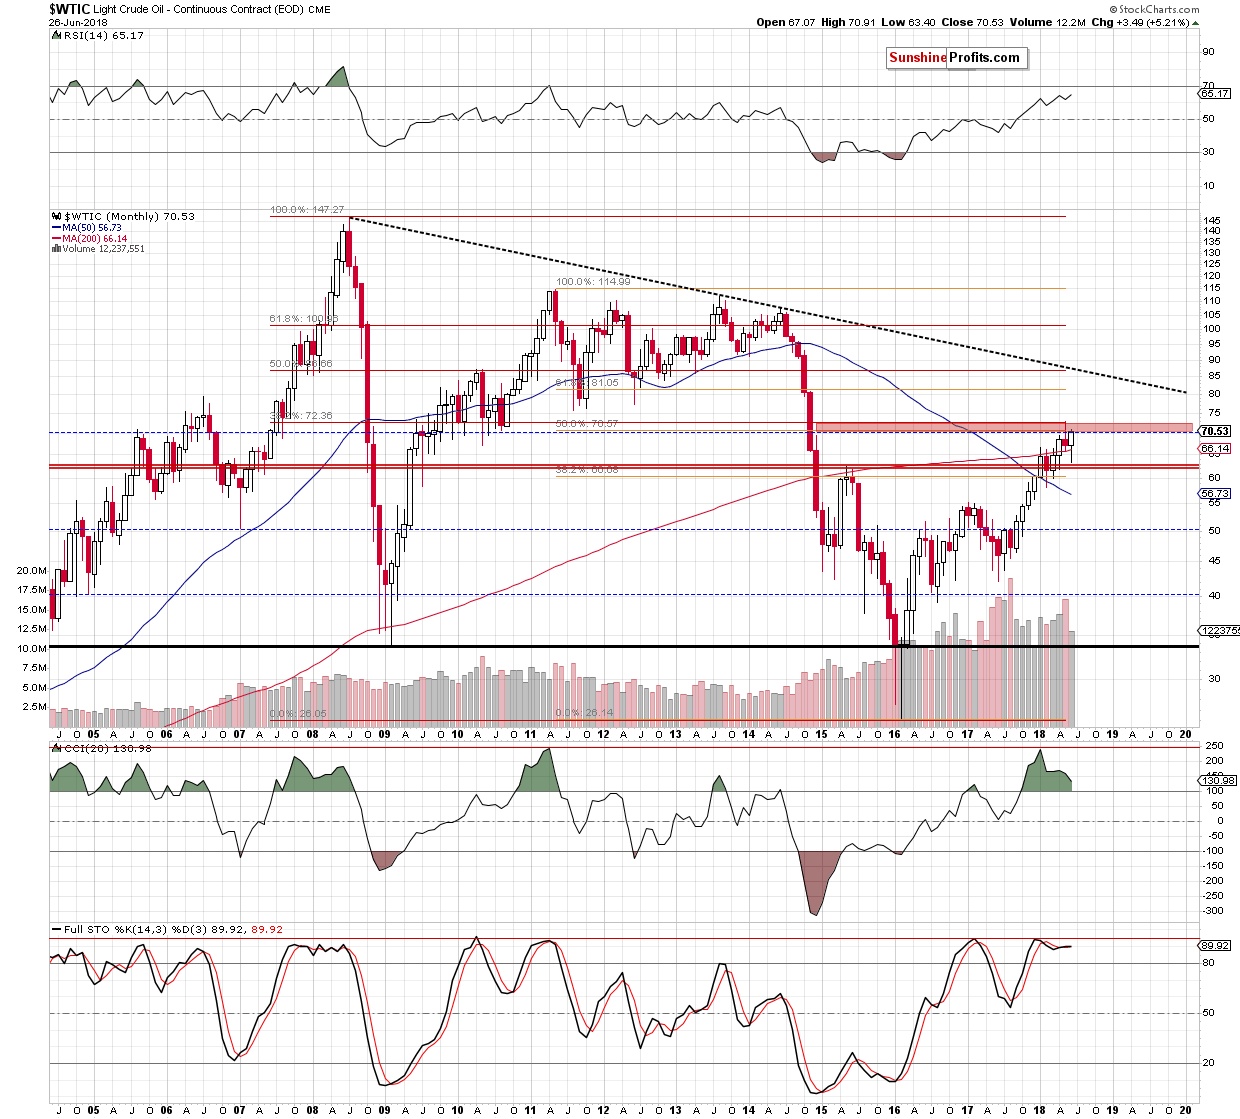
From this perspective, we see that the current situation in crude oil hasn’t changed as much as it might seem at the first sight, because light crude is still trading under the major resistance zone (marked with red) created by two very important Fibonacci retracements: the 38.2% retracement based on the entire 2008-2016 downward move and the 50% retracement based on the 2011-2016 declines.
As you see this area was strong enough to stop further improvements in the previous month, which together with the current position of the long-term indicators increases the probability that another bigger move will be to the downside – even if we see one more upswing and a test of the 88.6% Fibonacci retracement seen on the daily chart (around $71.81) or even last month’s peaks first.
Summing up, the very short-term picture of crude oil improved significantly as the commodity broke above the red resistance zone created by the 61.8% Fibonacci retracement and the May 30 high. Additionally, the buy signals generated by the daily indicators remain in the card, suggesting a test of the 88.6% Fibonacci retracement (around $71.81) or even last month’s peaks in the coming days. Nevertheless, we believe that as long as there is no breakout above the major resistance zone marked on the long-term chart fresh peaks in black gold are doubtful.
Trading position (short-term; our opinion): No positions are justified from the risk/reward perspective. Due to the short-term upside potential of crude oil it seems that closing any remaining positions (for instance, if the stop-loss order was not placed for this trade) is justified from the risk to reward point of view.
Thank you.
Nadia Simmons
Forex & Oil Trading Strategist
Przemyslaw Radomski, CFA
Founder, Editor-in-chief, Gold & Silver Fund Manager
Gold & Silver Trading Alerts
Forex Trading Alerts
Oil Investment Updates
Oil Trading Alerts

