Trading position (short-term; our opinion): Short positions with a stop-loss order at $74.06 and the initial downside target at $65.70 are justified from the risk/reward perspective.
In the previous alert, we explained how the situation became clearly bearish and how the top formed right at the apex-based turning point. We didn’t have to wait long for the market to agree with us. The short positions that we had opened before the US session, became profitable practically instantly, and the profits on them are increasing also today. How low can the black gold slide before bottom is reached?
Let's take a closer look at the charts below charts courtesy of http://stockcharts.com).

In the previous alert, we wrote the following:
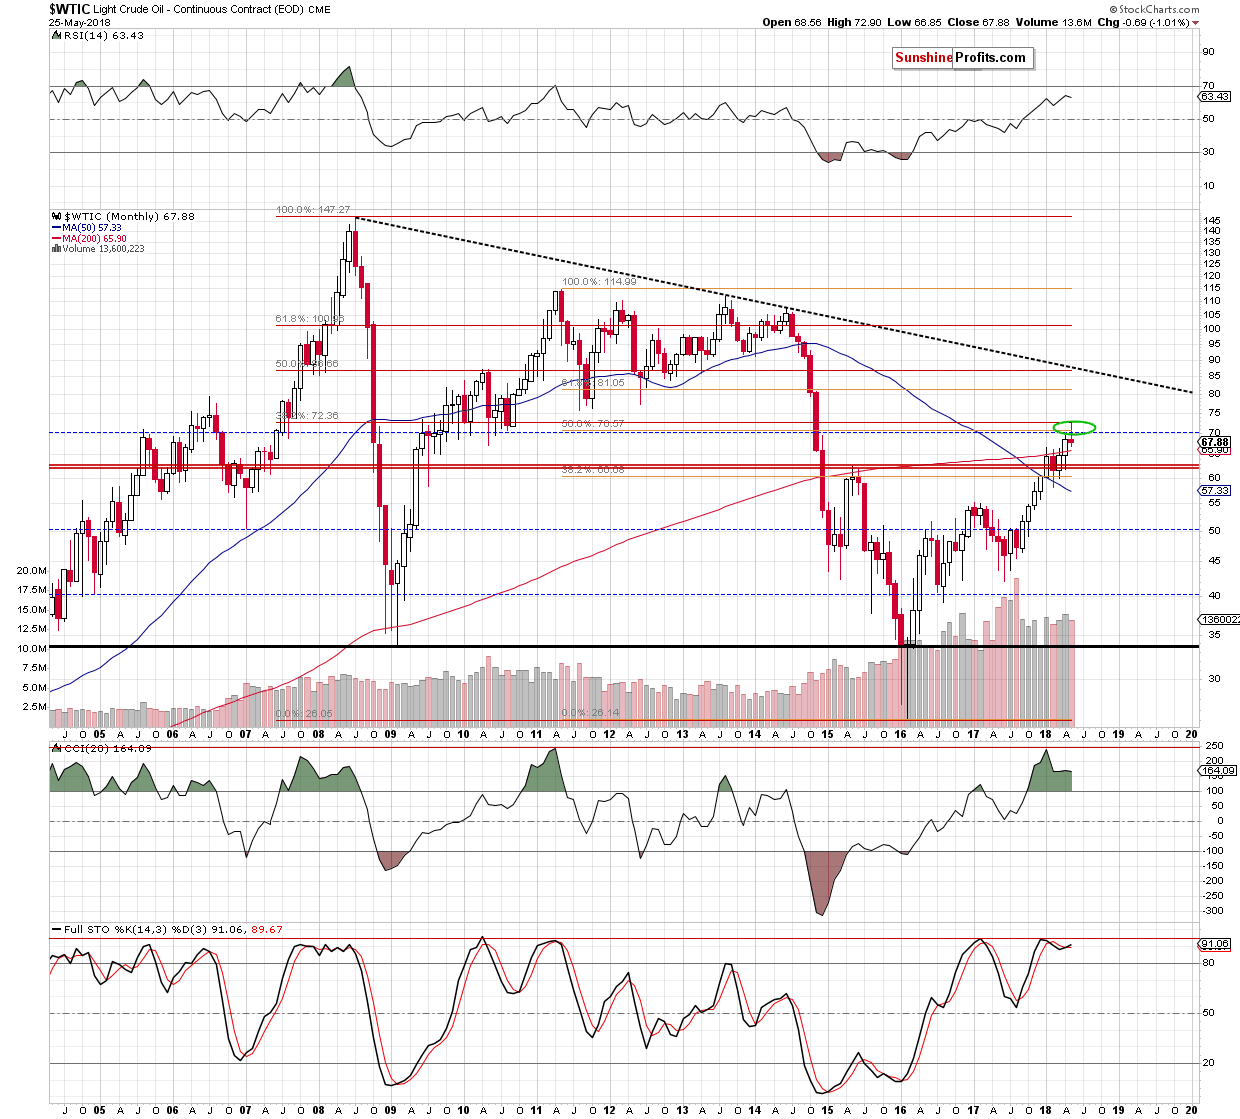
On the above chart we see that the price of crude oil has recently reached an important, long-term resistance area that we had marked with the green area in the previous analyses. It’s based on two important resistance levels. The first is the 50% Fibonacci retracement based on the 2011-2016 downward move and the second one is the 38.2% Fibonacci retracement based on the entire 2008-2016 decline.
Since the above-mentioned resistance levels were breached temporarily and both breakouts were invalidated (crude oil is below the 50% retracement at the moment of writing these words), the implications for the following weeks appear bearish. The confirmations that we meant previously, come mostly from the short-term charts though.
The above remains up-to-date, but we would like to add that at this time, May is already a down month for crude oil and – in light of today’s decline – it seems likely that it will end the month in the red. The implications would be very bearish for the following weeks as that would mean that we’ll going to see a monthly shooting star reversal candlestick.
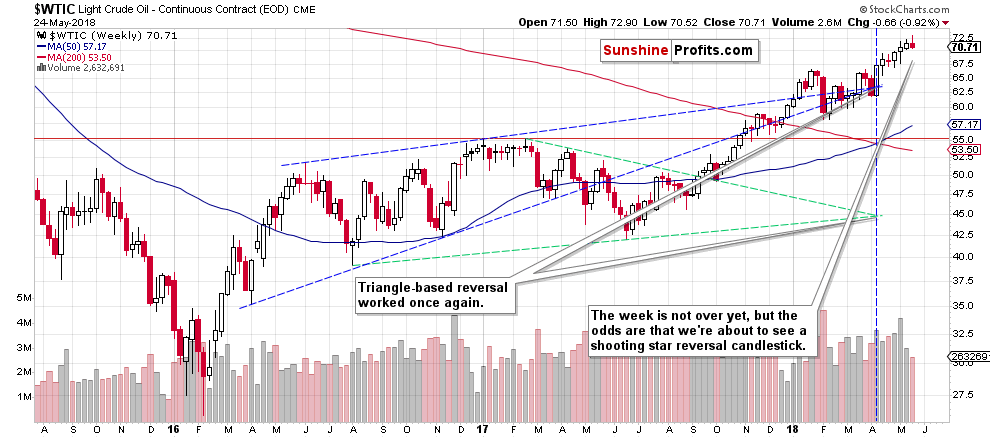
The month is not over, but it’s quite close to be over, so it already makes sense to discuss the above. It’s just like what we discussed previously with regard to the weekly shooting star candlestick:

That’s the chart that we described on Friday in the following way:
Finally, looking at the weekly candlesticks also points to a possible (!) bearish signal. We would like to emphasize that we are aware that no pattern is really useful before it is completed and while this is definitely the case with price formations like head and shoulders, as far as weekly candlesticks are concerned, we might already have some insight. The reason is that while a breakout or breakdown below a certain formation is critical as it demonstrates the strength of the market and without it, there are virtually no implications, the same doesn’t apply to candlesticks – at least not in the same way.
At this time 80% of this week’s trading is over and we know that crude oil moved $0.45 lower in today’s overnight trading. We also know that the volume is almost as high as last week even though we have volume data from only 4 trading days. This gives us good probability that the price of black gold will not end the week above $71.4 and if it closes below it, we will have a quite clear bearish reversal weekly candlestick that will likely be confirmed by significant volume. So, while the weekly reversal was not yet complete, we have a good chance of it being complete, so the implications are already somewhat bearish. Naturally, a somewhat bearish sign is not enough to justify changing the outlook on its own, but in this case it’s only something that confirms other - much clearer - signs.
Again, it doesn’t work in the same way with formations as whether the breakout is in or not is critical, and before it is seen, the formation could have entirely different implications than after it.
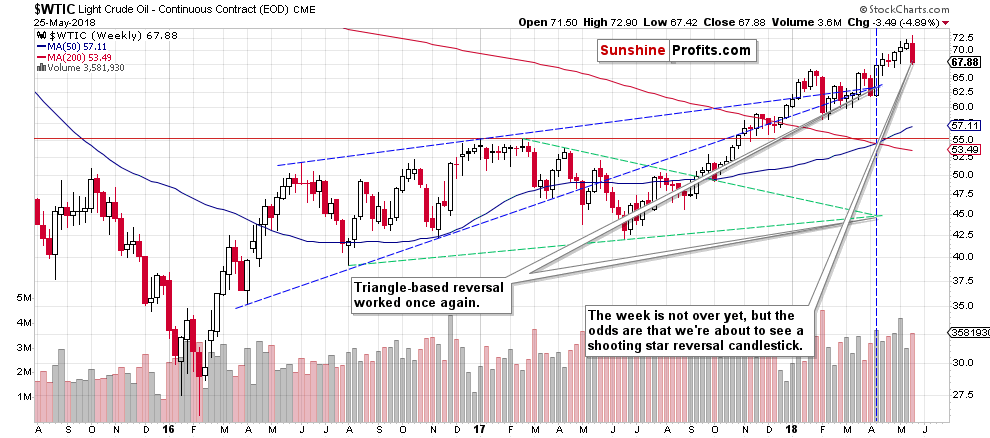
That’s the chart that we have right now:

The week did end in red and the reversal is clear and significant. The implications are clearly bearish. Something analogous could be seen in case of the monthly candlestick and if it happens, it will make the bearish outlook, a very bearish one.

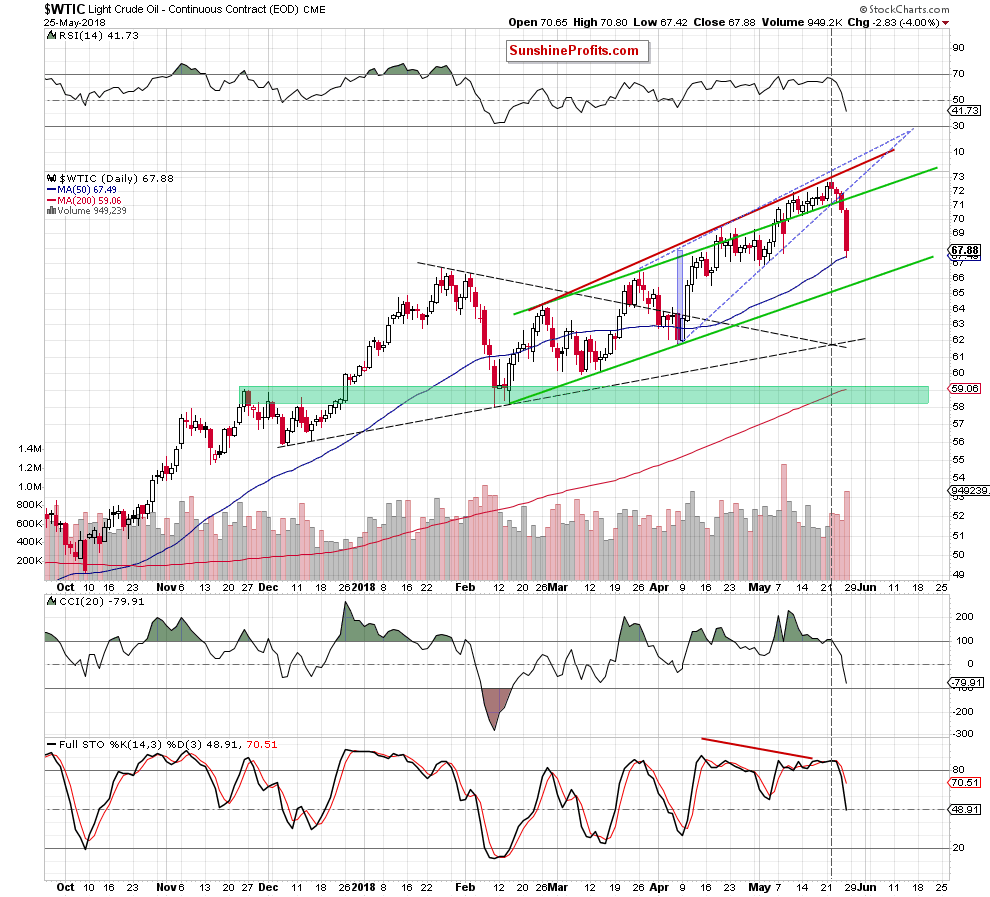
On the short-term chart, we see that crude oil declined substantially on huge volume. What we don’t see is that the decline continues also today – at the moment of writing these words, crude oil is trading at about $67. The breakdown below the rising wedge pattern and below the upper border of the green channel resulted in an additional decline, just like it was likely to. Moreover, since the top took place right at the triangle-apex-based reversal the entire move was believable.
Now, the question is where does crude oil go from here, as what was about to happen based on the reversal, seems to have happened. Precisely, the reversal doesn’t inform us how low the price is going to go, only that the trend is about to reverse.
In short, the price of any given asset is likely to move in a given direction until it reaches either a reasonable support or resistance. Crude oil is declining, so it is a meaningful support that we should focus on. In case of crude oil, the nearest one is created by the lower border of the rising trend channel (marked with green). It’s currently at about $65.70, so the price of black gold is likely to move at least to this level. Still, it doesn’t seem very likely that the entire downswing will end at that price. After all, we have just seen a major weekly reversal and are likely to see a monthly reversal shortly. These are both signs pointing to lower crude oil prices in the upcoming weeks, not just days.
Summing up, the outlook for the crude oil remains bearish and it seems that we’ll see even lower prices in the coming weeks. In other words, it seems that the profits from the current short position will increase further.
Trading position (short-term; our opinion): Short positions with a stop-loss order at $74.06 and the initial downside target at $65.70 are justified from the risk/reward perspective. As always, we’ll keep you - our subscribers - informed should anything change, or should we see a confirmation/invalidation of the above.
Thank you.
Nadia Simmons
Forex & Oil Trading Strategist
Przemyslaw Radomski, CFA
Founder, Editor-in-chief, Gold & Silver Fund Manager
Gold & Silver Trading Alerts
Forex Trading Alerts
Oil Investment Updates
Oil Trading Alerts


