

Trading position (short-term; our opinion): Small (half of the regular size) short positions (with a stop-loss order at $61.13 and the initial downside target at $52) are justified from the risk/reward perspective.
Crude oil’s price reversed yesterday in a quite visible manner and the daily volume was highest in 2 months. Have we just seen a top?
Let’s jump right into charts (charts courtesy of http://stockcharts.com).
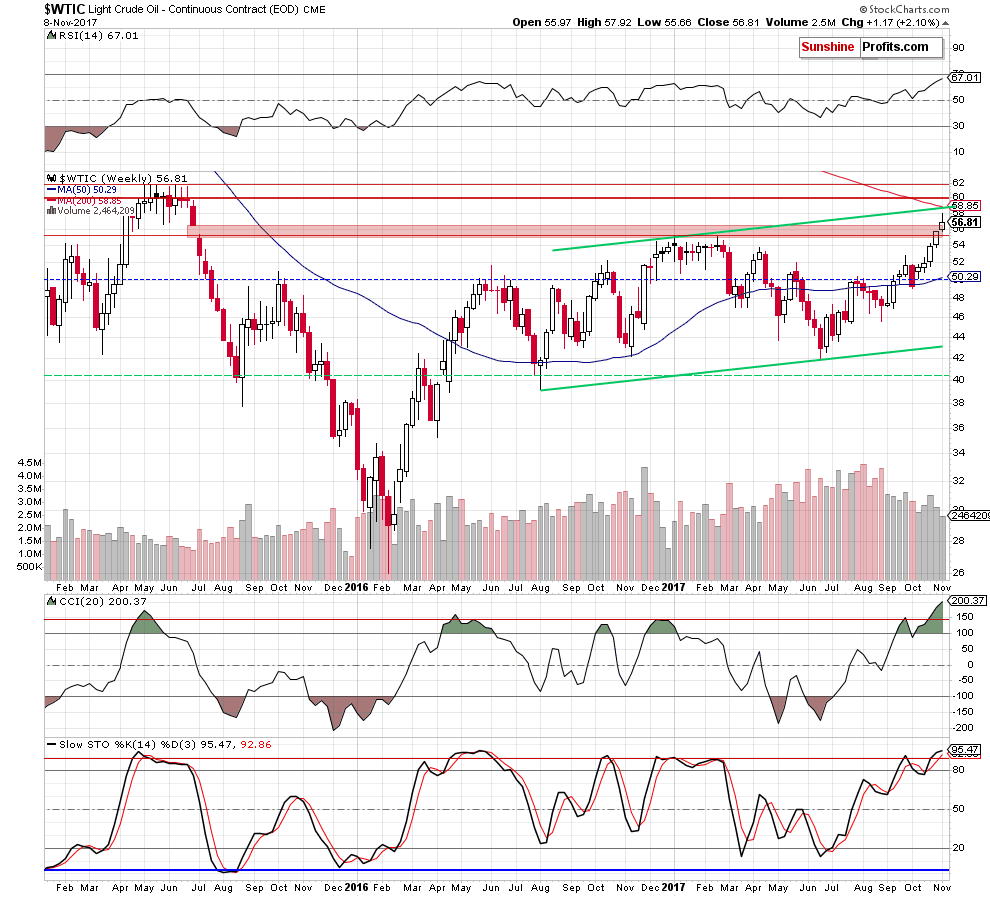
From the weekly point of view, nothing really changed as crude oil didn’t close back below even the higher border of the price gap and our yesterday’s comments remain up-to-date:
The mentioned price gap is marked with the red rectangle and it’s clearly visible that the price of crude oil closed above it. This makes higher prices much more likely in the short term. So, the question becomes, what’s the next stop and will it be the final one for some time (in terms of months). There are a few candidates for the next turnaround price and they are all close to the $60 level.
The resistance is provided by the upper border of the rising trend channel (marked in green) and the 200-week moving average coincide at about $59. The 2015 highs in terms of weekly closing prices provide the target at about $60 and the same highs, but in intraday terms point to $62 as important resistance.
The long-term chart provides additional details.
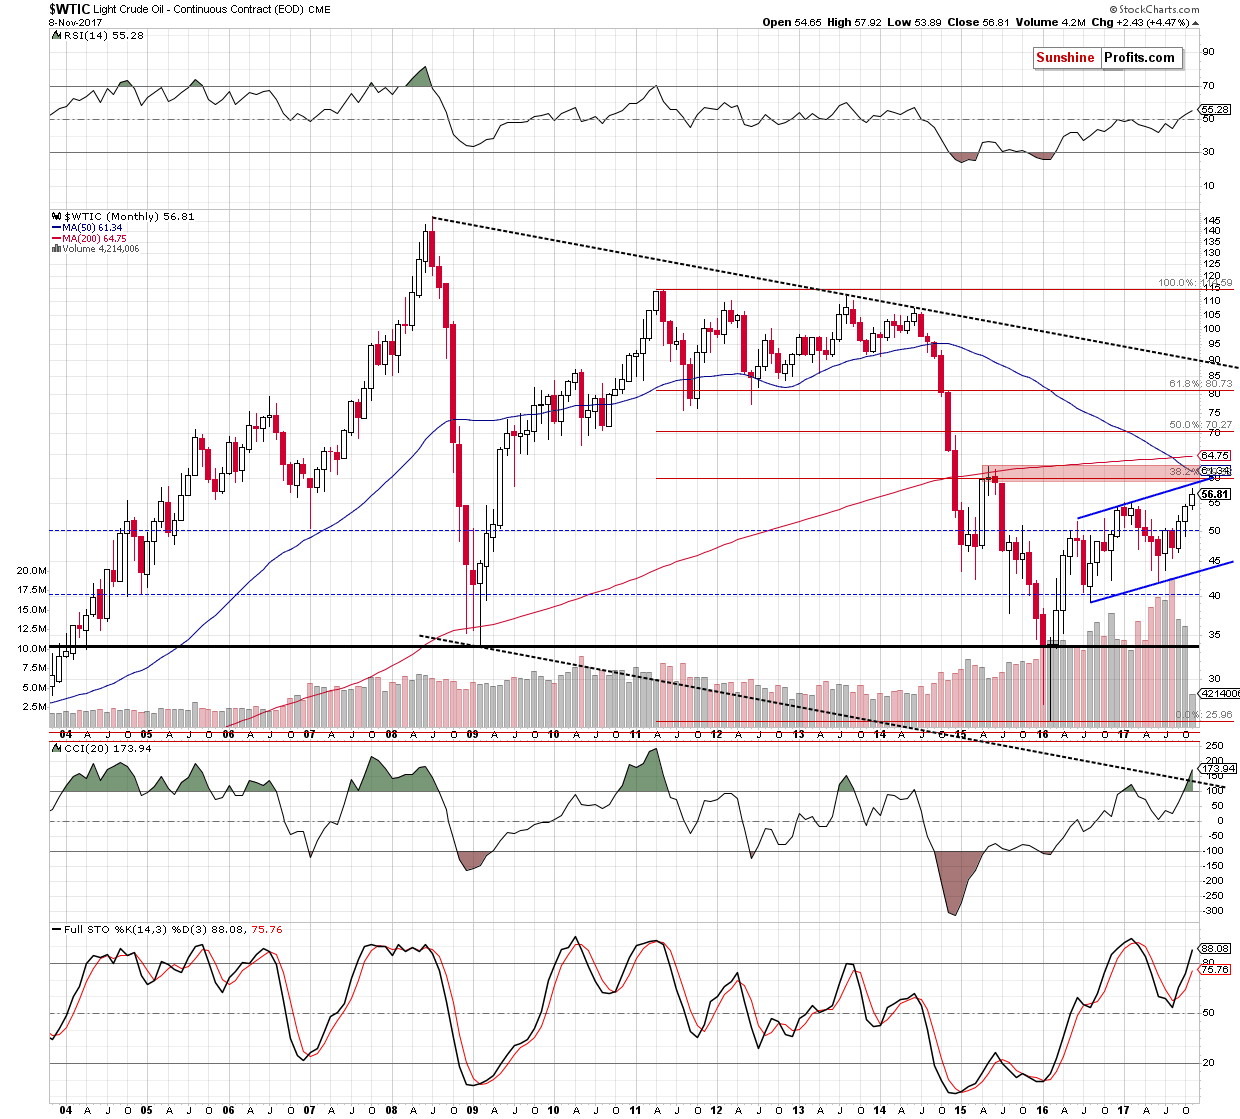
The 2011 is a year that’s important not only for gold investors, but also for crude oil investors and traders as that’s where we saw the second most important top of the past decade. Using this high as a starting point and the early 2016 low as the final point provides us with important (the above extremes are very important, so the techniques based on them are important as well), long-term Fibonacci retracement levels. The first of the classic levels – 38.2% - is just a few dollars above yesterday’s closing price and just a few cents below the $60 level.
But, does crude oil have to rally to the previous highs to reverse? No. In fact, in 2012 and 2013, black gold topped either a bit above or below previous highs – not at them. The first and highest top was the 2011 one at about $115. In 2012, crude oil topped at $110.55 and the 2013 high was $112.24. They were both relatively close to the 2011 top, but the latter wasn’t reached. Interestingly, the early 2013 tops formed very close to the September 2012 top but each of them was $1-$3 below it. So, is it imminent that crude oil would rally to the 2015 high before turning south? No, it’s not.
Naturally, the above is not enough to indicate that the top is in – something else suggests that.
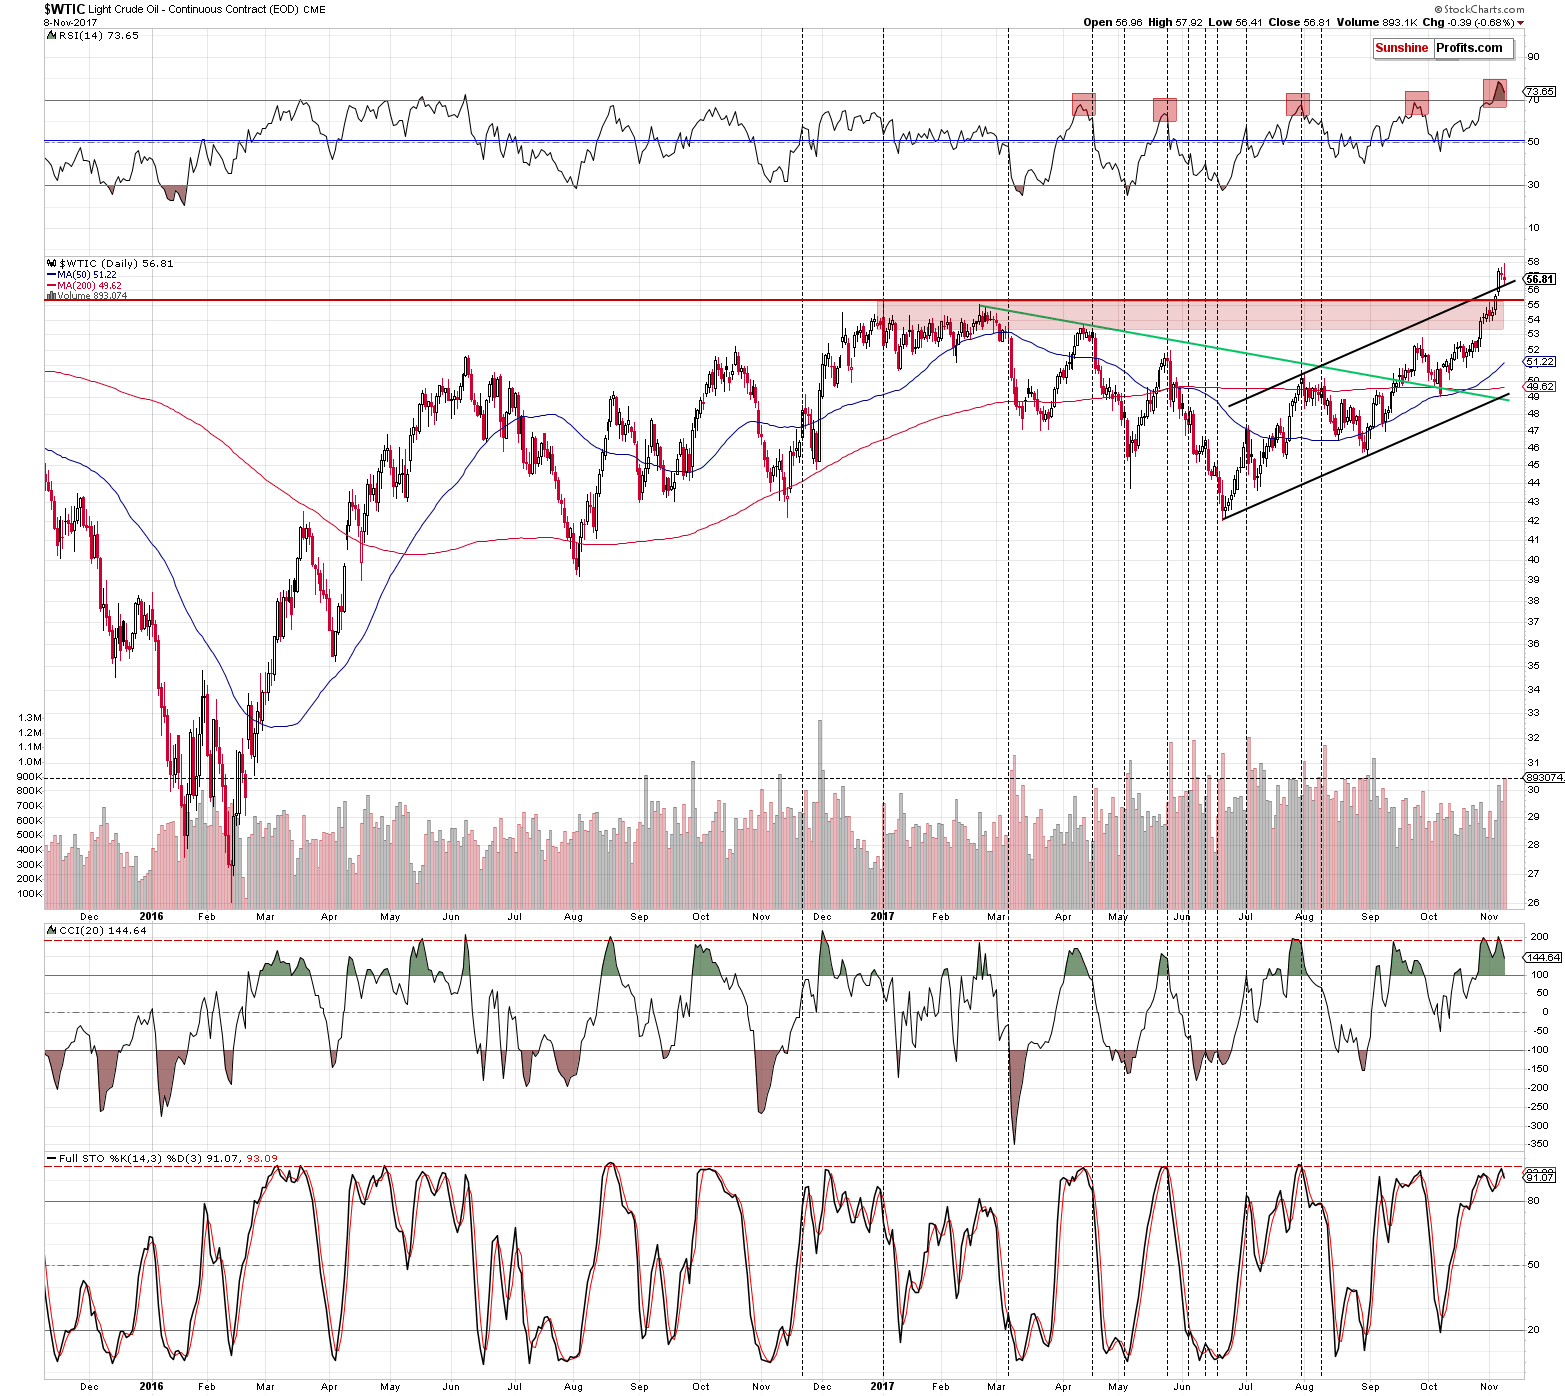
The indicators have been showing that the situation is very overbought for some time now, so that’s not the thing that changed yesterday. The thing that did, was the size of the volume that accompanied crude oil’s breakout above the Monday high and the subsequent invalidation thereof.
Reversals on huge volume are bearish on their own, but in this case, it seems that there is something else that comes into play – the analogy to the previous huge-volume sessions, during which crude oil declined.
We marked the volume level with the horizontal dashed line and we marked the similar sessions with vertical dashed lines. As you can see, practically all similar cases were followed by declines, either immediately or after some time. Given the situation in the indicators and the news-based nature of Monday’s rally it seems that a reversal is more likely than a prolonged consolidation.
Consequently, it seems that small short positions in crude oil are now justified from the risk to reward point of view. Why only small (half of the regular position)? Because, after all, crude oil is still above the rising trend channel and the 2017 highs. Invalidation of this breakout would serve as a bearish confirmation.
Summing up, while it’s still possible that crude oil could move a bit higher before it tops, based on yesterday’s huge-volume reversal, the decline in the short term became much more likely and it seems that it’s likely enough to justify opening small short positions.
Very short-term outlook: bearish
Short-term outlook: mixed with bearish bias
MT outlook: mixed with bearish bias
LT outlook: mixed
Trading position (short-term; our opinion): Small (half of the regular size) short positions (with a stop-loss order at $61.13 and the initial downside target at $52) are justified from the risk/reward perspective. We will keep you – our subscribers – informed should anything change.
Thank you.
Nadia Simmons
Forex & Oil Trading Strategist
Przemyslaw Radomski, CFA
Founder, Editor-in-chief, Gold & Silver Fund Manager
Gold & Silver Trading Alerts
Forex Trading Alerts
Oil Investment Updates
Oil Trading Alerts

