

Please note that due to market volatility, some of the key levels may have already been reached and scenarios played out.
Trading positions
- Natural Gas [NGJ22]
No new position justified on a risk/reward point of view. - RBOB Gasoline [RBJ22]
No new position justified on a risk/reward point of view. - Brent Crude Oil [BRNJ22]
Long around the $ 93.36-95.01 support area (yellow band) with a stop at 89.92 and targets at 99.50 and 101.99. - WTI Crude Oil [CLJ22]
Long around the $ 89.54-90.45 support area (yellow band) with a stop at 87.06 and targets at 93.83, 95.64 and 99.10.
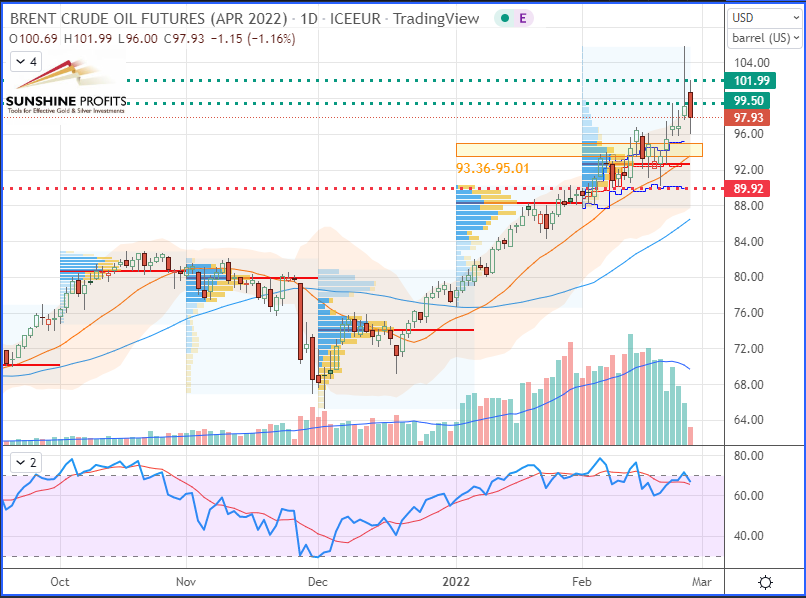 Brent Crude Oil (BRNJ22) Futures (April contract, daily chart)
 WTI Crude Oil (CLJ22) Futures (April contract, daily chart)
Regarding risk management, it is always best to define your strategy according to your own risk profile. For some guidance on trade management, read my article on how to secure profits.
After witnessing crude oil prices slipping on Friday (Feb. 25) – as some major players sold off their positions before the weekend, which was still marked by a context of uncertainty regarding the evolution of the current Ukraine-Russia conflict – lots of concerns remain over potential global supply disruptions from a strengtening set of sanctions on major crude exporting country Russia.
The sanction that is likely to impact the Russian bear the most in the long term was taken by Taiwan in the weekend (under rising pressure from the West) to block the sales of electronic microchips to the Russian Federation.
OPEC+ will meet this Wednesday (Mar. 2) during a surge in the two black gold benchmarks, with little hope, however, that their action will dissipate the feverishness of the energy markets.
British oil giant BP’s shares fell by nearly 7% this morning on the London Stock Exchange, the day after the announcement of its divestiture from the Russian giant Rosneft, in which it held a 19.75% stake.
Technically, the sturdiest support seems to be located around the $93.36-95.01 area for Brent and around the $89.54-90.45 area for the West Texas Intermediate (WTI), as we recently saw some bulls entering long trades around those levels. We could see prices rebounding onto these support zones one more time as volatility stays high.
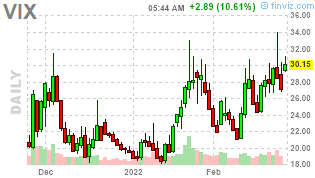
Figure 1 - VIX "Fear Index"
The VIX (aka “Fear Index”) – currently trading around 30 – could spike again depending on how the situation progresses.
That’s all for today folks – happy trading!
As always, we’ll keep you, our subscribers well informed.
Thank you.
Sebastien Bischeri
Oil & Gas Trading Strategist

