Trading position (short-term; our opinion): Short positions (with a stop-loss order at $39.12 and an initial downside target at $33.66) are justified from the risk/reward perspective.
On Wednesday, crude oil lost 5.76% after larger-than-expected increase in gasoline inventories. Thanks to these circumstances, light crude broke below the Dec low and closed the day slightly above $34. Time for a test of the 2009 low?
Although yesterday’s EIA report showed an unexpected 5.1 million-barrel drop in crude oil inventories (in the week ended January 1), it was overshadowed by a 10.6 million-barrel surge in gasoline supplies. This biggest build since 1993 in combination with a 6.3 million-barrel increase in distillate stockpiles and a 917,000 barrels gain in supplies at Cushing, Oklahoma affected negatively investors’ sentiment and pushed the commodity sharply lower. As a result, light crude broke below the Dec low and closed the day slightly above $34. Time for a test of the 2009 low? Let’s examine charts and find out (charts courtesy of http://stockcharts.com).

Yesterday, we wrote:
(…) today’s downswing approached light crude to the lower line of the formation, which could encourage oil bears to act in the coming days.
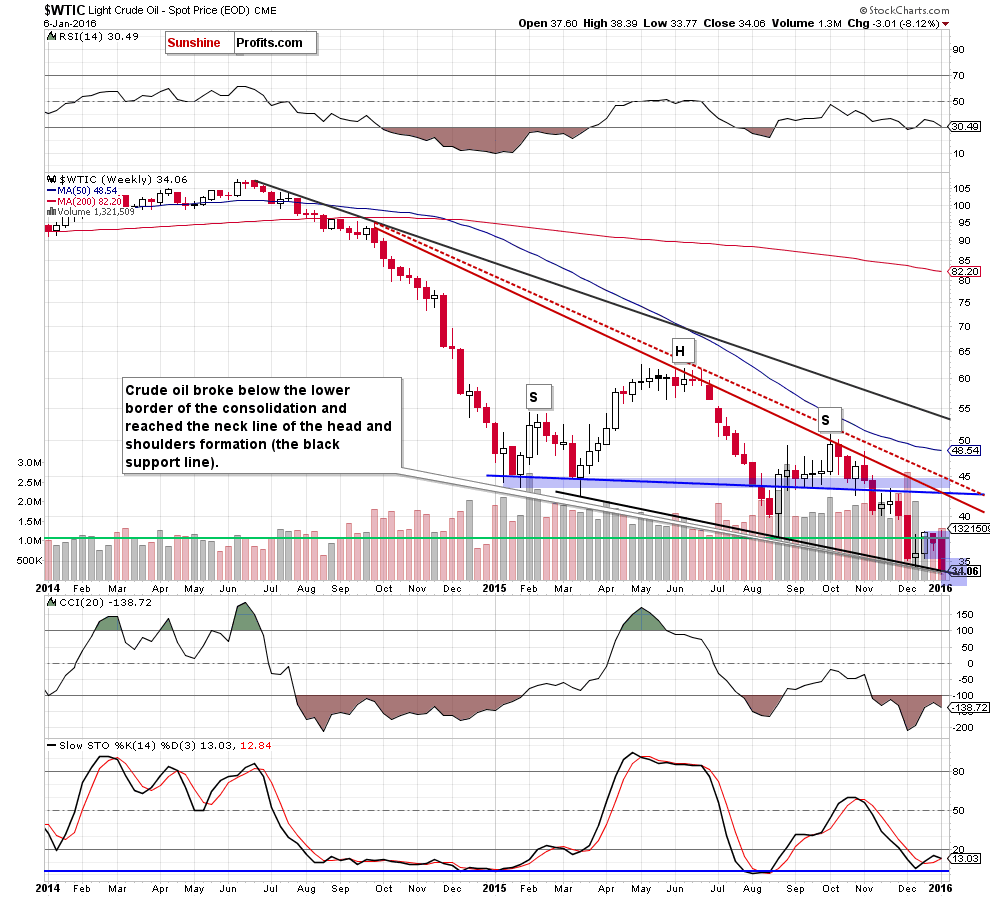
Looking at the weekly chart, we see that the situation developed in line with the above scenario and oil bears pushed the commodity lower. With this downswing, light crude broke below the lower border of the consolidation, which resulted in another drop to the black support line (the neck line of the head and shoulders formation). In Dec, this important support line withstood the selling pressure, which resulted in a rebound. Although we could similar price action in the coming days, the overall outlook remains bearish.
Having said that, let’s take a closer look at the daily chart.

Quoting our Oil Trading Alert posted on Dec 31:
(…) if the black support line is broken, a way to $35.35 (and then to Dec low) will be open.
Yesterday, we added:
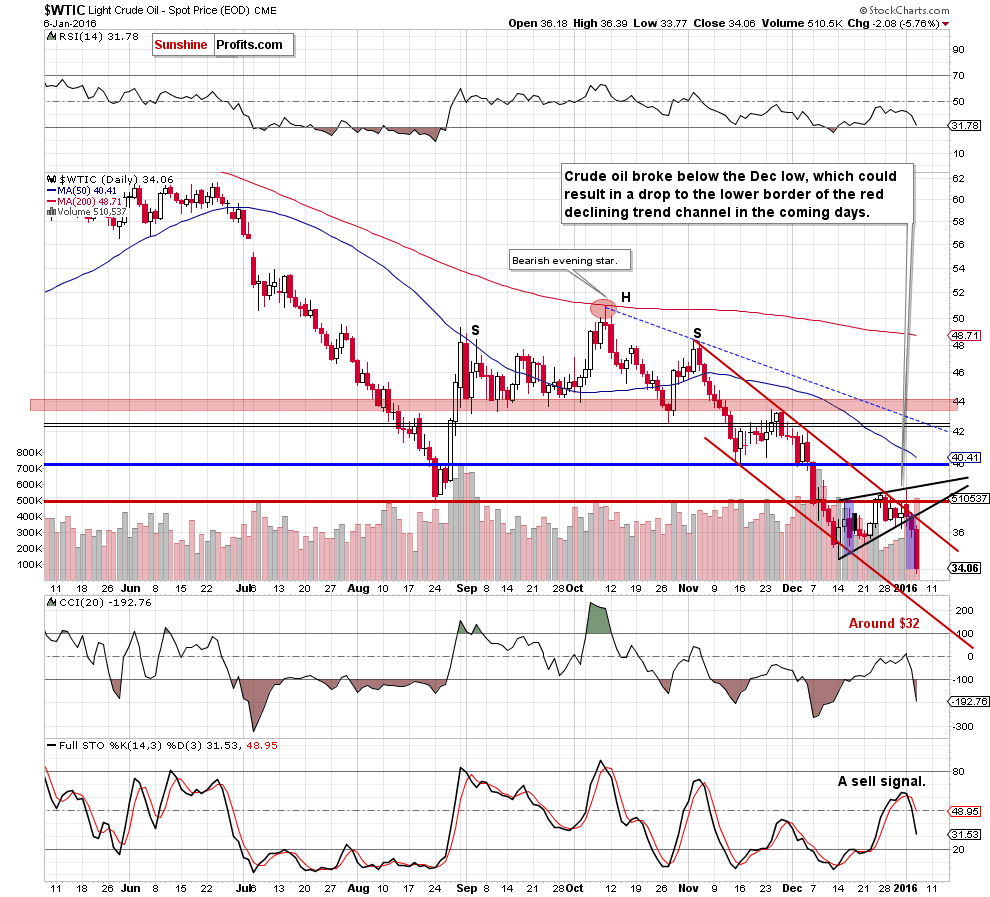
Nevertheless, yesterday’s breakdown under the lower line of the formation suggests that we’ll see a decline to around $33.96, where the size of the downward move will correspond to the height of the rising wedge. At this point, it is also worth noting that the Stochastic Oscillator generated a sell signal, which is an additional negative factor. Why? When we take a closer look at the daily chart, we see that all sell signals generated by the indicator since June encouraged oil bears to act and translated to bigger or smaller declines. Therefore, in our opinion, the history will repeat itself once again and we’ll see lower values of the commodity in the coming days.
As you see on the daily chart, oil bears showed their claws once again and pushed crude oil lower as we had expected. With this downward move, light crude broke below the Dec low and slipped below our yesterday’s downside target. In our opinion, this is a bearish signal, which suggests further deterioration and a drop to around $32, where the lower border of the red declining trend channel is.
Nevertheless, such price action will be more likely only if crude oil breaks below the black support line marked on the weekly chart. At this point, it is also worth noting that if we see such drop, oil bulls will find the first support around $33.55, where the 2009 low is.
Finishing today’s alert, please keep in mind what we wrote yesterday about the oil-to-stocks ratio:
(…) the ratio invalidated earlier breakout above the upper border of the blue declining trend channel, which is a negative signal that suggests further deterioration in the coming days. But what does it mean for the commodity? As you see on the chart, lower values of the ratio have corresponded to lower prices of light crude in previous months. Therefore, in our opinion, another downward move in the ratio will trigger further deterioration in crude oil in near future (especially when we factor in a sell signal generated by the Stochastic Oscillator).
Summing up, crude oil extended losses and broke below the Dec low, hitting a fresh multi-year low. This suggests further deterioration and (at least) a test of the 2009 low in the coming days. Therefore, short positions (which are already profitable) are justified from the risk/reward perspective.
Very short-term outlook: bearish
Short-term outlook: bearish
MT outlook: bearish
LT outlook: mixed with bearish bias
Trading position (short-term; our opinion): Short positions (with a stop-loss order at $39.12 and an initial downside target at $33.66) are justified from the risk/reward perspective. We will keep you – our subscribers – informed should anything change.
Thank you.
Nadia Simmons
Forex & Oil Trading Strategist
Przemyslaw Radomski, CFA
Founder, Editor-in-chief
Gold & Silver Trading Alerts
Forex Trading Alerts
Oil Investment Updates
Oil Trading Alerts


