Trading position (short-term; our opinion): No positions are justified from the risk/reward perspective.
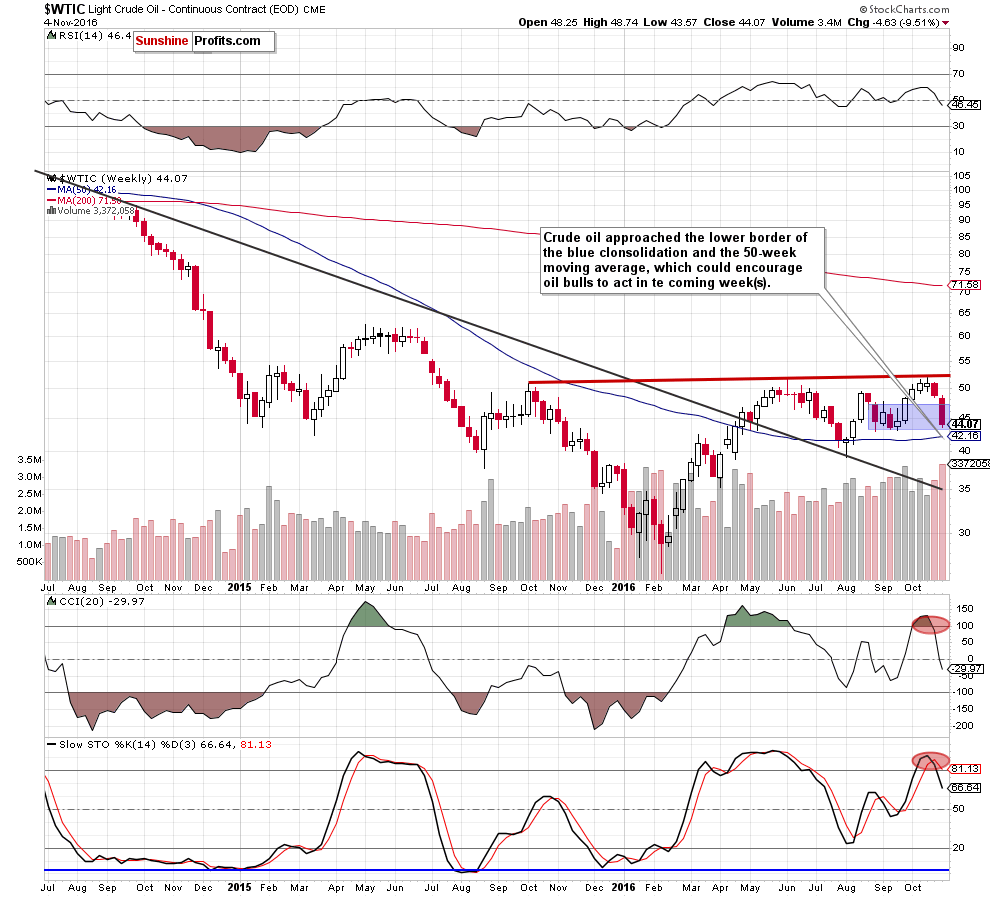
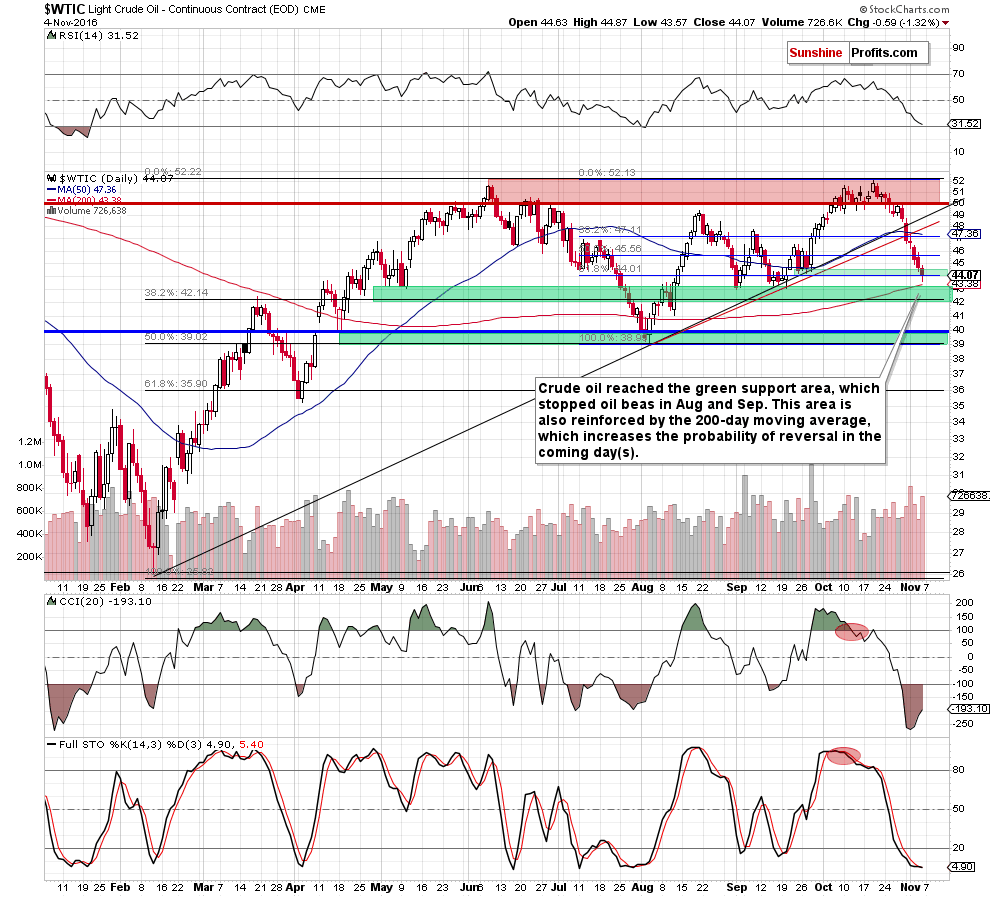
On Friday, crude oil moved lower as worries over supply glut continued to weigh on the price. In this environment, light crude approached a support zone, which stopped oil bears in Aug and Sep. Will the history repeat itself once again and we see a rebound in the coming week?
Let’s jump into the charts and try to find out (charts courtesy of http://stockcharts.com).

Looking at the weekly chart, we see that crude oil approached the lower border of the blue consolidation and the 50-week moving average, which could encourage oil bulls to act and trigger a rebound in the coming week.
Are there any other technical factors that could support such price action? Let’s take a look at the daily chart and find out.

On Friday, we wrote the following:
(…) crude oil declined under the 50% Fibonacci retracement (based on the Aug-Oct upward move) and closed the day below it, which suggests that the commodity will likely re-test the nearest support zone later in the day (maybe even its lower border based on the 61.8% Fibonacci retracement around $44.16).
From today’s point of view, we see that the situation developed in line with the above scenario and crude oil not only reached the 61.8% Fibonacci retracement, but also slipped below it, which suggests that our previous commentary remains up-to-date also today:
(…) taking into account the fact that there are still no buy signals at the moment, it seems that crude oil could decline even to the next (and much stronger) support zone created by the 38.2% Fibonacci retracement (based on the entire Feb-Oct upward move), late Apr and early May lows, early Aug highs and Sep lows. This area is also supported by the 200-day moving average, which increases the probability of reversal and bigger rebound (in our opinion, to around the previously-broken red and black support/resistance lines) in the coming week.
(…) it’s worth keep in mind that there is a negative divergence between the CCI and the price, while the Stochastic Oscillator dropped to its lowest level since early Aug. Back then similar situation encouraged oil bulls to act, which resulted in a rally above $49.
As always, we’ll keep you - our subscribers - informed should anything change.
Thank you.
Nadia Simmons
Forex & Oil Trading Strategist
Przemyslaw Radomski, CFA
Founder, Editor-in-chief, Gold & Silver Fund Manager
Gold & Silver Trading Alerts
Forex Trading Alerts
Oil Investment Updates
Oil Trading Alerts


