
On Thursday, crude oil lost 0.29% and fell to a more-than-six-month low as expectations for the Federal Reserve to continue tapering its bond-buying program weighted on the price.
Yesterday, the Labor Department said in its report that initial claims for jobless benefits decreased by 15,000 to a seasonally adjusted 330,000 in the week ended Jan. 4 (while economists had expected 335,000 new claims for the week). After these numbers, the U.S. dollar improved as a drop in the number of new unemployment claims suggested continued improvement in the labor market.
Taking the above into account, it seems that oil investors worried that positive economic data could lead the Fed to accelerate the wind-down of its economic stimulus program, which has supported crude prices by weakening the dollar and making crude cheaper to buy with other currencies.
Having discussed the above, let’s move on to the technical changes in the crude oil market (charts courtesy of http://stockcharts.com).
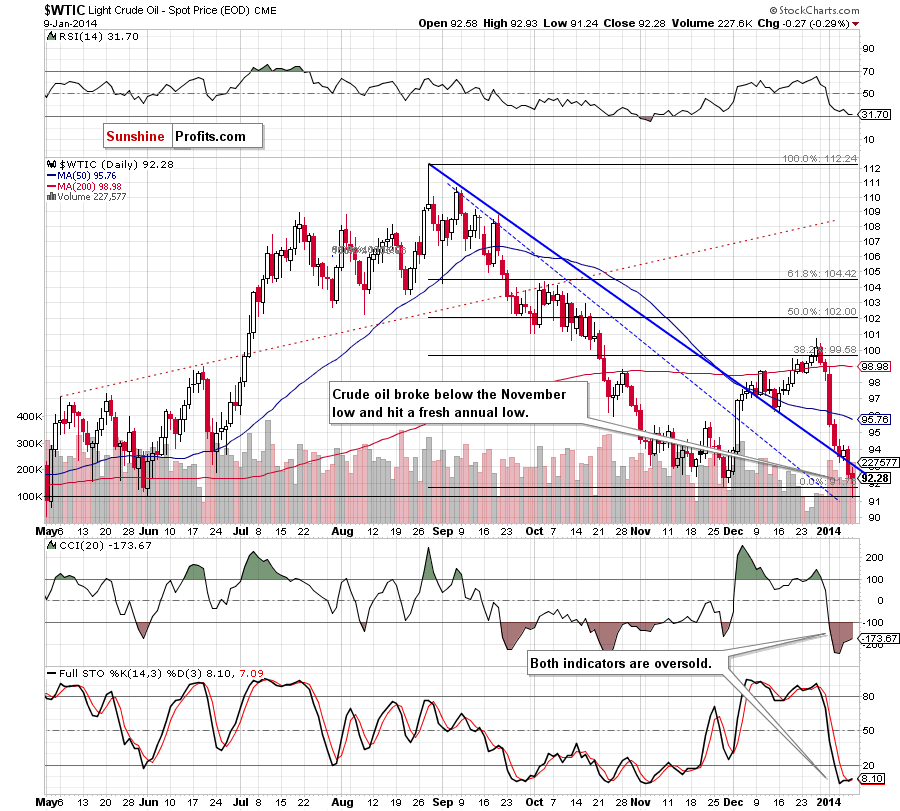
On the above chart, we see that crude oil broke below the November low and hit a fresh monthly low of $91.24. With this downswing, light crude reached the next support level created by the June low (in terms of intraday lows). As you see on the daily chart, crude oil rebounded after reaching this support and closed the day above the November low, which is a positive signal (not strong, but still). On the other hand, light crude still remains below the previously-broken short-term declining support/resistance line, which supports the bearish case (please note that the breakdown is not confirmed at the moment).
Looking at the position of the indicators, we see that the CCI and Stochastic Oscillator are oversold and there is a positive divergence between them and the price of light crude, which is a positive sign and may encourage the buyers to act.
Having discussed the current situation in light crude, let’s take a look at WTI Crude Oil (the CFD).
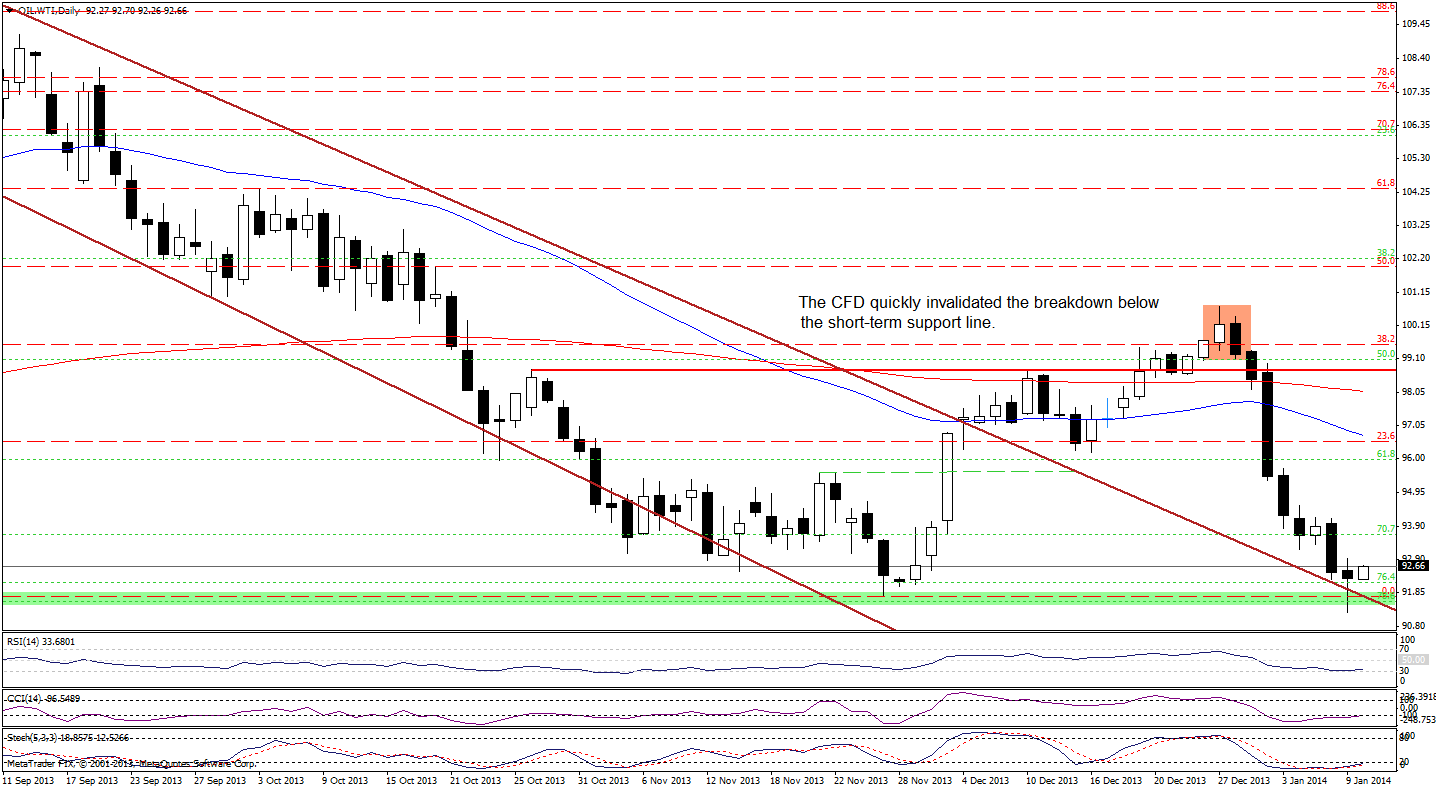
On the above chart, we see that WTI Crude Oil slipped below the previously-broken short-term declining support line based on the August and September highs and the November low. However, this deterioration was only temporary and the CFD rebounded closing the day above this line. This is a positive signal – especially when we factor in the position of the indicators. The RSI still remains slightly above the level of 30, which suggests that a pause or an upward correction is just around the corner. There are also positive divergences between the CCI, Stochastic Oscillator and the CFD, which is a positive sign.
The combination of the invalidation of the breakdown below the November low (and the short-term declining support line) and the position of the indicators may encourage oil bulls to act in the near future.
Once we know the above, let’s take a look at the NYSE Arca Oil Index (XOI) chart.
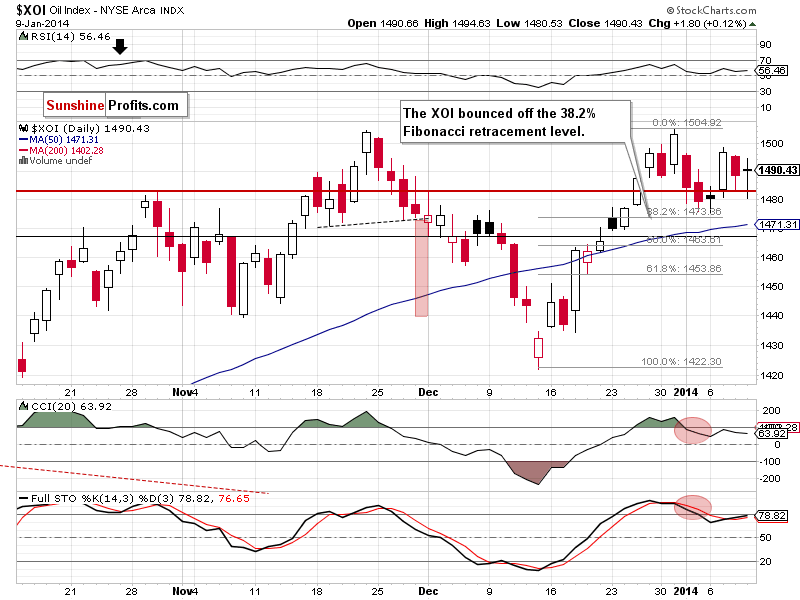
On the above chart, we see that the oil stock index remains in a consolidation range between Wednesday’s low and high. From this perspective, we should consider two scenarios. If the buyers manage to push the oil stock index higher, we will likely see another attempt to break above the level of 1,500. On the other hand, if the XOI extends its decline, the first downside target will be Monday’s low (slightly above the 38.2% Fibonacci retracement level) and the 50-day moving average (currently at 1,471).
Please note that the XOI didn’t invalidate the bullish candlestick pattern (a morning star), which still supports buyers.
Summing up, crude oil declined to a more-than-six-month low, which is a bearish signal. Despite this drop, light crude rebounded and closed the day above the November low. Additionally, the CFD invalidated the breakdown below the short-term declining support/resistance line, which may encourage oil bulls to act. However, if the buyers fail and crude oil closes the week below the blue lines marked on the weekly chart, we will likely see further deterioration.
Very short-term outlook: bearish
Short-term outlook: bearish
MT outlook: mixed
LT outlook: mixed
Trading position (short-term): We do not suggest opening any positions at the moment. We will keep you informed should anything change, or should we see a confirmation/invalidation of the above.
Thank you.
Nadia Simmons
Forex & Oil Trading Strategist
Oil Investment Updates
Oil Trading Alerts

