Trading position (short-term; our opinion): No positions are justified from the risk/reward perspective.
On Friday, crude oil gained 0.74% after Saudi Energy Minister Khalid al-Falih commentaries, which renewed hopes of an extension of output cuts by OPEC and non-OPEC producers. In these circumstances, light crude climbed above two moving averages, invalidating the earlier breakdowns. What does it mean for the black gold?
Let’s take a closer look at the charts below and find out (charts courtesy of http://stockcharts.com).


On Friday, we wrote the following:
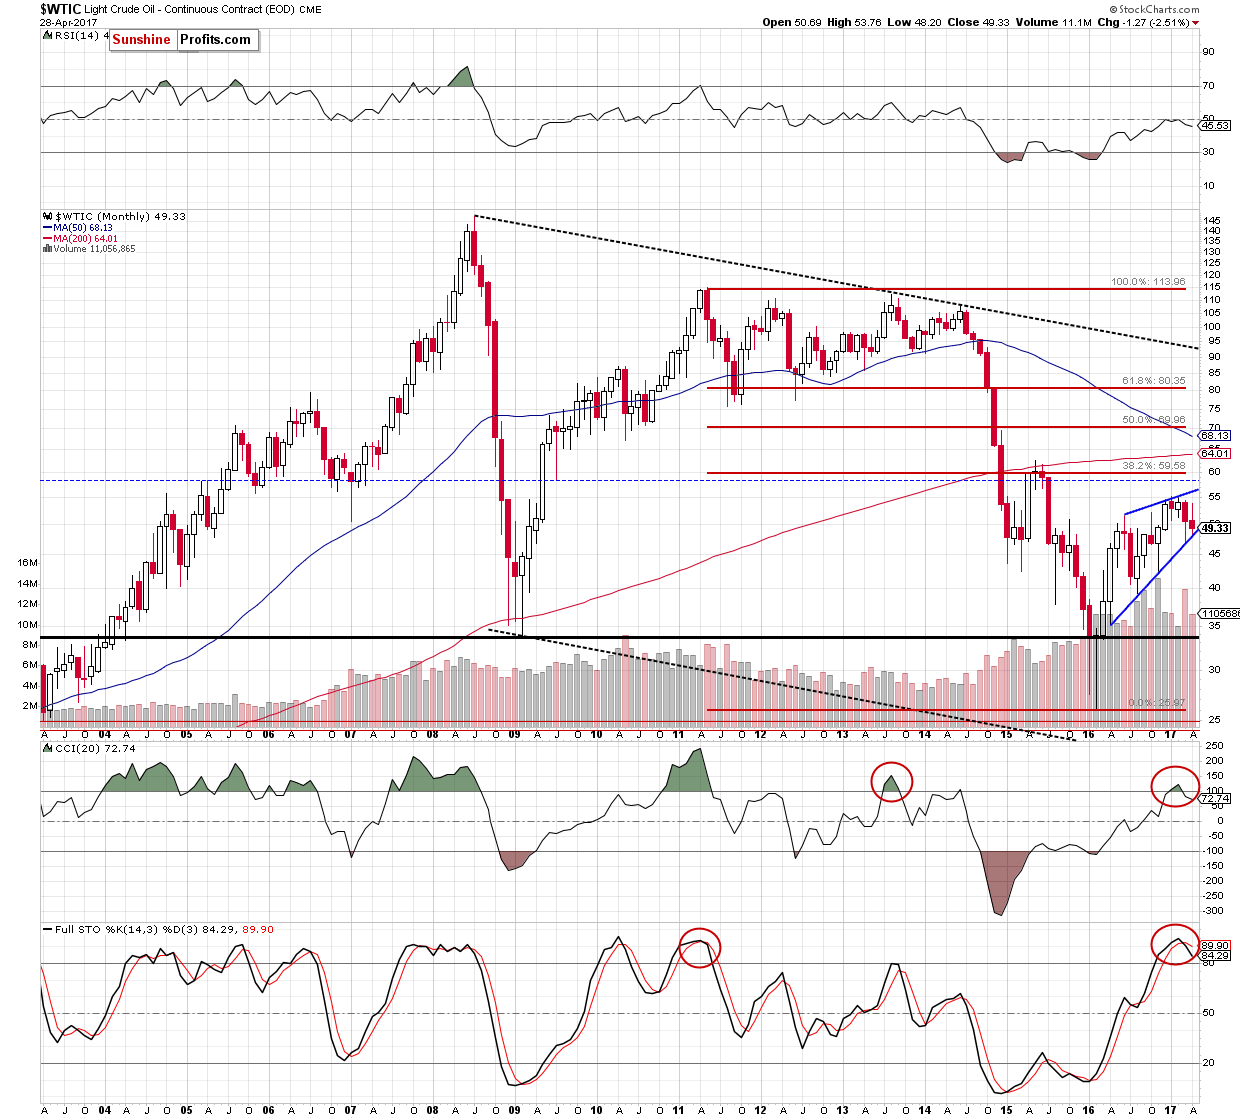
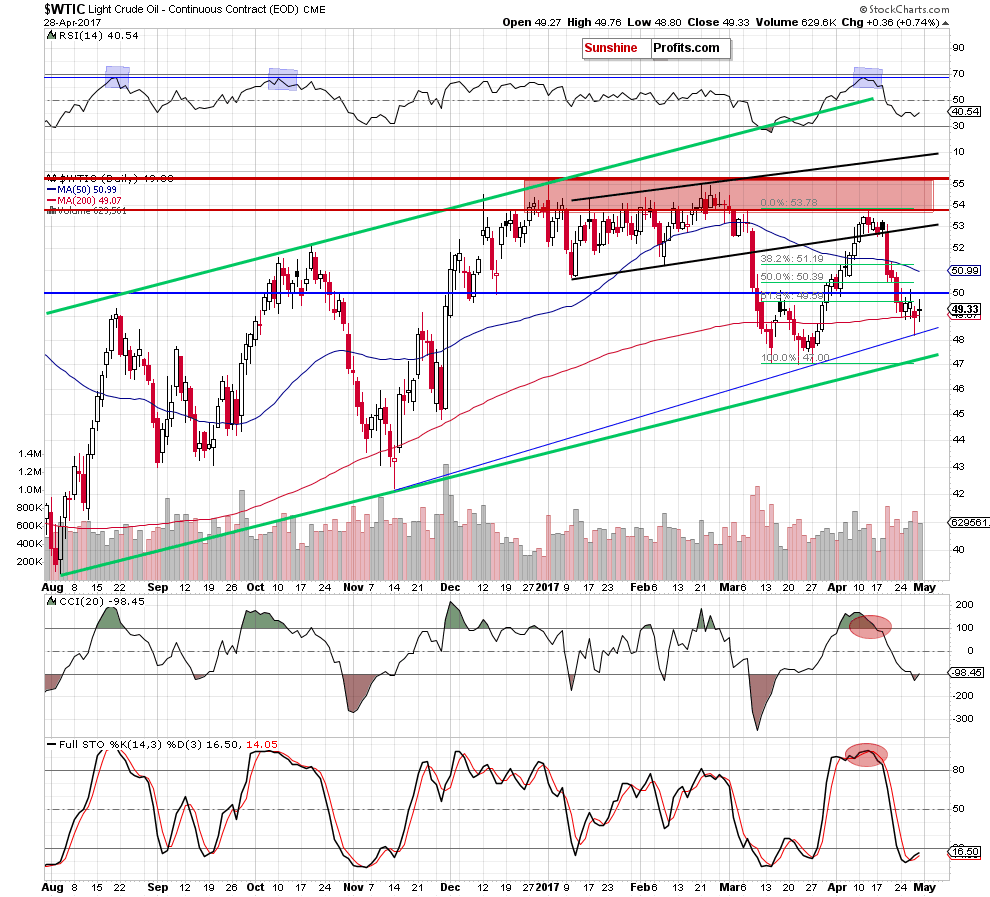
(…) crude oil reached our downside target(…) [the blue support line based on the November and March lows (currently around $48.30).] (…) with yesterday’s decline light crude also dropped the long-term support line marked on the monthly chart (…) this support was strong enough to stop oil bulls in the previous month, which suggests that history may repeat itself once again. Additionally, the daily CCI and the Stochastic Oscillator are oversold and the latter generated even a buy signal, which increases the probability of reversal in the coming day.
Looking at the above charts, we see that oil bulls pushed crude oil a bit higher as we had expected. Thanks to Friday’s small increase light crude bounced off the long-term support line based on the April, August and November 2016 lows and closed the day above the 200-day moving average, invalidating the earlier breakdown, which is a positive development. Additionally, the CCI and the Stochastic Oscillator generated buy signals, suggesting further improvement in the coming days – similarly to what we saw in March.
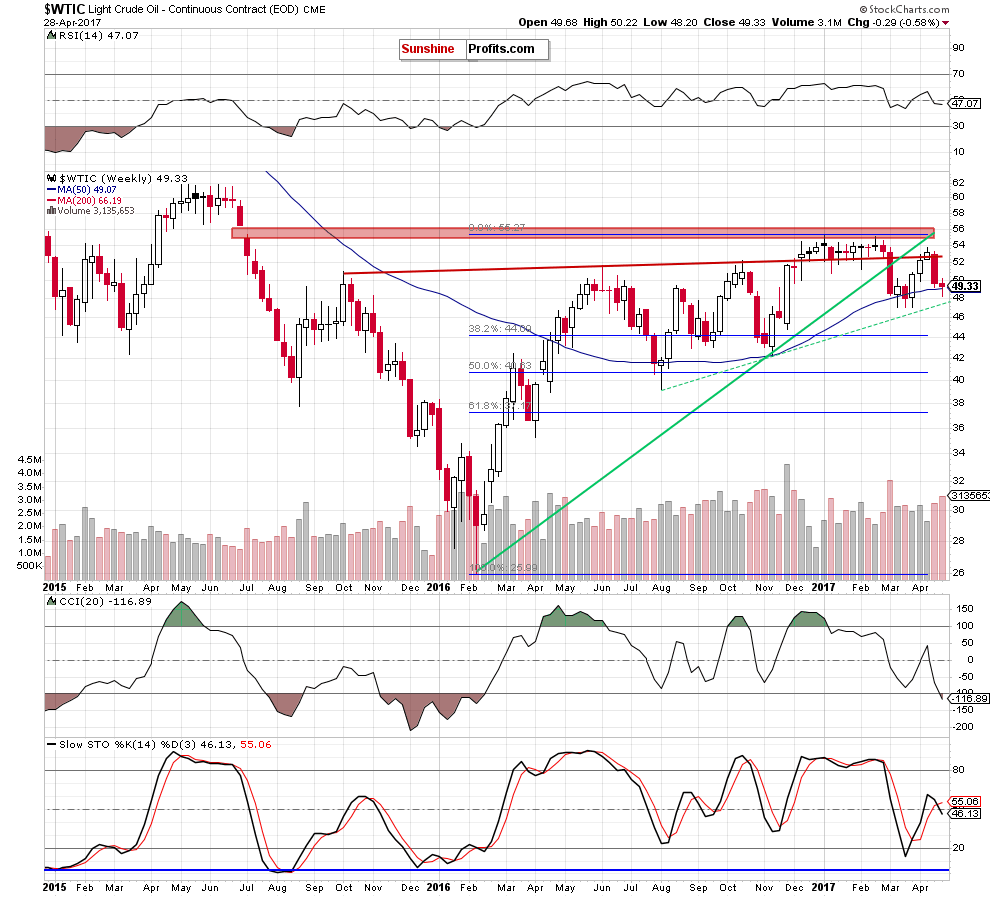
On top of that, on the weekly chart, we can notice one more positive factor.

From this perspective, we see that the last week’s rebound took crude oil above the 50-week moving average, which means that the commodity invalidated the earlier small breakdown. When we take a closer look at the weekly chart we see that there was a similar situation in mid-March. Back then, an invalidation of the breakdown translated into consolidation and a rebound, which suggests that history could repeat itself once again – especially when we factor in an invalidation of the breakdown under the 50-week moving average, buy signals generated by the daily indicators and the rebound from the long-term support line marked on the monthly chart.
How high could the black gold go in the coming days? If we see further improvement, the initial upside target will be the barrier of $50. If it is broken, the next upside target will be around $50.32, where the 38.2% Fibonacci retracement based on the entire recent downward move is.
Summing up, crude oil bounced off the long-term support line and invalidated the breakdown under the 50-week moving average and the 200-day moving average, while the daily CCI and the Stochastic Oscillator generated buy signal, suggesting further improvement in the coming day(s).
Very short-term outlook: mixed with bullish bias
Short-term outlook: mixed
MT outlook: mixed with bearish bias
LT outlook: mixed
Trading position (short-term; our opinion): No positions are justified from the risk/reward perspective. We will keep you – our subscribers – informed should anything change.
We will keep you – our subscribers – informed should anything change.
As a reminder – “initial target price” means exactly that – an “initial” one, it’s not a price level at which we suggest closing positions. If this becomes the case (like it did in the previous trade) we will refer to these levels as levels of exit orders (exactly as we’ve done previously). Stop-loss levels, however, are naturally not “initial”, but something that, in our opinion, might be entered as an order.
Thank you.
Nadia Simmons
Forex & Oil Trading Strategist
Przemyslaw Radomski, CFA
Founder, Editor-in-chief, Gold & Silver Fund Manager
Gold & Silver Trading Alerts
Forex Trading Alerts
Oil Investment Updates
Oil Trading Alerts


