- Euro & USD Indices
- General Stock Market
- Gold
- Silver
- Mining Stocks
- Letters from Subscribers
- Buying physical gold
- SolGold
- Summary
Every college freshman who takes Economics 101 learns about the simple concept of supply and demand. High demand plus lower supply equals a higher price.
Everybody is talking about the price of gold plummeting. The big banks are falling over each other in their scramble to get on the Bear bandwagon. Here are some sample headlines:
Morgan Stanley to Goldman Cut Gold Forecasts on Fed Outlook
"'Paradigm shift' to send gold sliding to $1,200 an ounce: SocGen"
"Gold to Drop Even Further as Fed Increases Real Rates: Goldman Sachs"
"Deutsche Bank cuts gold, silver forecast for 2013"
"Credit Suisse cuts gold, silver, Brent forecasts"
Could it be that they are not taking into account the supply side of physical gold? Gold cannot be printed or manufactured. It must be dug out of the ground. It costs mining companies a certain amount per ounce to cover their expenses, the all in cost—pay workers who are willing to burrow underground for the yellow metal, machinery, license fees to governments, taxes, overhead and other expenses. It doesn’t help the situation that there have been violent worker strikes in mines in South Africa. The capital costs of construction of new mines have escalated significantly.
Once the market price per ounce is lower than what it costs to dig it up, mining companies will halt operations and a supply squeeze will force the price back up -- many dollars chasing too few ounces of gold. Mining companies will halt their expansions and simultaneously slow their higher-cost projects. If demand trends keep sliding, so will the supply. Miners can’t be expected to extract gold and silver from newer projects where the production costs were factored on much higher gold prices.
Already we see Barrick Gold Corp, the world’s largest gold mining company, planning to eliminate 100 jobs at its corporate headquarters in Toronto. Citing a challenging business environment, the company announced this week that the reduction represents 30 percent of the head office staff. Last month, Chile’s environmental regulator stopped construction and imposed sanctions on Barrick’s $8.5 billion Pascua-Lama gold mine, citing “serious violations” of its environmental permit. Barrick has already spent $5 billion on the project. Barrick had hoped to begin production in early 2014. The company also announced last week it planned to reduce its work force in Nevada and Utah.
There are those that argue that the amount of gold mined each year, about 2,500 tons, is just a small fraction of the existing gold stock. What they don’t take into account is that much of the existing supply is not for sale. It is found in peoples’ jewelry boxes, in central banks vaults, in the life savings of people living in rural India. It may be above ground gold, but one can’t think of it as part of the supply since it is not up for sale and therefore cannot satisfy demand. It is in strong hands.
The gold exchanged on the floors of commodity exchanges in London, New York and other places is not backed by physical gold. It is gold on paper.
Unlike the above ground gold supply held by private hands and central bankers, the annual mined gold output held by mining companies is in weak hands -- definitely for sale.
The all-in costs to produce an ounce of gold in 2012 was about $1287, a 10% increase in costs over 2011. At current gold prices, and certainly if the gold price drops further, mining companies are feeling a squeeze in their margin of profit. In addition, gold is becoming harder to find and companies must dig deeper to get it, which in turn makes it more expensive. They will not want to operate at a loss.
According to Bloomberg, gold output in China, the world’s largest producer, is poised to rise almost 10 percent this year—as much as 440 metric tons--even as bullion prices slump. China overtook South Africa as the largest producer in 2007. According to a Chinese official, every 10 percent drop in gold prices is likely to reduce profits at Chinese gold miners by at least 20 percent. But in any case, China’s gold stays in the country and does not reach the West.
We already see signs of a supply deficit in the palladium market.
In CPM Group’s Platinum Group Metals Yearbook 2013, the New York-based metals and mining consultants predicts the palladium market will move into an account deficit beginning next year, and will remain there until at least 2024. CPM also forecast an increase in demand for platinum.
“Constrained mine supply from South Africa and increased use of the metal in the auto sector are expected to be the primary drivers of this long-term deficit in the palladium market. The high price of palladium or even platinum, which is the primary metal for the South African platinum group metal mines, is not expected to help alleviate the constraining mine supply issues of South Africa,” said the yearbook.
Thus calling for the demise of gold will be in for a surprise in the coming years. To see if this week holds any surprises let’s begin this week's technical part with the analysis of the US Dollar Index. We will start with the very long-term chart (charts courtesy by http://stockcharts.com.)
USD and Euro Indices
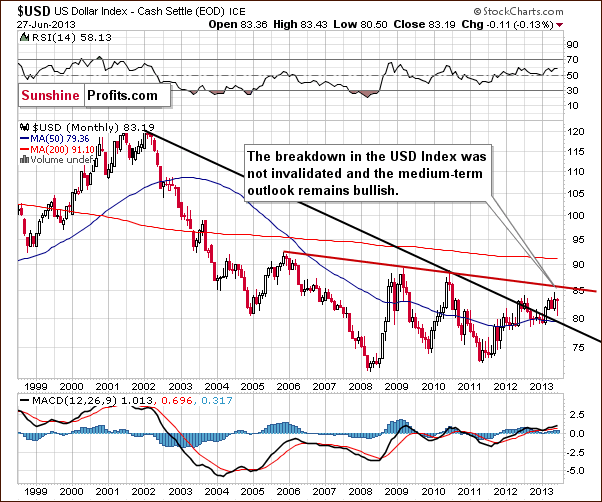
When we look at this chart, (recall that we have been expecting the index to move higher for some time now once the breakout was seen), we see that a rally finally materialized this week. This chart is still bullish at this time. There is a resistance level at 86.4, and also another one which corresponds to the previous high (seen this week) and that will be seen more clearly on the next chart.
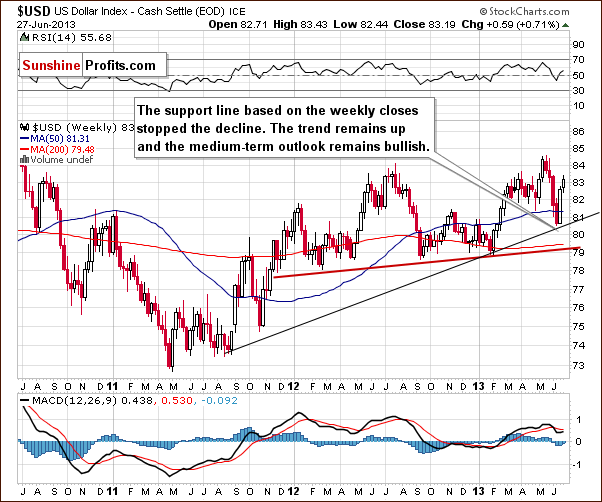
The support line was reached and it held the decline, so the medium-term trend remains up. As mentioned above, there could be a pause around 84.5 or so, which is just one index point higher than the current level.
The situation remains bullish for the USD Index in the long and medium term, so let’s check to see if the short-time outlook is the same.
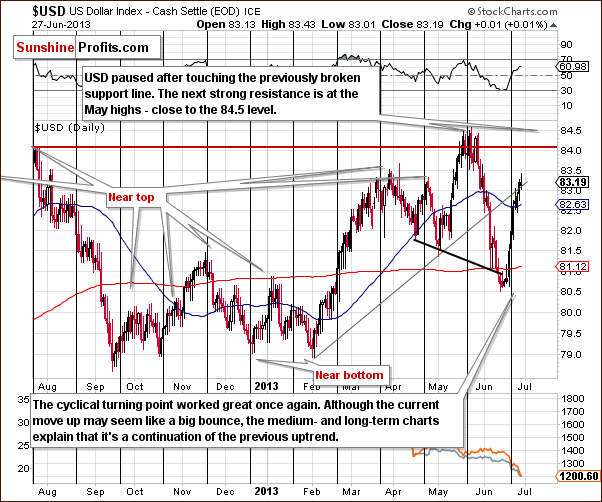
In this week’s USD Index short-term chart, we can see how the situation has evolved recently. A sharp rally was seen recently so a pause would not be surprising. As odd as it may sound given the previous sentence, a continuation of the rally is also a possibility. The upswing is pretty symmetrical with the preceding decline, and if this continues, we could see a move above 84 in the coming days. This would likely have severe bearish implications for gold and silver. Taking a closer look, it seems that higher USD values in the past few days drove gold and silver prices lower, so a move above 84 would surely be a big deal for the whole precious metals sector.
Now let’s move on to the analysis of the Euro Index.
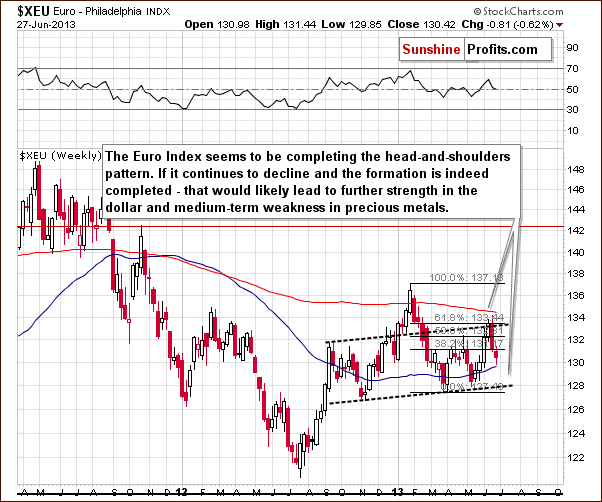
In this week’s Euro Index chart, we see that the head-and-shoulders pattern remains in place. It has not yet completed (and it could still be invalidated) but it is still being formed. With the short-term trend down for the euro, this chart is bearish at this time for the medium term, so it confirms what we wrote about the USD Index, as the two indices move in the opposite directions as the EUR:USD currency exchange rate is the main part of the USD Index.
Summing up, the long, medium, and short-term outlook for the USD remains bullish. This has bearish implications for gold. Even though the index rallied sharply recently, additional rally could be seen to even above the 84 level before any pause or consolidation takes place. The short-term picture is a bit unclear, though, and we could see some sideways trading right away. We’ll discuss the implications of both scenarios later in today’s update.
General Stock Market
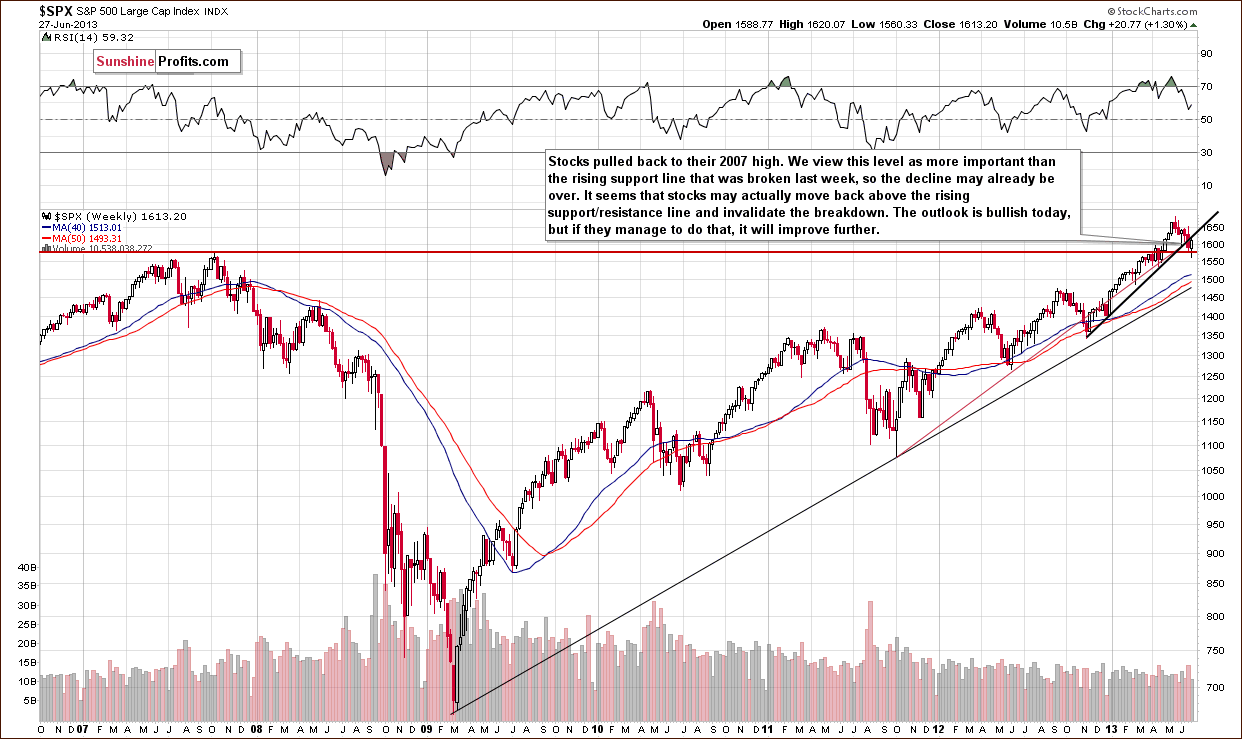
Turning now to the long-term S&P 500 Index chart, what we stated in our previous Premium Update remain up-to-date:
The bottom for the latest decline may be in because, although stocks did not decline to the level of the 2007 highs, price levels bounced off the intersection of two support lines. This could mean that the bottom may be in anyway.
We expected the recent declines in stocks to be nothing more than some consolidation and didn’t expect the 2007 high to be broken. The outlook here will be even more bullish if stocks end the week above the rising support/resistance line, but the situation is bullish nonetheless.
Gold is anti-asset and can lose its appeal when stocks rally. On Thursday, gold declined but silver and the mining stocks did not have similar moves. Given that the general stock market rallied, it could be the case that silver and the miners are more influenced by stock market rallies. Historically, this has been the case for these sectors more than for gold, but it seems to us that it’s only a temporary phenomenon and that silver and miners will follow gold lower if the latter declines below $1,200. Overall, the situation for stocks is pretty much unchanged, and the implications for gold continue to be bearish.
Gold
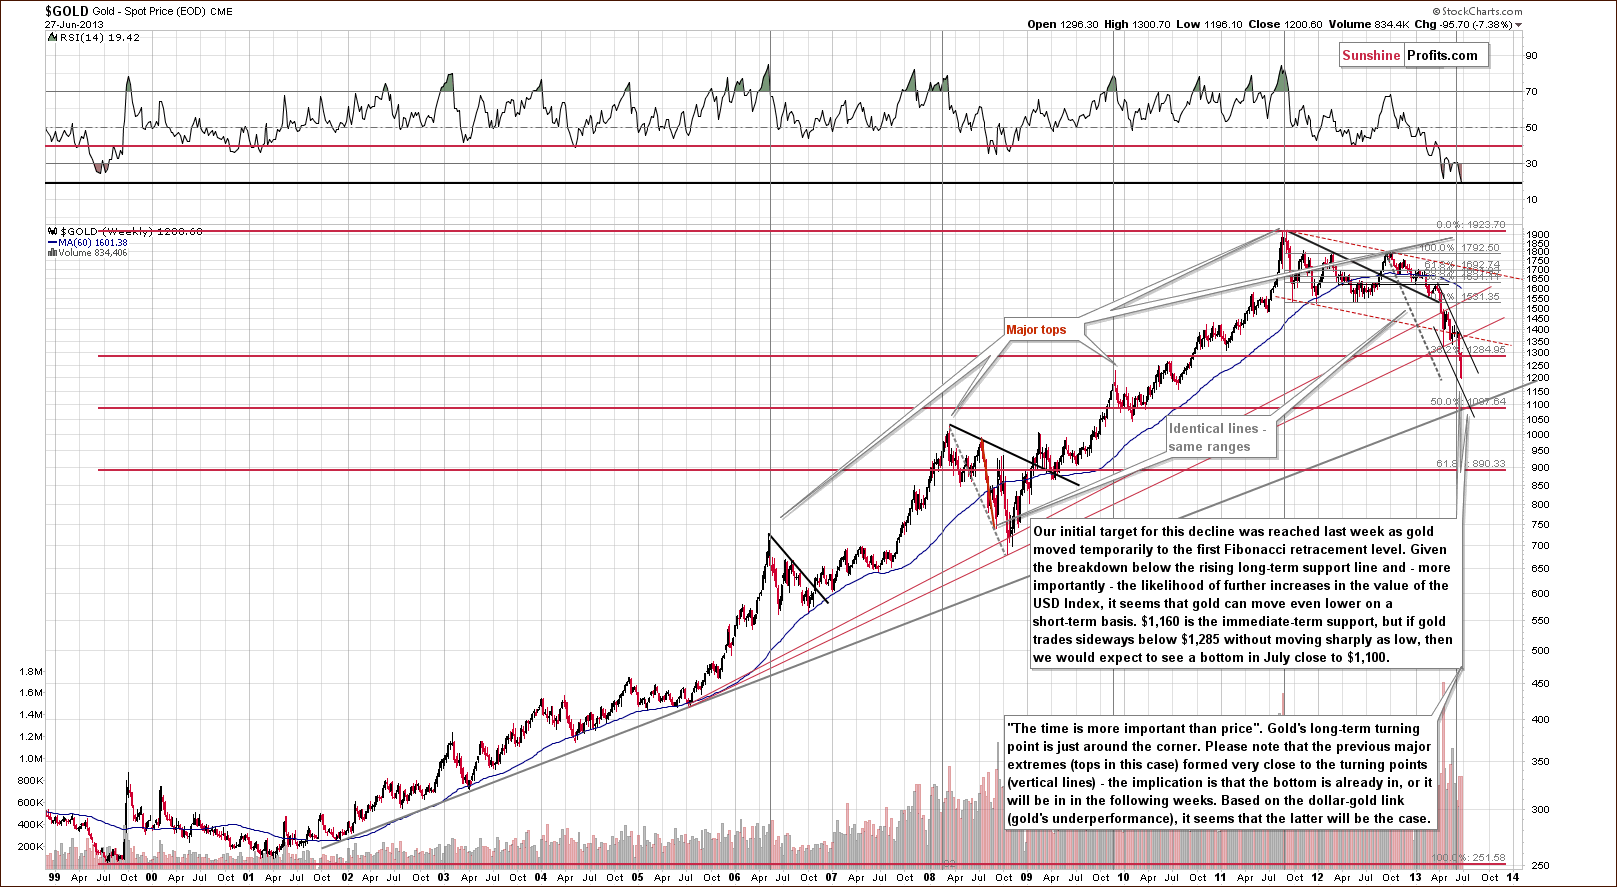
Gold declined once again this week and since the most pressing question at this time is still “is the decline over yet”; we’ll get right to the point. Based on the above chart, it seems to us that we will see a local bottom shortly (at the lower border of the declining trend channel), and the really big question will then be if that is the final bottom or will we see gold decline even lower.
There is a very strong support that is likely to stop the decline right below the $1,100 level. This support is created by two major factors (each of them could stop the decline but their combination is even more powerful): the 50% retracement level based on the entire bull market and the rising very long-term support line.
If we don’t get a sharp drop to the lower border of the declining trend channel, then gold could decline slowly (slower than so far this week) to the support level below $1,100. If, however we get a sharp move to the lower border of the trend channel, we will likely see a bounce first as the situation will become too oversold on a short-term basis, and because the important support would have reached at that point. Please note that this is likely to correspond to two above-mentioned scenarios regarding the USD Index. If USD moves to 84 – 84.5 quickly, we could see a sharp drop in gold, but if USD pauses but then continues to rally up to 86 – 86.4, then we could easily see a decline to $1,100 or a bit lower in gold.
Which of these scenarios is more likely in our view? We think that the sharp-drop-and-a-pullback-before-the-final-bottom scenario is more probable. This might be wishful thinking, though, as it might provide a very good trading opportunity which we would like you to catch (and we would like to catch it ourselves as well, but for the record, we always issue alerts first and then make transactions on our own).
If gold bottoms at $1,160 - $1,175, how high can it bounce? A $100-something move would be quite likely – to the previously broken Fibonacci retracement level close to $1,285. Gold could bounce even higher, to the upper border of the trend channel, but at this time it seems best to say that at least a $100 pullback would be likely.
Having said that, let’s take a look at other gold charts and examine if they confirm or invalidate the above.
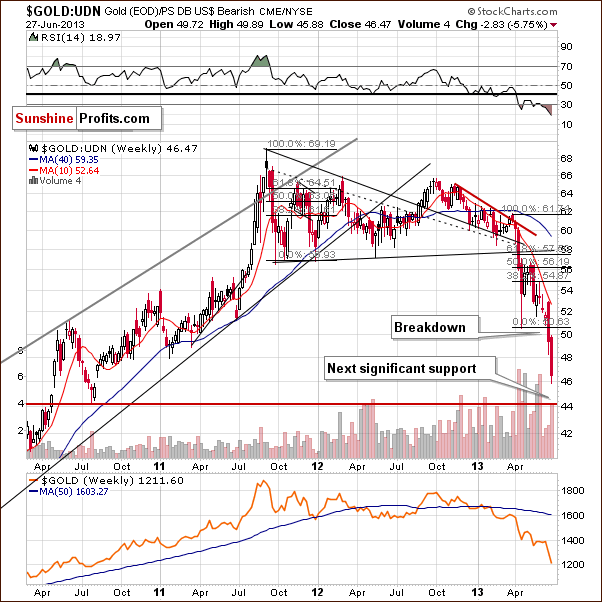
Gold viewed from the non-USD perspective confirmed its breakdown and is declining just as is the case with gold seen from our regular USD perspective. The next support level is still relatively far off, so gold could very well decline in the coming days.
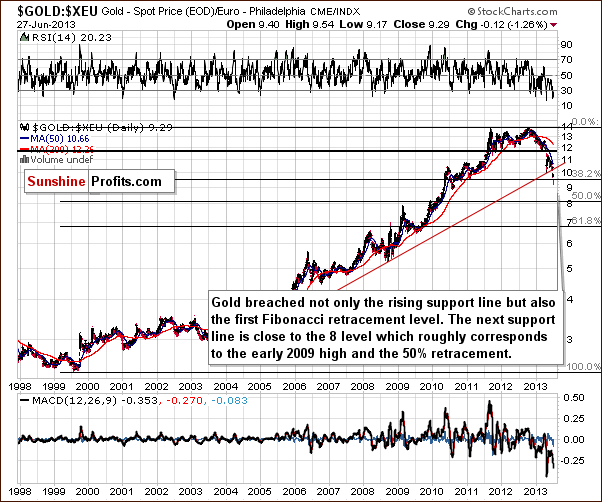
Gold priced in euro has also broken below an important long-term support level – in this case the first Fibonacci retracement level. The next support level that’s significant enough to stop the decline of this magnitude is relatively far, close to the 8 level. Implications here are bearish.
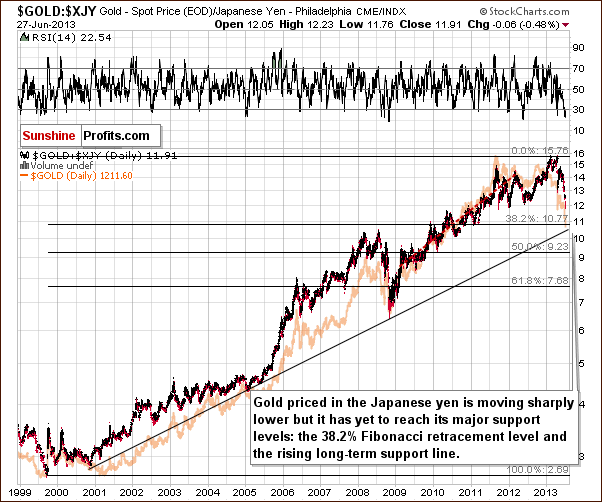
Gold priced in Japanese yen did not decline as much recently as gold priced in most other currencies, but still the decline is clearly visible from the long-term perspective. The strongest long-term support levels – rising support line, first Fibonacci retracement level - have not yet been reached though. Gold moved close to 2012 lows, however, which may provide temporary support.
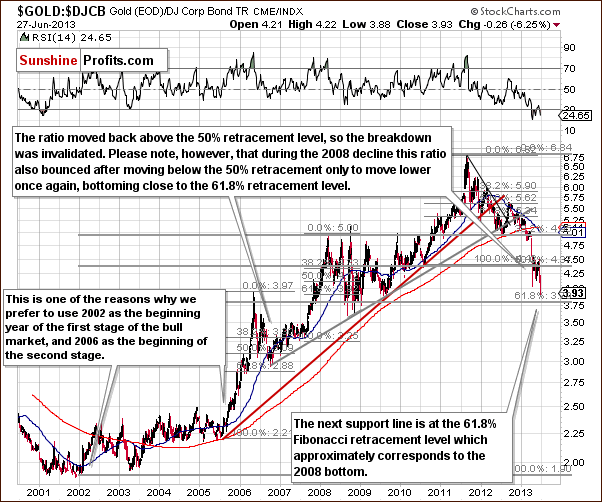
The picture above illustrates the gold to bonds ratio, but it could as well be entitled “almost”. The strong 61.8% Fibonacci retracement level was almost reached and thus the decline might be almost over. Almost – so we can see lower gold values shortly, but not much lower.
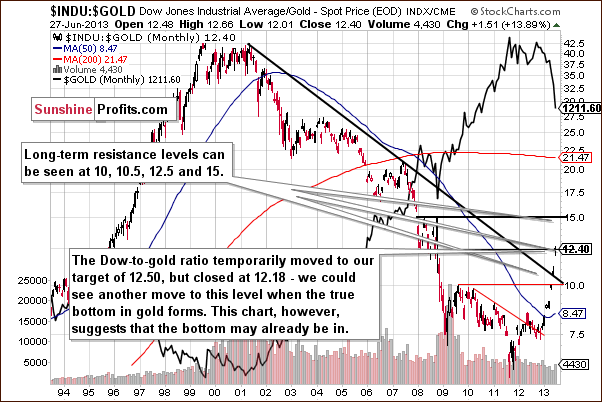
The Dow to gold ratio moved higher this week and it even reached one of the important resistance levels that we featured previously. The bottom for gold may already be in based on the above chart. Still, please note that if stocks decline along with gold, then the latter can move lower without an increase in the ratio (without a breakout in it). Additionally, the above chart is a long-term one and if a small, short-term move lower in gold does indeed materialize, it may cause the ratio to move above the current resistance level temporarily and move back down in the following days – thus invalidating the breakout. Therefore, the above chart suggests that the bottom is likely quite close, not necessarily that it is surely already in.
Summing up, some charts suggest that the bottom may already be in (Dow to gold ratio, 2012 lows being reached from the Japanese yen perspective) but most of them suggest lower prices on the horizon. Consequently, it seems that the description of the first chart in this section is correct. Namely, gold is likely to form a local bottom soon, in the $1,160 - $1,175 range and then pull back by $100 or more. If it trades sideways for several days or a week or so, then a move to slightly below $1,100 will become the most probable outcome.
Silver
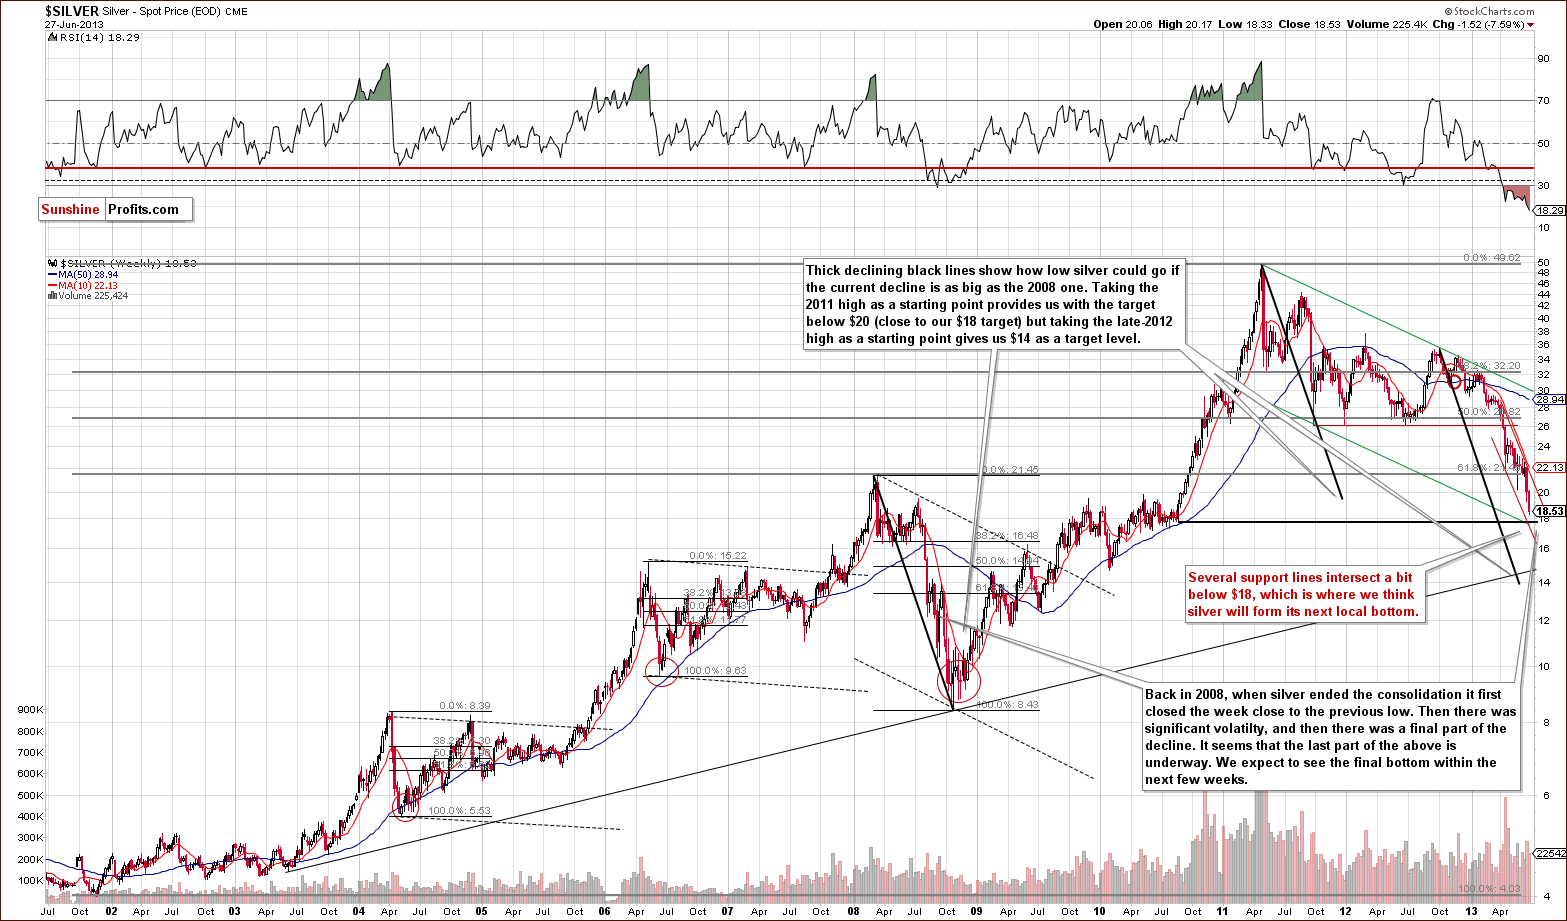
In this week’s very long-term silver chart, we can draw a declining trend channel similar to what we saw in the very long-term gold chart. Here it is even more interesting and meaningful because the target level suggested by this technique corresponds to a medium-term trend channel (green lines in the chart). They intersect slightly below $18, so it seems likely that another $1 decline is in the cards with a local bottom probably to follow.
This will also be a move back to the level of the mid-2010 low after which a huge rally started. What has been seen here lately is basically a reversal of the 2010-2011 sharp upswing.
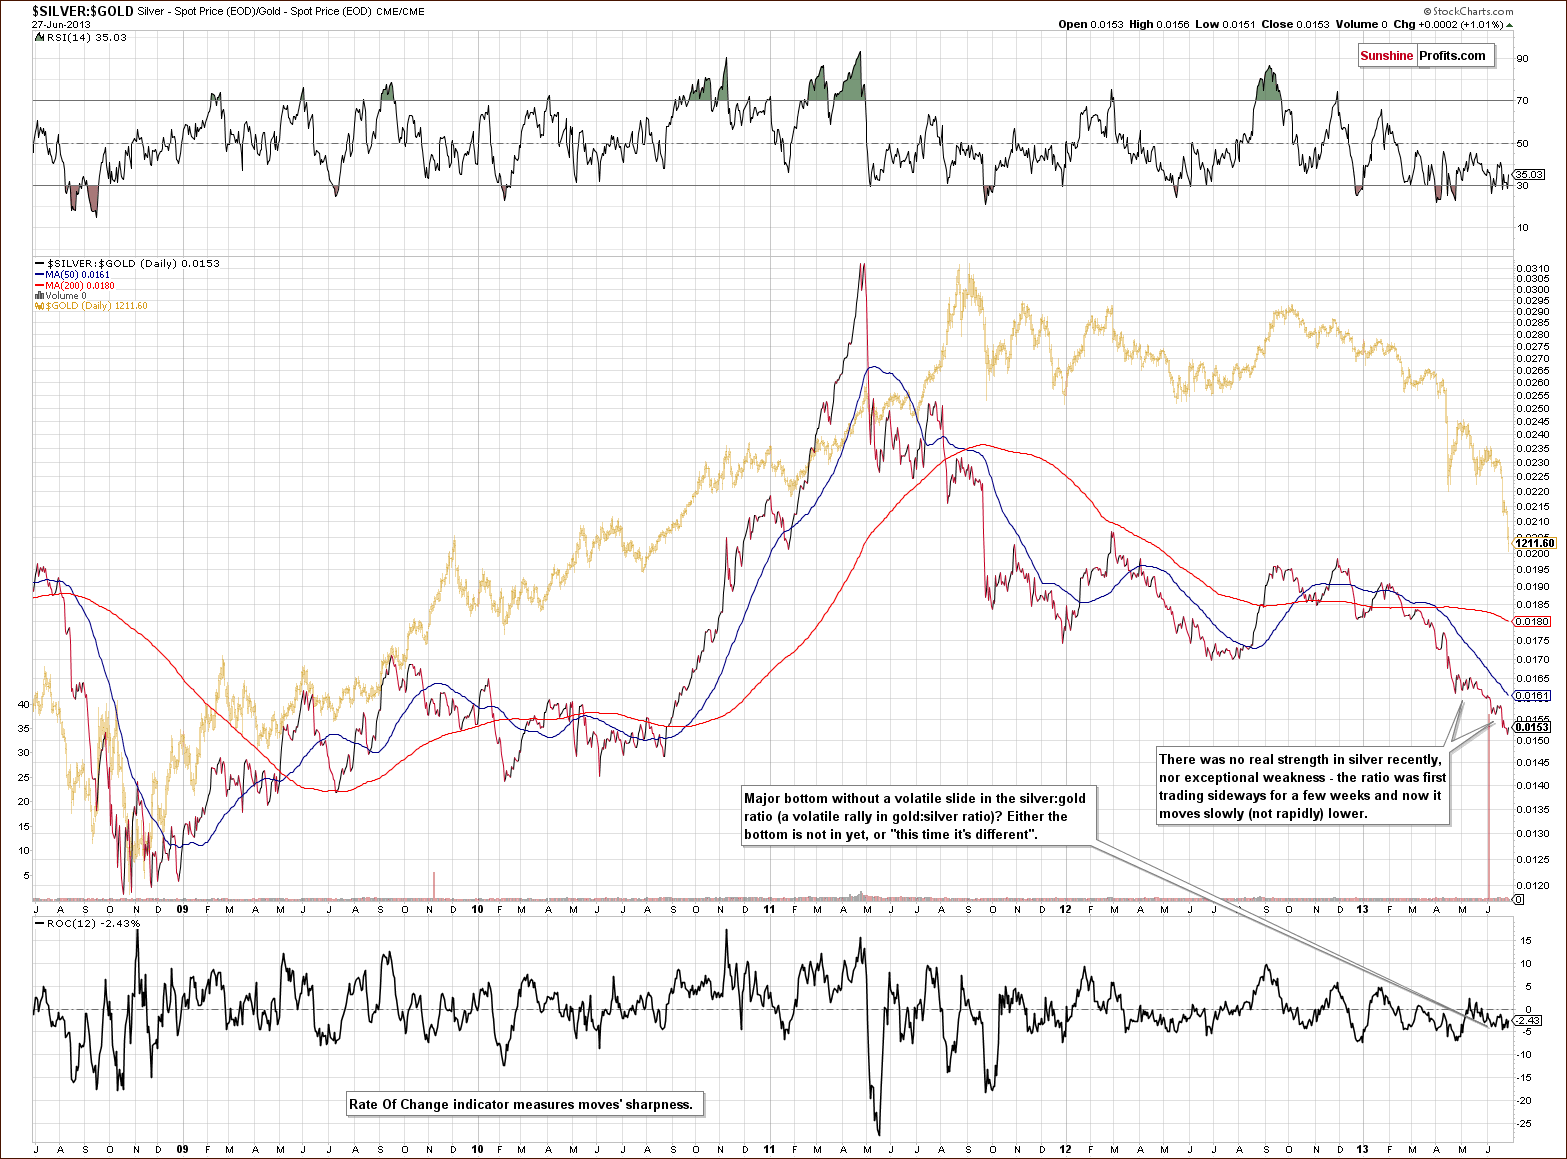
In the silver to gold ratio chart, we can see that recent declines in silver’s price have been relatively moderate compared to gold’s. What this tells us is that we may not be at the end of prices declines just yet.
If the intersection of the lower borders of the declining trend channels is reached (silver moves below $18), we will likely suggest exiting short positions regardless of the above chart as ultimately the price levels in USD, gold and silver are more important than the silver-gold ratio’s decline and its sharpness.
Summing up, the local bottom will likely form soon for the white metal but it has not yet been seen.
Gold and Silver Mining Stocks
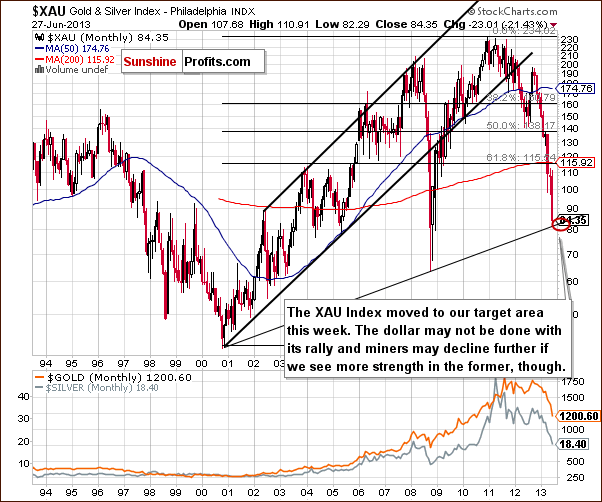
In this week’s XAU Index chart, we see that prices have moved below 84 this week (our initial target for the decline). Based on this chart, the bottom may be in. We also could see an initial downswing, which seems probable, but it’s just not that certain based on this chart alone. Perhaps the HUI Index chart will give us a better insight.
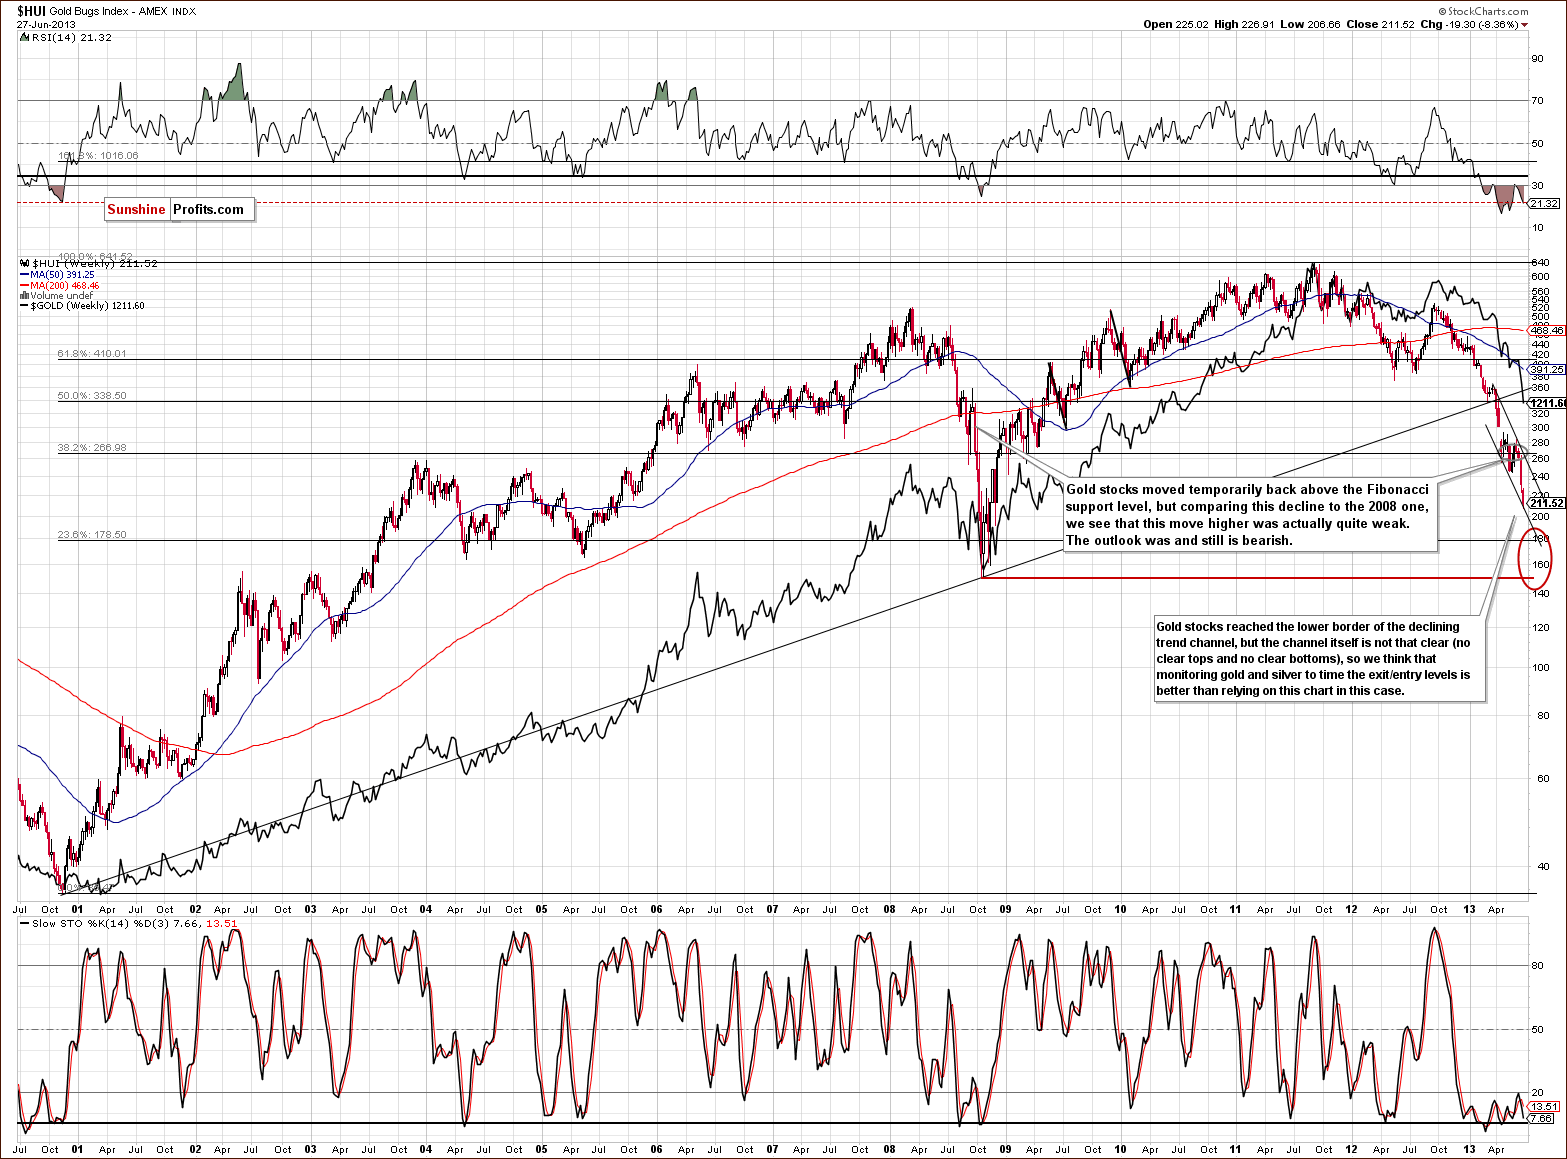
In this week’s very long-term HUI index chart, we see that the short-term target level has been reached by the lower border of the declining trend channel. This situation is analogous to gold and silver’s, but here, the tops and bottoms are less visible. This makes the technique less reliable in our view. It seems best to monitor gold and silver to estimate when we’ll see the next local bottom. It does seem that we will see one soon, the question is: “will it be the main bottom”?
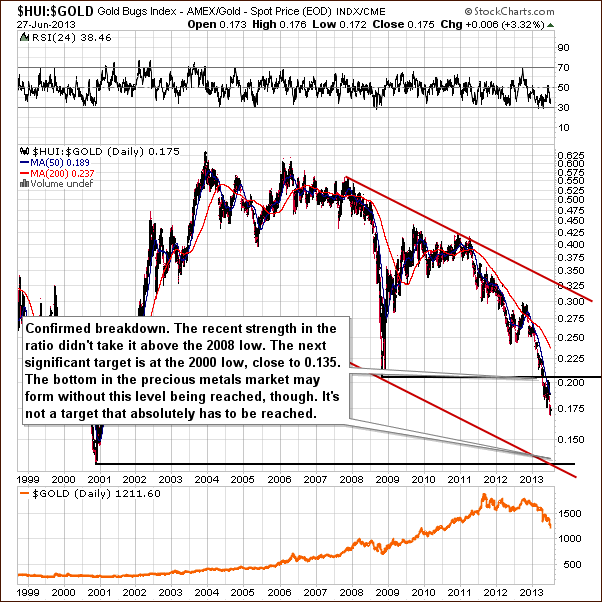
In the gold stocks to gold ratio chart, analysis of the ratio does not support the bottom being anything more than a local one. We saw a major breakdown here followed by a pullback and further declines. The ratio did not reach important lows just yet. The next major low which is likely to be reached is the late 2000 value, and gold stocks are far from this level right now. It seems, therefore, that declines could continue even if a local bottom is seen shortly.
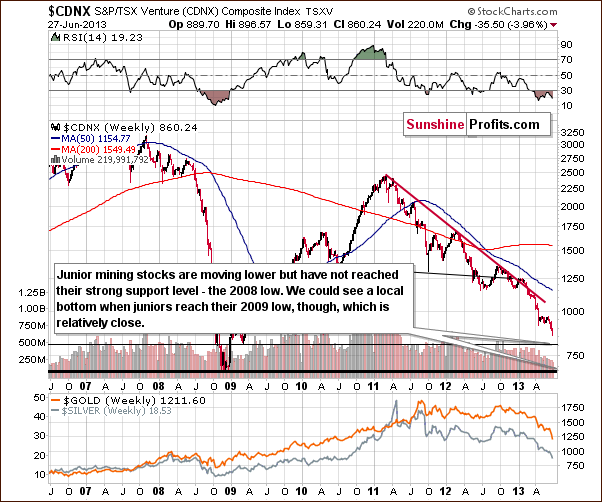
We now turn to the Toronto Stock Exchange Venture Index chart (which is a proxy for the junior miners as so many of them are included in it). We don’t see much improvement here either as the juniors have declined after some consolidation. It seems that a support line based on the early 2009 low could stop declines for a while. This may or may not turn into a final bottom, but it seems that at least a local one could form at this level.
Summing up, it seems that the mining stocks have not yet formed their final bottom but appear close to a local bottom. Few details can be inferred this week based on our mining stock analysis. We believe that focusing on gold and silver is the key at this time.
Letters from Subscribers
Q: sorry i looked at the link and it is all very general. what i want to know is how do i describe the below to my broker so that i can place the following distant orders
Gold: $1,120 (stop-loss: $970) - is this GLD ETF? and is there a series/date? i would like to buy equivalent to 100 ozs
Silver: $16.20 (stop-loss: $14.4) - same as with SLV ETF?
$HUI: 155 (stop-loss: 137) - i know this is an index so do i ask to put an order for the HUI index? how many?
thanks
A: First of all, please note that we divide the capital into three sections: insurance, investment, and trading. You will find details gold portfolio report. The long-term investments that we refer to in our alerts mean something that you will likely hold for a long time, more than 6 months or so (or at least you plan to). Trading is just that - speculation in which we aim to profit on short- or medium-term price swings. There are different ways to purchase gold or make money on its price moves. We have constructed a in which you can filter for both investment and speculative vehicles. As you can see, in case of long-term investments, purchasing physical metal is preferred - gold bars. There are other methods though and you can see how appropriate they are right in the ranking.
You may not be able to purchase gold bars directly from your broker but there are multiple other ways to do so. You can click on the gold bars link in the ranking for more information.
You can't buy the HUI Index, that's just a basket of stocks. You could purchase shares of an ETF that invests in mining stocks (already diversified), like the GDX ETF or NUGT if you're looking for leverage.
Q: I like you to look at a stock on the London Exchange SolGold due to commence drilling shortly has a very attractive gold copper porphyry deposit.
A: While we are not officially recommending this security, the company looks favorable also from the technical perspective. It looks like something that got beaten up so bad in the previous years that nothing more can damage the stock price - which is good, because the stock is in strong hands that are not willing to let go even though the precious metals sector is moving much lower now.Here's one of the websites where you can examine the chart - note that the price bottomed in April and pulled back strongly afterwards. It's now more or less where it started the year, which very few mining companies can state.
Summary
The USD Index has been rallying sharply recently and the rally is actually symmetrical to the previous decline. At this time, a pause is possible but additional rally would not surprise us and it actually seems more likely than the pause. In any case, further moves to the upside seem probable sooner or later based on the long and medium-term trends. This makes the outlook for the precious metals sector bearish.
Higher prices in the general stock market may have contributed to the better performance of silver and mining stocks relative to gold on Thursday. We doubt that it is any meaningful pattern or the beginning of a bigger rally – at least one day of strength doesn’t suggest much given the size of the decline so far. Strength in the general stock market is a signal to other markets that the economy is improving, there is no need to panic, everything is under control, and gold is a seemingly unnecessary asset. This approach contributes to lower gold prices regardless of whether it’s really the case or not.
Analysis of charts this week provides us with price targets for gold and silver relatively close to current levels but still a bit lower:
Gold: $1,160
Silver: $17.30
At the same time we continue to think that the appropriate price levels for trading orders are: $1,175 and $17.60. At these price levels we suggest exiting the short positions in gold, silver and mining stocks and opening a long position in them – but only a small one (with 1/3 of the profits that you made on the short positions or so). This coming long position will be a speculative bet on the pullback.
The situation in mining stocks is a bit unclear with respect to determining target prices, so it seems best to focus on gold and silver instead.
Please note that we will also suggest moving back to the long side of the market with half of one's long-term silver investments if silver moves to $17.80. We will send a separate confirmation to get fully back in.
Long-term investments:
Trading – PR: Short gold, silver and mining stocks. Extra position.
Trading – SP Indicators: No positions: SP Indicators suggest long positions but the new self-similarity-based tool suggests short ones for the precious metals sector and we think that overall they cancel each other out.
Long-term investments: Half position in gold, half position in platinum, half position in mining stocks. No positions in silver.
| Portfolio's Part | Position | Stop-loss / Expiry Date |
|---|---|---|
| Trading: Mining stocks | Short | 262 (HUI), $28.20 (GDX) / - |
| Trading: Gold | Short | $1,383 / - |
| Trading: Silver | Short | $22.55 / - |
| Long-term investments: Gold | Long (half) | - |
| Long-term investments: Silver | No position | Buy half at $18.20 |
| Long-term investments: Platinum | Long (half) | - |
| Long-term investments: Mining Stocks | Long (half) | - |
This completes this week’s Premium Update. Our next Premium Update is scheduled for Thursday, July 4, 2013, one day earlier than normal due to the holiday.
Thank you for using the Premium Service. Have a profitable week, a great weekend!
Sincerely,
Przemyslaw Radomski, CFA


