- Euro & USD Indices
- General Stock Market
- Crude Oil
- Correlation Matrix
- Gold
- Silver
- Mining Stocks
- Letters from Subscribers
- Silver winning India's war on gold
- Portfolio structuring/allocation
- Short selling
- Summary
The people of India love gold, a fact that is giving the Indian government a major headache. Gold is the country’s largest foreign import after oil and it equals a third of the world’s annual supply. And with price falling recently, the people in India and other countries in Asia are lining up to buy.
Just yesterday the gold prices plunged below $1,300 an ounce to levels not seen in more than two years, with investors spooked after the Federal Reserve signaled it may reduce the amount of monetary stimulus it provides as early as this year. The latest fall in the price will bring out more buyers looking for a bargain. These are long term investors who want to buy and hold.
The way Indian economists see it, India is sending billions of its hard cash dollars overseas to bring gold to decorate the wrists of Indian brides while at the same time driving down the value of the rupee. As they see it, oil, unlike gold, is an essential commodity that fuels industry.
India’s account deficit is 5.4 percent of GDP, about double what economists recommend.
Traditionally Indians tend to buy gold at certain festivals. In the first half of May, which coincided with the Akshaya Tritiya festival, the second biggest gold buying holiday, they bought $135 million worth of gold. In the second half of May, that figure fell to ”just” $35 million.
The India government’s appeal to its citizens to stop buying gold is falling on deaf ears. The tradition for gold is too ingrained and Indians live in a tradition-bound society. In addition, Gold provides a means of savings for many of India's 1.24 billion people who live in villages that are not served by banks. Only about 36,000 of India's 650,000 villages have a bank branch. Gold coins and jewelry are the most convenient way to save and invest.
It looks like China is bound to import as much as 1,500 ton of gold in 2013 which is more than half of total annual global mined production based on figures for the first four months of the year. In addition, China is also the world’s largest producer of gold, keeping all its production at home.
The spectacular demand in China and India has received a lot of media attention, but there are other countries in Asia that have seen stellar demand as well. Virtually the whole of South East Asia is predisposed towards holding gold as long term wealth protection. In Vietnam, for example, people pay a high premium to buy the yellow metal, as much as $217 per ounce over spot. The Vietnamese Central Bank has been selling gold on the market to satiate the demand and ease the pressure price.
Like their counterparts in China and India, the Vietnamese, who have experienced war and a totalitarian regime, view gold as a store of wealth and protection against hard times. They even tend to quote property prices in terms of gold. In recent months, the Vietnamese stock market and property market have taken a hit and the local currency has been devalued, all these factors leading to record investment demand for gold.
All this brings up an interesting question. If it is possible that China will soak up 1,500 tons out of the 2,500 tons that are mined each year, are we heading towards a shortage? If we add to the Asia demand, central bank purchases and gold buying in the Middle East, we are likely approaching, or even exceeding, global annual physical gold production.
If that’s the case, it provides a solid floor for the price of gold and perhaps the stimulus for the next run up.
If you ever wondered if gold maintains its value over the years, decades, centuries, here is positive proof. London’s Christie’s offered for sale a solid gold bracelet that is estimated to be 3,000 years old, dating back to the Iron Age. It was discovered in what is now Portugal. The bracelet contains over 2.12 ounces, which would fetch about $3,000 at current prices. The bracelet sold for $805,000.
We are not suggesting that you wait 3,000 years to make profits on your gold.
Other than being an amusing anecdote, there is a lesson to be learned here. Gold was valuable then and it is valuable now. Can’t say that for paper money. The bottom line is that supply and demand for physical gold will ultimately set the market price for the metal.
To see what’s up ahead, we will now turn to this week’s technical portion with the analysis of the US Dollar Index chart (charts courtesy by http://stockcharts.com.)
USD and Euro Indices
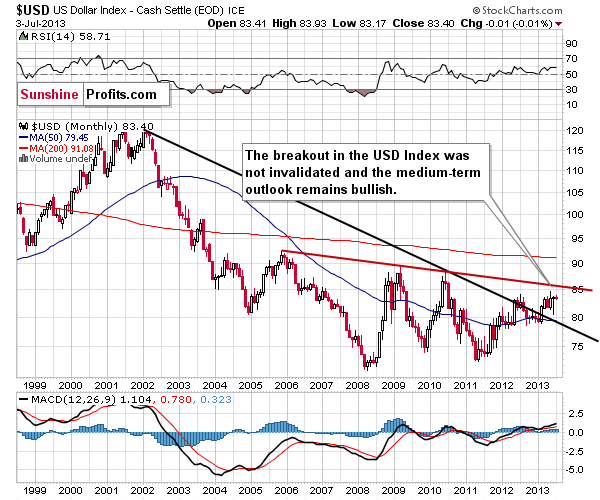
When we look at this long-term chart we see that the breakout was not invalidated. The rally continues and this chart is still bullish at this time. There is a resistance level at 86.4 and also another one which corresponds to the previous high and the latter will be seen more clearly in the next chart.
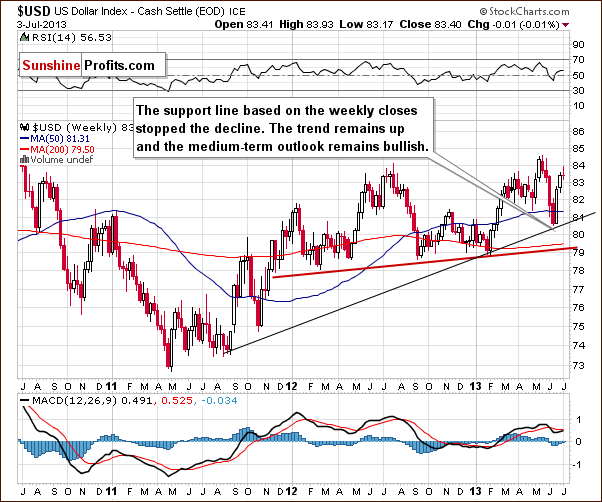
The support line was reached, and it held the decline so the medium-term trend remains up. Although there could be a pause around 84.5 (the 2013 high), the situation remains bullish for the USD Index in the medium term.
Now, let’s check to see if the short-time outlook is the same.
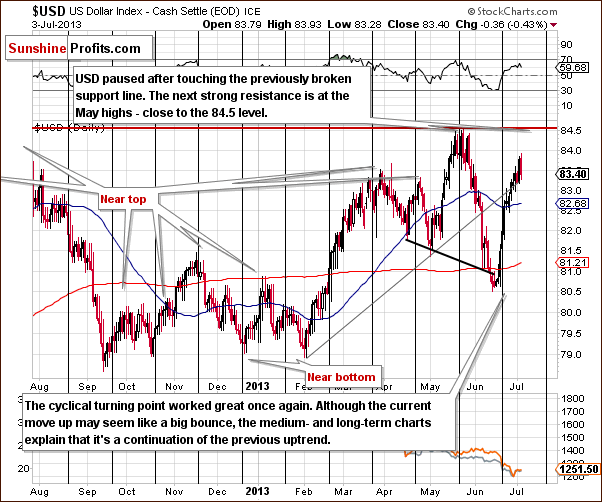
In this week’s USD Index short-term chart, we see the rally has continued. The upswing is pretty symmetrical with the preceding decline, and at this time, the current trends suggest a move higher in the USD Index - with small pullbacks - to the 84.5 level. After that, the next significant resistance is at the 86.4 level. In short, the dollar can continue to rally.
What implications could it have for the yellow metal?
Gold would likely decline given a move higher in the USD Index, but the strength of the decline and reaction to dollar's daily rallies could diminish, and we could see it become very weak in a few weeks. “Could” is the key word, because we don’t think this is the case just yet.
When gold reacts mildly to the dollar's rallies and sharply to dollar's declines, and moves to one of the important support levels while at the same time the USD Index is close to 84.5 or 86.4, we will have an excellent opportunity to enter long positions and to perhaps get fully back in with one's long-term precious metals investments. It seems quite likely that we will see the above scenario unfold, and we will send you a buy alert at that time, but – again - it’s not the case just yet.
Now let’s move on to the analysis of the Euro Index.
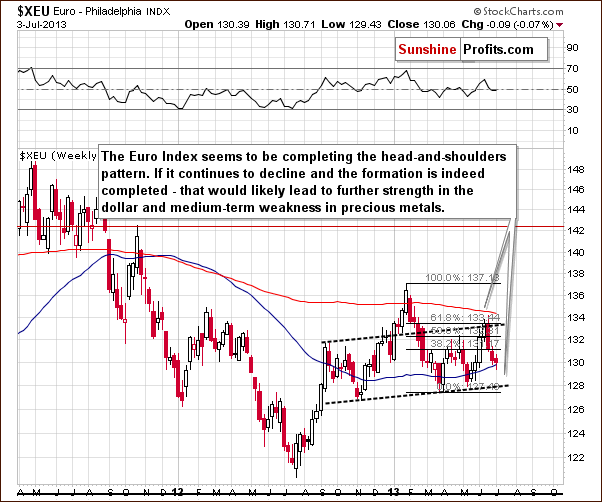
In this week’s Euro Index chart, we see that the head-and-shoulders pattern remains in place. The Euro declined once again this week, and it seems to be completing the pattern. The chances for this formation being invalidated are lessening. If the European currency continues to decline and the formation is indeed completed, this would likely lead to further strength in the U.S. dollar and medium-term weakness in precious metals. From this point of view, this chart is still bearish.
Summing up, the long-, medium-, and short-term outlooks for the dollar remain bullish. When gold reacts mildly to the dollar's rallies and sharply to the dollar's declines, and when gold also moves to one of the important support levels and at the same time USD Index is close to 84.5 or 86.4, we will likely have an excellent opportunity to enter long positions.
General Stock Market
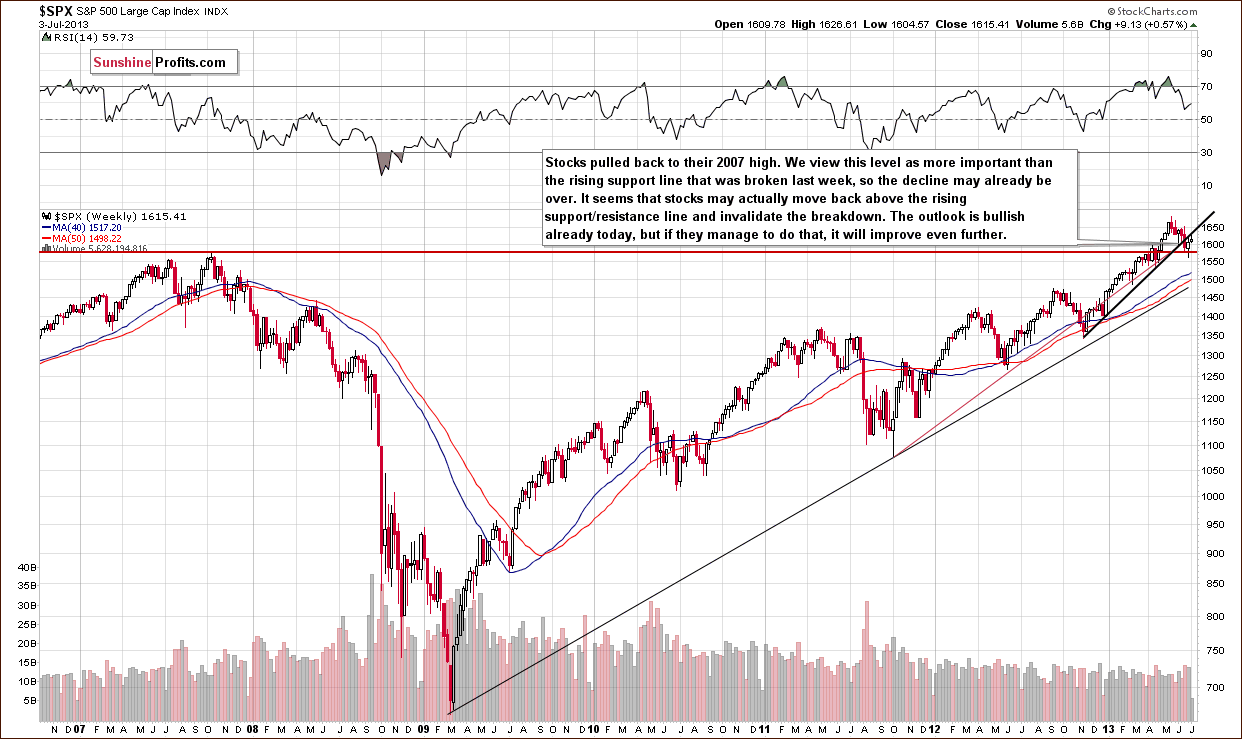
On today’s long-term S&P 500 chart, we see that stocks broke the rising support line last month and declined below the 2007 high. Although stocks failed to hold above these two levels, we expected the recent decline to be nothing more than another correction. The fact that it was deeper than the previous one doesn’t change the overall picture of the market. The situation for stocks is pretty much unchanged, and the implications for gold continue to be bearish.
We turn now to the financial sector which in the past used to lead the rest of the general stock market.
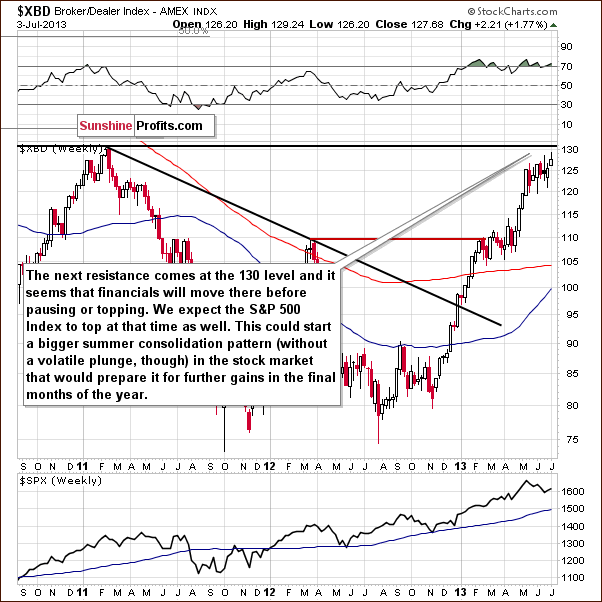
In this week’s Broker-Dealer index chart (proxy for the financial sector), we see that we may see a pause in the rally in the financials and in other stocks as well (financials used to lead other stocks) The RSI indicator that has been – with small pauses – overbought for months, so this doesn’t provide us with significantly bearish indications, however the financials almost reached their next resistance slightly above the 130 level. Once they reach this level, a pause seems quite likely, as the current rally is quite significant and no market can move in a straight line up or down without corrections. This could also start a bigger consolidation pattern in the stock market.
Summing up, the situation for stocks in the long term is quite bullish, and the implications for gold continue to be bearish. However, it seems that we could see a regular consolidation in the summer months, which is in tune with the seasonal patterns for the stock market. If you want to keep up with the current stock market situation, we invite you to read our daily stock commentary.
Crude Oil
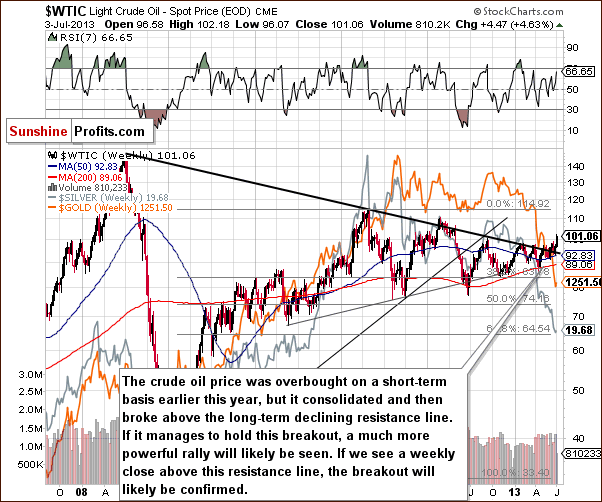
In this week’s chart, we see that crude oil broke above the long-term declining resistance line. We have seen the same situation play out several times now as for more than a year substantial price rallies have been followed by declining prices instead of a break out. Consequently, it seems best to wait for the true breakout’s confirmation. If we see a weekly close above this resistance line, the breakout will likely be confirmed. In this case a much more powerful rally will likely follow.
Gold and Silver Correlations
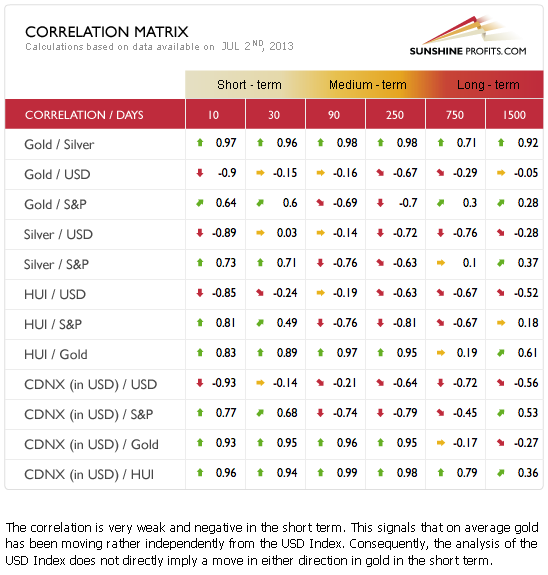
The Correlation Matrix is a tool which we have developed to analyze the impact of the currency markets and the general stock market upon the precious metals sector, (namely: gold correlations and silver correlations). Of particular interest this week are the short and medium-term correlation values between the precious metals and the USD Index. They are really quite neutral, but in the very short term (last two weeks – 10 trading day column) they are strongly negative. This illustrates that overall the correlations are unclear because gold used to follow the rallies of the dollar but didn’t really respond to the dollar’s recent daily declines, that is, it didn’t rally.
This actually did change a bit in the past few days but not enough to really impact even the reliable short-term coefficients (the 10-day correlation is not really reliable, that’s just an indication in which the correlation may change). This means that gold’s reaction to the USD Index should still be viewed as bearish. Gold’s normal reaction in the last few days does not change the situation just yet. The overall implications here remain bearish for the precious metals sector.
Gold
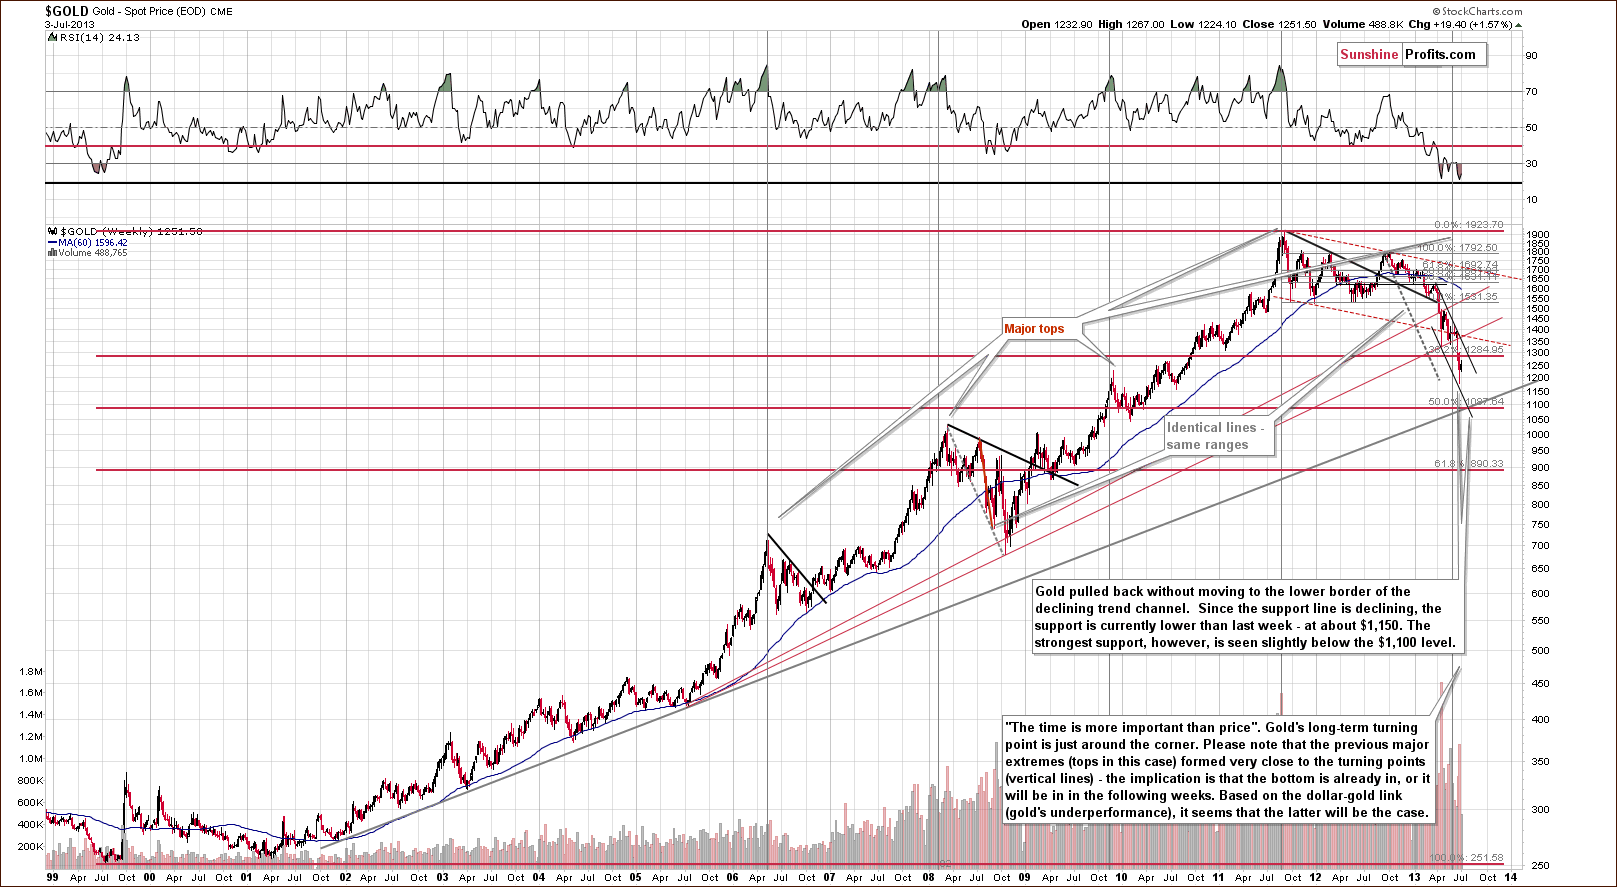
In this week’s very long-term gold chart, we see that prices moved close to the lower border of the declining trend channel. This price level was not quite reached, but gold’s price is very close to it, and it seems that prices will decline once again. Gold has been trading sideways below an important resistance line, the first Fibonacci retracement level, verifying this breakdown. With a verified breakdown and the declining trend channel in place, we have a bearish outlook at this time.
Gold could initially decline to the lower border of the trend channel and if it does, a pullback will likely follow. The most important support line for gold is slightly below $1,100 where two major support lines intersect. These are the very long-term support and the 50% Fibonacci retracement level for the entire bull market. So, at this time, this chart remains bearish for the short term.
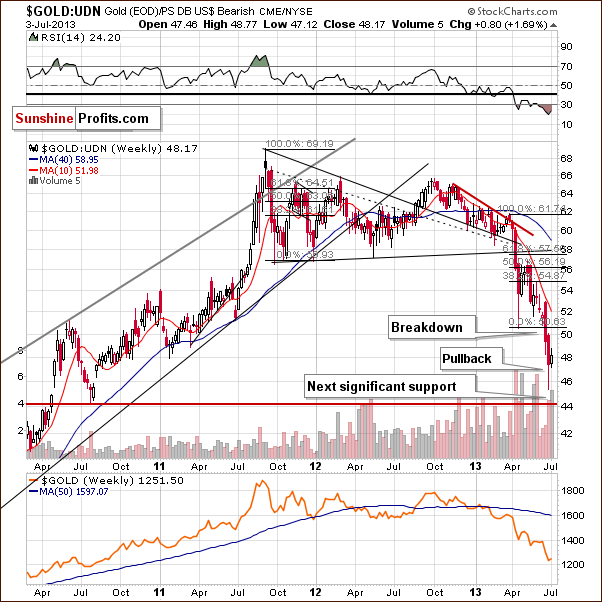
Gold viewed from the non-USD perspective showed very little change this week as prices moved higher, then lower, and are within 2% or so of where they were a week ago. No significant support level has been reached, so declines could very well continue here.
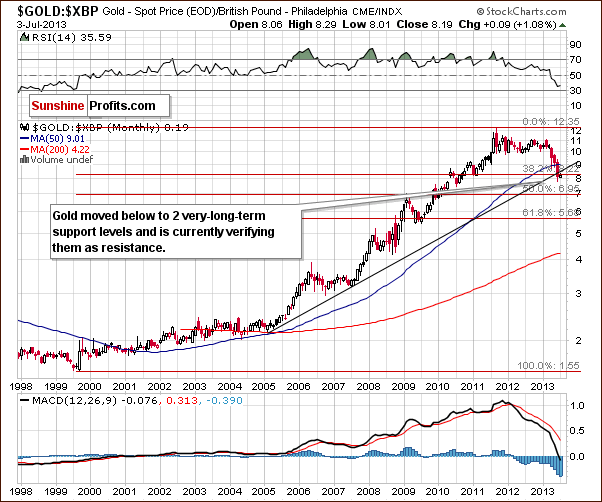
Gold priced in British pounds reveals a double breakdown recently. This is a breakdown below two important support levels, in this case the rising long-term support line and the first Fibonacci retracement level on the full bull market.
This is an important breakdown and, at this time, the next significant support line is slightly below the 7 level in this chart. Clearly another significant decline could be seen here. This is similar to what we saw last week when gold moved lower, and we could see a similar move once again later on in the month.
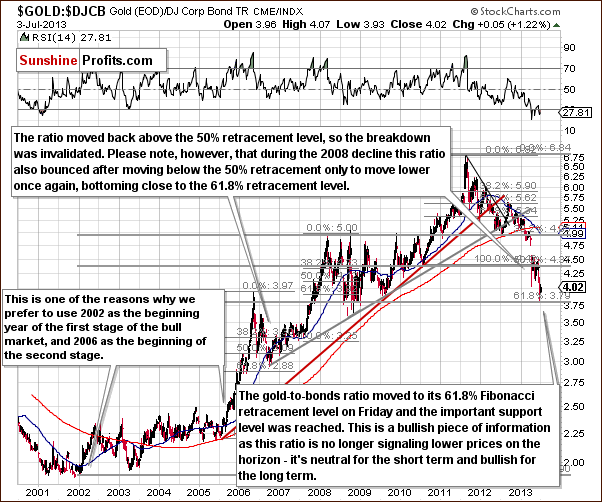
In the gold to bond ratio chart, we see that the ratio has declined to the 61.8% Fibonacci retracement level last week, and this provided us with a bullish indication. This was the level which marked a local bottom in the past, but it may not be the final bottom this time as the ratio moved temporarily below this support line before reaching a final bottom back in 2008 and this is the decline that can be compared to the current one in many ways (think gold stocks). The point is that this chart is no longer clearly bearish but rather neutral to bullish.
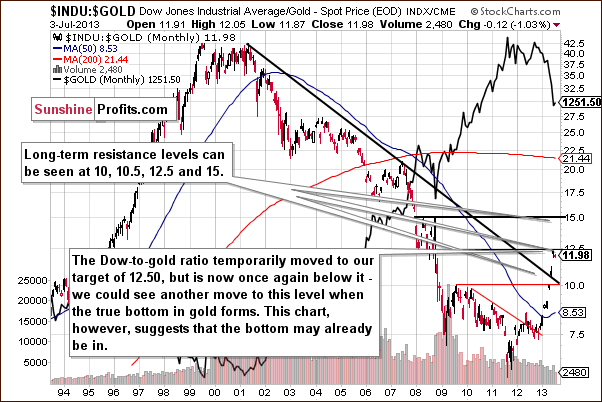
The Dow to gold ratio chart shows us much of the same as a resistance level has already been reached so we no longer have a bearish situation. It is more neutral, and we could see the ratio move to this level once again.
Summing up, gold pulled back this week but the move to the upside did not invalidate the most important resistance levels. The outlook and trend remain bearish for the short term. The immediate-term could see some strength, but with support lines relatively far away, the next big move will likely be to the downside.
Silver
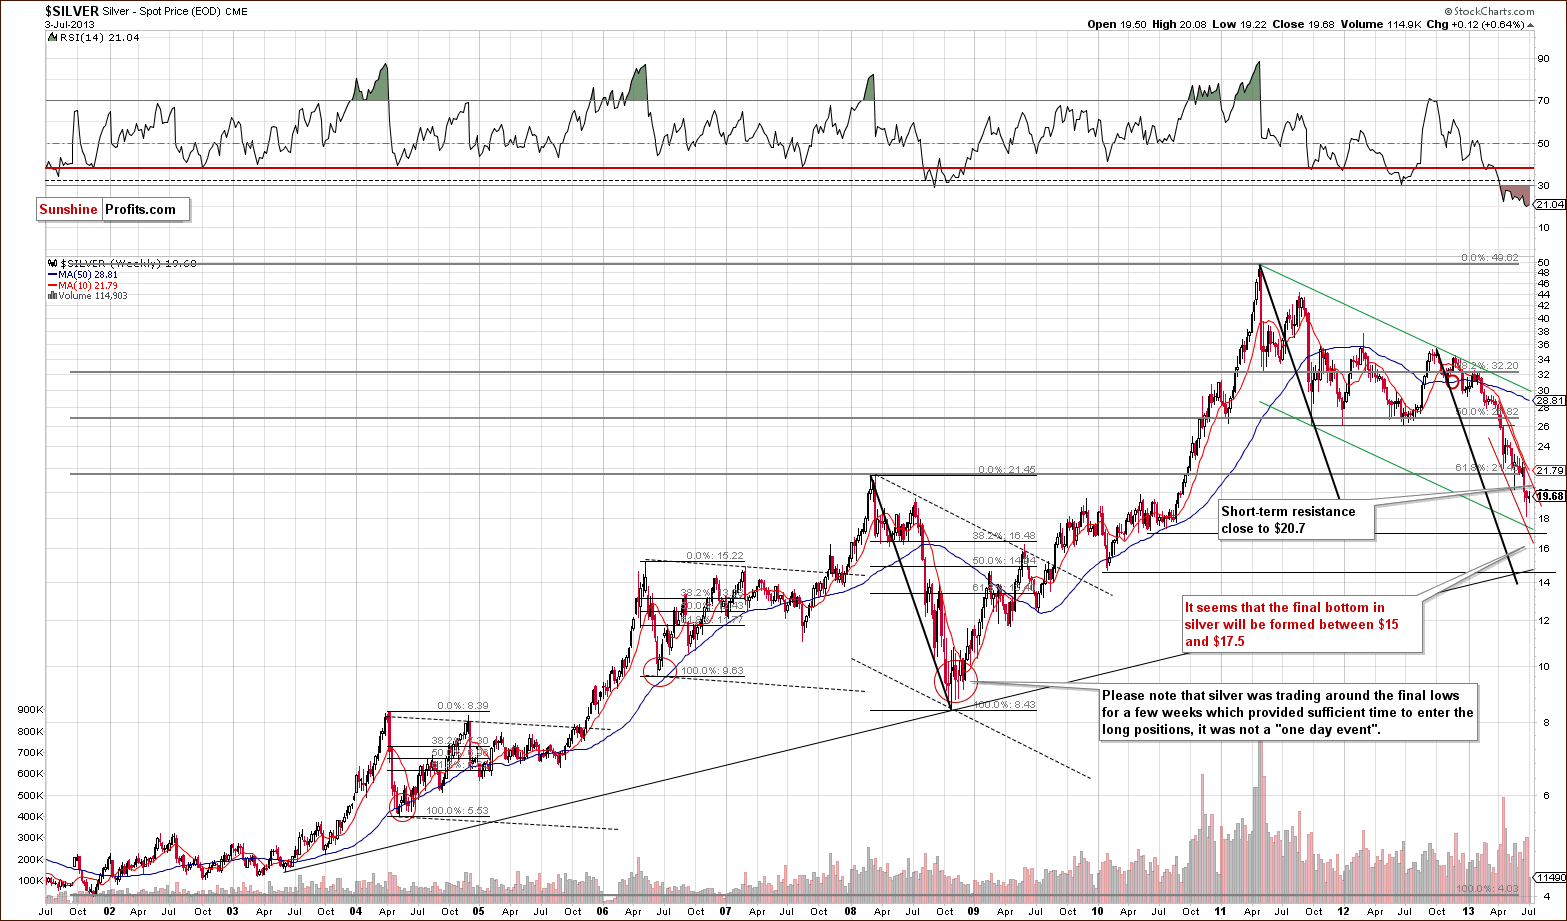
In this week’s very long-term silver chart, we see price action similar to what we saw this week in the gold market. Last week, silver’s price was close to the declining support line but did not reach it. There was a pullback, but the pullback was not significant, and it definitely did not take silver above any resistance line. It’s not even back above the psychologically important $20 level.
The downtrend will remain in place here and will remain so unless silver can rally and hold a breakout above the $20.70 price level. We do not expect to see this. This week has also been another week where the intra-day highs were once again lower as has been the case for months.
Based on the current levels of various support lines, it seems that the next bottom will be seen somewhere between $15 and $17.50. This is where several support lines are located. Much depends on where gold will be and which support line silver is close to when gold approaches its support line which is just below $1,100. For this reason, the silver picture is somewhat unclear at this time, but still bearish.
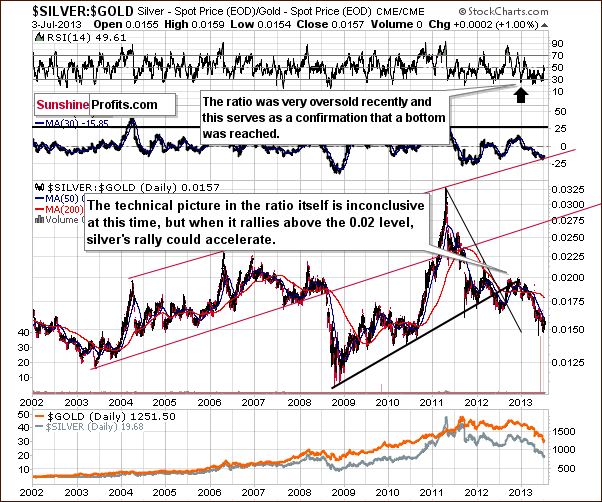
In the silver to gold ratio chart, no confirmation of a bottom being in has been seen, that is, no significant underperformance of silver relative to gold.
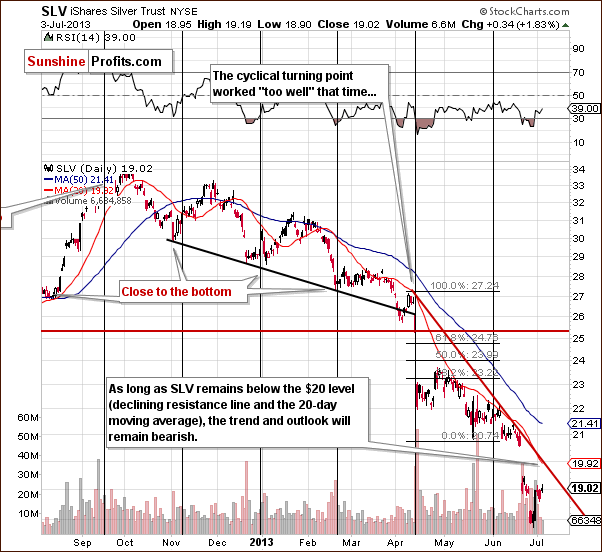
In this week’s medium-term SLV ETF chart, we see that on a short-term basis, even the short-term resistance lines have not been reached. Silver could double its recent rally and not invalidate the downtrend.
Summing up, the outlook remains bearish for the white metal even though some strength has been seen recently. In previous cases, the final tops in the whole precious metals sector before strong declines were characterized by daily rallies in silver which were exceptionally significant relative to gold. If this is seen once again, perhaps it will signal another shorting opportunity. We will keep you informed as this situation develops further.
Gold and Silver Mining Stocks
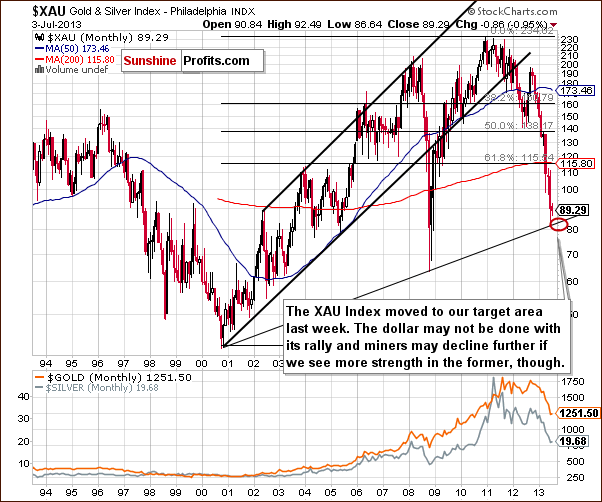
In this week’s XAU Index chart, we see that the initial target area has been reached and the apparent local bottom which has formed just may not be the final one. Prices could go lower but probably not much more as we don’t expect the index to move past the level of the 2008 low.
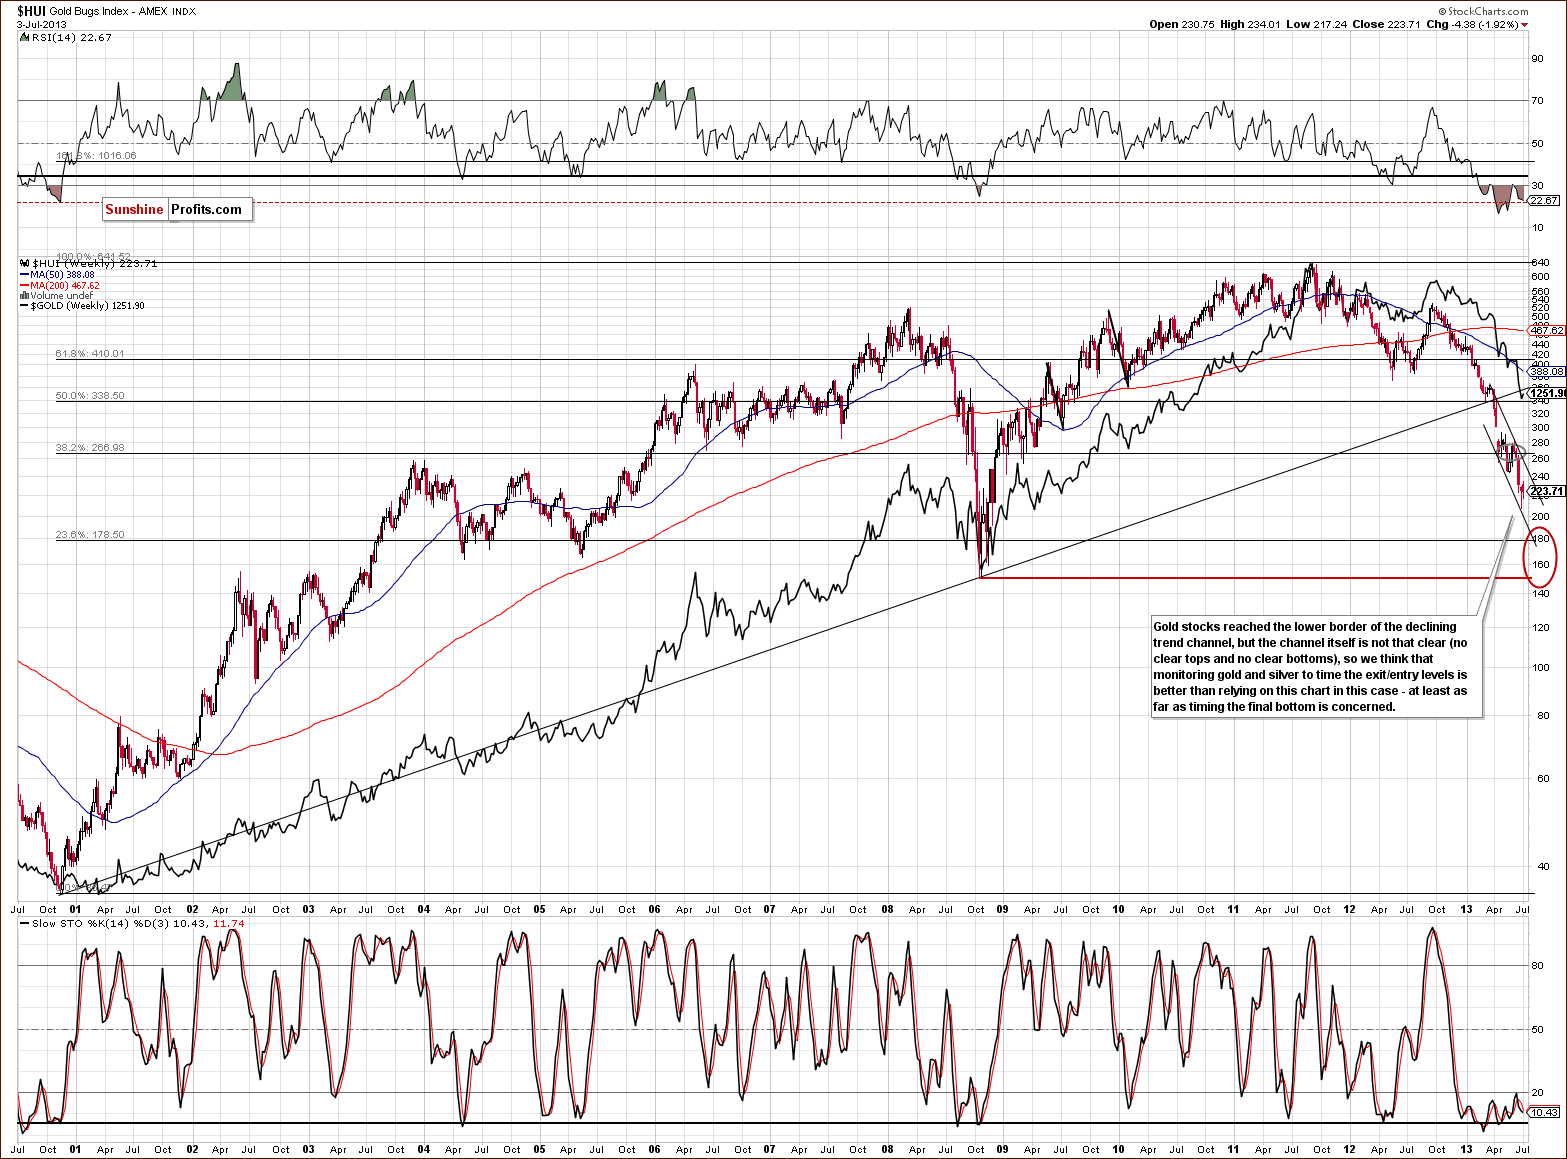
In this week’s very long-term HUI index chart, we can see that the final bottom will probably form close to or slightly above the 2008 low as indicated by our red ellipse. Not much changed this week and declines remain in place. The downtrend will continue as long as the index is below the 250 level or so. It is clearly well below this level today.
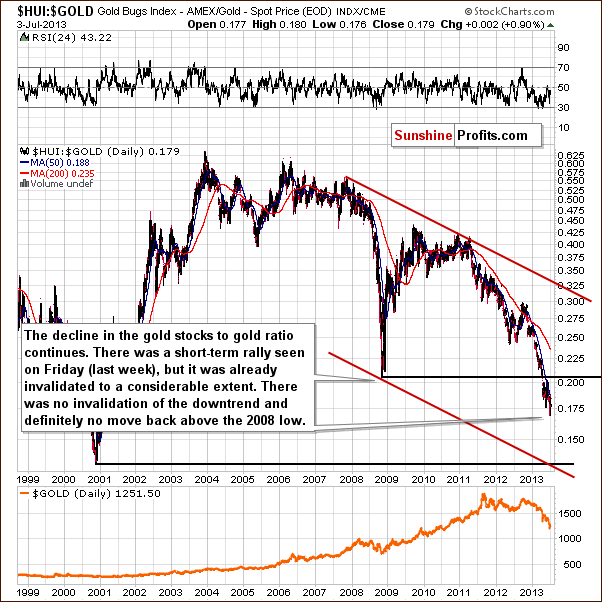
In the gold stocks to gold ratio chart, we see the ratio moved higher last week but lower this week. Overall, the downtrend remains in place here as we have seen no significant bullish indications.
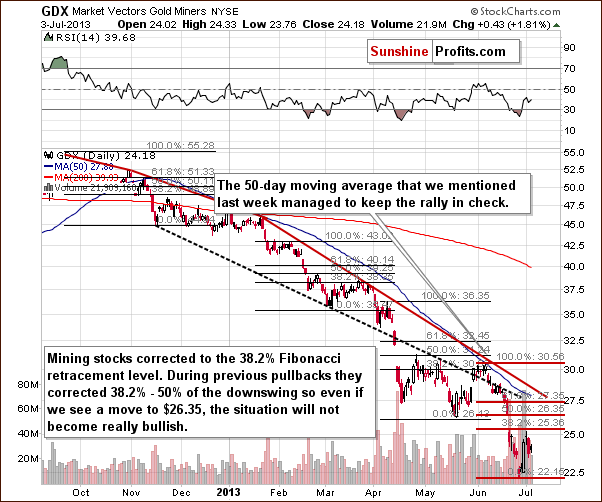
In this week’s short-term GDX ETF chart, we see that last week’s pullback was only to the first Fibonacci retracement level. Prices are close to this level now and at times approached the 50% level. With this tendency in place, a bigger move lower is still probable even though we could see some very-short-term strength first. As long as GDX remains below $26.35, the downtrend will remain in place. Perhaps the next move to the downside will be the final one.
Summing up, the outlook for mining stocks remains bearish for the short term but perhaps some strength will be seen in the very short term (the next few days). It seems that the next big downswing might be the final one for this decline.
Letters from Subscribers
Q: This new import data shows that the victor in India’s “War on Gold” – will be silver.
A: It might indeed be the case that silver benefits from the increased import tax on gold in India. Silver is closely tied to gold in both monetary (both were used as money throughout history) and technical (they tend to move together) terms. Therefore, when purchasing gold becomes more expensive due to taxation, part of the demand will likely move to the silver market. People will be looking for a "cheaper proxy" for gold and silver fits in quite nicely. Plus, silver has a lot of industrial uses and a great fundamental outlook on its own.
Q: Dear Sir, Thanks for your outstanding services. I really need to know how to use Position Size calculated. But for some unknown reason, neither my desk PC (Window 7) nor my iPad could open the calculator. Could you please just give me an simple answer. For example, I have $200 k would like to buy gold. My plan is to keep $100 k in cash, and to be long $700,000 in Gld, and $300,000 in 2x long gold, e.g. Ugl. Is is ok. I have not put the money in the market yet, am waiting your signal and Alert. Or, please help me to know how to "Allocate" this fund. I am retired, and do not need this $200 k to live on. Thanks.
A: Generally, the Position Size Calculator is dedicated to purchasing options and it seems that it's not what you intend to do.
As far as portfolio structuring/allocation are concerned, our approach (you can read more about it in our gold portfolio report) assumes dividing capital into three parts. First - insurance. Physical gold/silver that you own in case of severe financial turmoil. Second - long-term investments. This is the core of the portfolio in most cases - we currently suggest being in with half of one's long-term investments (if one doesn't have any gold as a long-term investment, we suggest purchasing it). The third part of the capital is the trading capital and cash. We think that diversifying between investments and trading is a good thing to do, however at this time we are not suggesting any speculative position for gold.
While we can't provide investment advice, one general suggestion that we have regarding the long-term investment position is to consider diversifying into platinum (we suggest being in with half of the position in this case) and silver.
Q: Hello, I like your site, but I need to better understand shorting before I would be comfortable subscribing since if I get advice to short something, I need to know how to short a stock in the first place. Can you recommend a good book about it? As an aside, I think that unfortunately, good shorting opportunities in precious metals might be over for a long time. I was opportunistic enough to start investing in the precious metals sector since the late 1990's and have been long ever since. I painfully watched it decline in 2008, and then recover and go higher, and also the recent downturn. My gosh, if I would have known to sell and then buy back, if only for the mutual funds. I'm not even talking about selling at the exact bottom, but within 10% or so. But be that as it may, there is not doubt to me that it won't recover again and go higher. But it would be nice to understand shorting and have expert advice from you on deciding the right time for it. Thanks & Regards
A: We don't have a book to recommend, but we have a definition of short selling in our Dictionary section that you might find useful.
Generally, if you call your broker and tell them that you'd like to short something they should explain how to do it technically on their platform/account. The easiest way to do this is to purchase ETFs/ETNs that short something. You simply buy a share of such an ETF or ETN and see it appreciate if the underlying asset declines in value. For instance, DUST is such an ETN - it's a proxy for shorting gold mining stocks with 3x leverage.
Please note that we have an ETF/ETN Ranking that you can use- there's a column that allows you to see the funds useful for shorting.
Finally, we don't specialize in shorting precious metals - far from that. We are long-term silver and gold fans (not fanatics, though) that realize that gold has to correct too at times and we have nothing against profiting on these declines, which is what we have been doing recently.
Feedback: P.R. GREAT WORK. Not just with this bearish call, but also getting people out near the bottom. It is very easy to look at the gold chart after a huge decline and think that would be easy to predict. None of this is easy. You have created a whole new tool that is currently working vs the old tools you use to use. Most people just would have stayed the course and got killed. CONGRATS ON YOUR HARD WORK AND POSITIVE RESULTS
A: Thank you! We hope to serve you even better in the coming weeks.
Summary
The USD Index paused recently as did the general stock market. At the same time, gold prices pulled back a bit. These developments did not change the previous relationships between these markets in our view. Gold remains anti-asset with significant leverage to the dollar, which means it is underperforming to the dollar to a considerable extent.
The recent higher prices for gold have not been validated yet, and the outlook remains bearish. The individual charts of gold, silver and the mining stocks suggest that the recent rally is nothing more than a pullback. No invalidations of significant resistance levels have been seen, and the short and medium-term trends remain down. Consequently, another shorting opportunity will likely be seen soon, in our opinion and we will keep you informed if it does indeed take place.
Trading – PR: No positions.
Trading – SP Indicators: No positions: SP Indicators suggest long positions but the new self-similarity-based tool suggests short ones for the precious metals sector and we think that overall they cancel each other out.
Long-term investments: Half position in gold, half position in platinum, half position in mining stocks. No positions in silver.
| Portfolio's Part | Position | Stop-loss / Expiry Date |
|---|---|---|
| Trading: Mining stocks | No position | - |
| Trading: Gold | No position | - |
| Trading: Silver | No position | - |
| Long-term investments: Gold | Long - half | - |
| Long-term investments: Silver | No position | Buy half at $17.80 |
| Long-term investments: Platinum | Long - half | - |
| Long-term investments: Mining Stocks | Long - half | - |
This completes this week’s Premium Update. Our next Premium Update is scheduled for Friday, July 12, 2013.
Thank you for using the Premium Service. Enjoy your July 4th celebrations honoring United States’ independence! If you’re not celebrating this week, we wish you excellent weekend anyway.
Sincerely,
Przemyslaw Radomski, CFA


