- Euro & USD Indices
- General Stock Market
- Crude Oil
- Correlation Matrix
- Gold
- Silver
- Mining Stocks
- Letters from Subscribers
- Will inflation be a problem
- Is there a big chance that some of the component companies in the HUI Index will go bust?
- Gold price turning points
- Shifting investment capital to trading capital
- Using options for long-term investments
- Gold seasonal factors
- Status of the work on the new self-similarity based tool
- Gold recent gap down, bottom, emerging markets
- Summary
Are the foundations for another gold bull market slowly falling into place?
Deutsche Bank said this Monday that gold's correction may be close to being over. While they still see Fed policy as a strong headwind against gold, "it is possible that the major part of the gold price correction has already occurred."
We generally agree as we believe (not a 100% belief, but that’s the most likely outcome in our view) that gold is likely to move to $1,090 or so before the final bottom is reached, we’re just not sure if it will happen with a whimper or a bang. Gold has come down over 30 % from its peak of around $1,900 an ounce in September 2011. Is there a possibility that the second half of the year will be better than the first? There is some historic basis for this hope. Gold demand was stronger in the second half of the year in nine of the last 12 years. Gold returned an average of 11 percent in the second half of the year since 2001, more than double the average first-half increase. Then again, the rallies didn’t use to really start until September, which gives several weeks for more declines without invalidating the seasonal pattern. In fact, given the current level of volatility, a few weeks can change a lot.
Currently it is COMEX that sets the global gold price. In the future it might be Shanghai. Since mid-February, about 550 tons of gold have flowed out of ETFs. The recent gold sell off shows a trend of gold moving from weak to strong hands, from West to East. Figures for net Chinese gold imports through Hong Kong in May show that China’s gold imports are still at unprecedented highs. Record levels were seen in April with 136 tons. The month of May clocks in at 109 tons. So far net imports through Hong Kong for the first five months of the year have totaled over 413 tons – double those of a year earlier when China imported just over 830 tons.
That China will become the world’s No. 1 gold consumer this year is a foregone conclusion. If imports continue near current levels, China is going to take in around 1,000 tons of gold this year through Hong Kong alone. The slowdown in the country’s economy could put a small dent in the continuing popular demand. However, early this week, the Chinese government said its consumer price index rose 2.7% in June. This was higher than expected. This is bullish for gold in China since gold is seen as an inflation hedge and the Chinese have a huge appetite for gold in the first place.
China’s own gold production from its mines exceeded 400 tons last year. This suggests that Chinese gold imports plus its domestic production will, this year, will account for over 50% of global new mined gold output, estimated at around 2,700 tons annually.
Increased demand from China is being offset somewhat by falling demand from India, where the government is doing its utmost to discourage gold acquisition by the Indian population. India, the biggest buyer, imposed curbs on imports to trim its trade deficit. According to the World Gold Council, India and China accounted for 62% of Q1 global jewelry demand.
Imports into Turkey, the fourth-biggest consumer, more than doubled to a 4 1/2-year high of 45.5 tons in April. They held above 43 tons in May and June, the longest run in data on the Istanbul Gold Exchange’s website going back to 1995. Jewelry represented about 60 percent of the country’s consumer demand for gold last year, according to the World Gold Council.
We have written previously about the possibility that global gold output could start to fall with mine closures and the deferment of new projects due to lower gold prices. Industry figures suggest that it costs about $1,200 on average to get an ounce of gold out of the ground. At current prices it doesn’t make sense for mining companies to keep digging up the yellow metal or to spend money in developing new mines. As they start to close existing mines, gold supply will fall off. Therefore, gold is not likely to stay below $1,200 for long without correcting. At the same time this doesn’t mean that gold can’t drop even below $1,000 on a very temporary basis.
Yesterday (Thursday) vital wage negotiations started in South Africa's gold mining sector, the outcome of which may determine the future of the entire industry with billions of dollars in exports and tens of thousands of jobs at stake. It has been a turbulent 18 months for South Africa's entire mining industry with workers across several sectors staging wildcat strikes. It was last August, when 34 miners were shot dead by police near Lonmin's Marikana platinum mine. The problems in South Africa may further exacerbate the problems facing the global gold supply in the future.
Here is a thought. According to a report released by the Federal Reserve last week, the M2 money supply is about $10.5 trillion. The amount of gold held by the United States government is approximately 260 million ounces. If you do the math, that comes out to more than $40,000 per ounce. It may take a while for the price to reach that target, though.
To be more realistic and to see what’s in store in the next week, let’s begin this week's technical part with the analysis of the US Dollar Index. We will start with the very long-term chart (charts courtesy by http://stockcharts.com.)
USD and Euro Indices
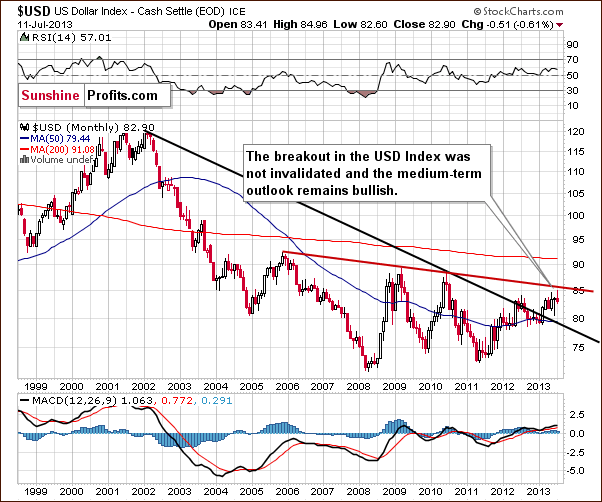
In the long-term chart we see that the breakout is still not invalidated. The U.S. dollar has continued its rally last week and reached above the previous high (it will be seen more clearly in the next chart). This long-term chart is still bullish at this time and the next resistance level is at 86.4.
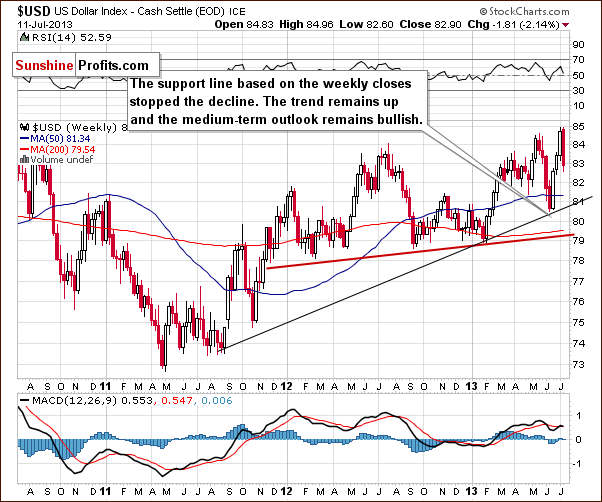
In the weekly U.S. dollar chart, we can see there was a breakout above the 2013 high. Although the breakout was invalidated, the situation remains bullish for the USD Index in the medium term, and we can expect the dollar to strengthen further in the coming weeks. The reason is that the medium-term support line was not broken – it was not even reached.
Now, let’s check to see if the short-time outlook is also bullish.
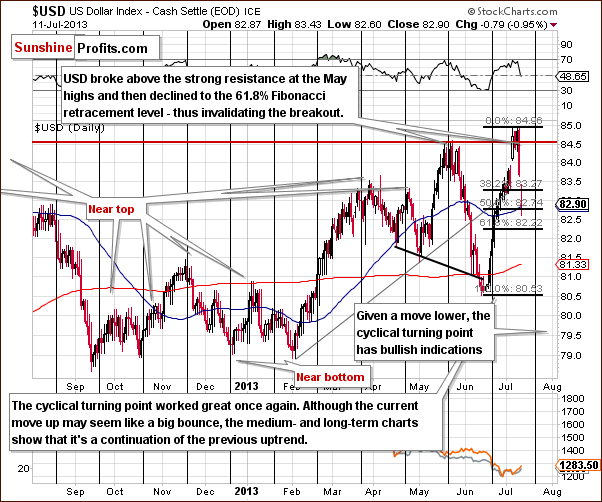
From the short-term perspective, we clearly see that the USD Index initially broke above the strong resistance level based on the May high. In the recent days, the U.S. dollar declined to the 61.8% Fibonacci retracement and the above-mentioned breakout was invalidated. Actually, on the above chart you don’t see a move to the 61.8% retracement, but the 50% one, which seems to be a result of some sort of data error as we recall seeing USD dropping below 82.5 and it’s not visible on the chart. Anyway, the implications are identical whether USD corrected to 61.8% or the 50% retracement.
Although the USD Index declined it seems to be just a counter-trend bounce, because the above-mentioned retracement levels kept the decline in check. We still expect the USD Index to move higher even though it may not happen immediately.
The cyclical turning point is now just around the corner, which – given the recent move lower – provides us with bullish implications.
Now let’s move on to the analysis of the Euro Index.
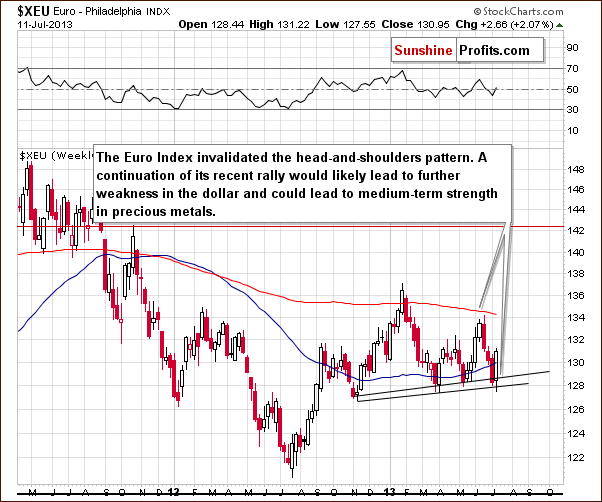
In this week’s Euro Index chart, we see that the euro invalidated the bearish head-and-shoulders pattern. An invalidation of a bearish signal is a bullish signal on its own, but then again, we already saw a substantial move higher so we don’t have to see another one based on this invalidation. In other words, the invalidation was likely to cause a rally, but we have already seen one.
If the European currency continues its rally, that would likely lead to further weakness in the dollar, which could (but doesn’t have to) eventually lead to medium-term strength in precious metals. At this point, however, the above picture is unclear in terms of implications and outlook.
Summing up, the long- and medium-term outlooks for the dollar remain bullish. From the short-time perspective, we see that the USD Index plunged, invalidating the previous breakout above the May 2013 highs. At the same time, the Euro Index invalidated the head-and-shoulders pattern. Although these changes should have had huge bullish implications for gold, the yellow metal didn’t rally significantly.
General Stock Market
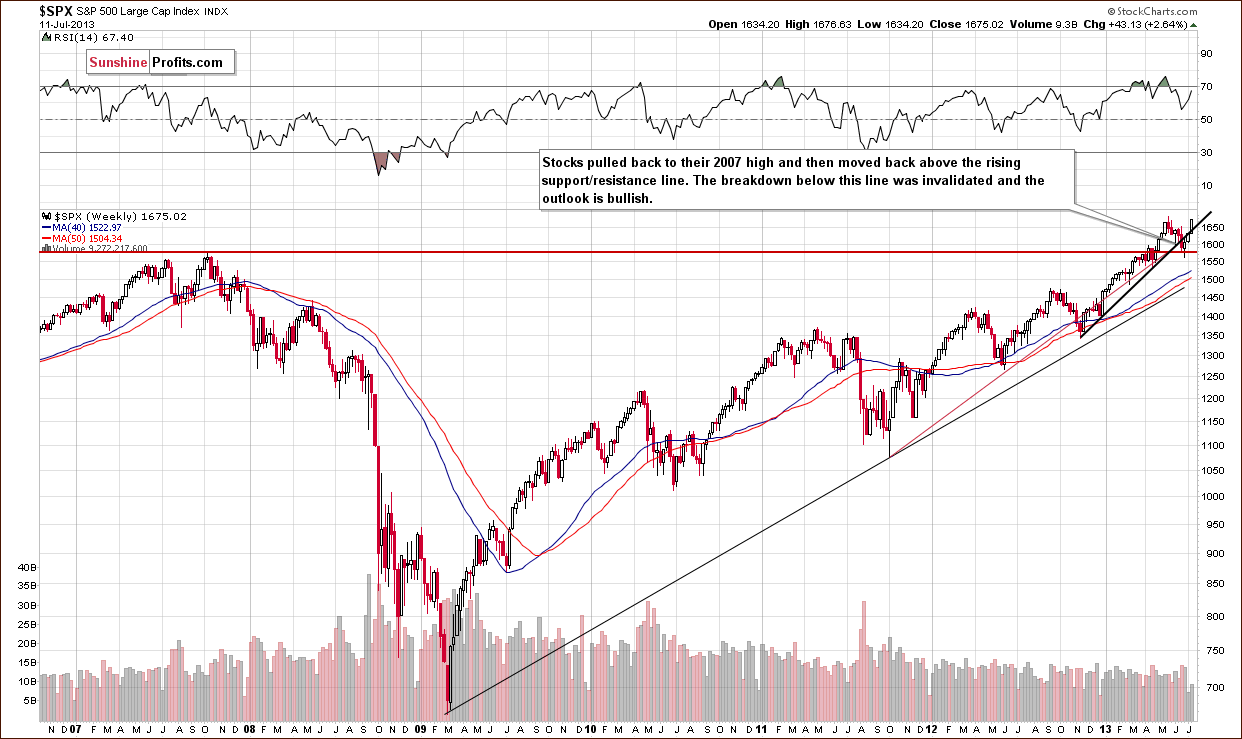
On today’s long-term S&P 500 chart, we see that stocks moved back above the rising support line, which means that the breakdown below this line was invalidated. The recent decline was likely nothing more than another correction and the outlook is still bullish.
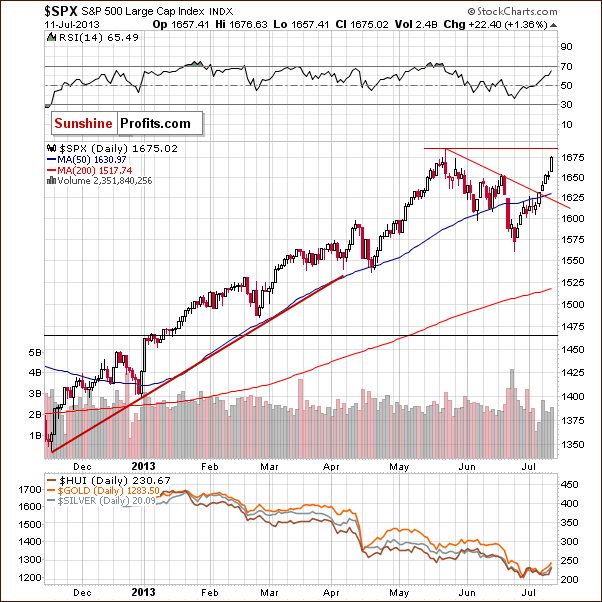
During the past week, the S&P 500 Index has continued its rally. On Monday, stocks broke above the declining resistance line based on the May and June tops. The following days brought further rallies. Another bullish factor was the breakout above November-May upward trend line. The price climbed up to the area of the June 18 local top, and the next resistance level is at the May 22 high.
We turn now to the financial sector, which in the past used to lead the rest of the general stock market.
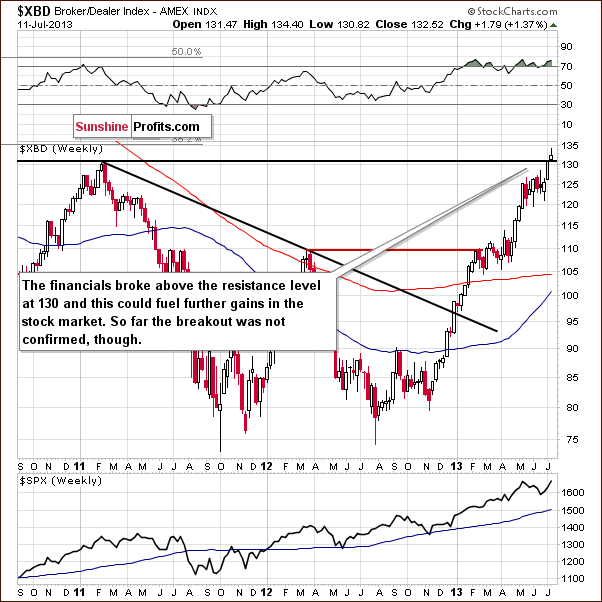
In this week’s Broker-Dealer index chart (proxy for the financial sector), we see that the financials broke above the resistance level at 130. This could fuel further gains in the stock market. So far the breakout was not confirmed, however, so the situation just slightly improved.
Summing up, the situation for stocks in the long and short term is quite bullish, and it seems that we could see further gains in the stock market. If you’re interested in short-term commentary on the stock market, please note that we have started publishing such in our Articles section.
Crude Oil
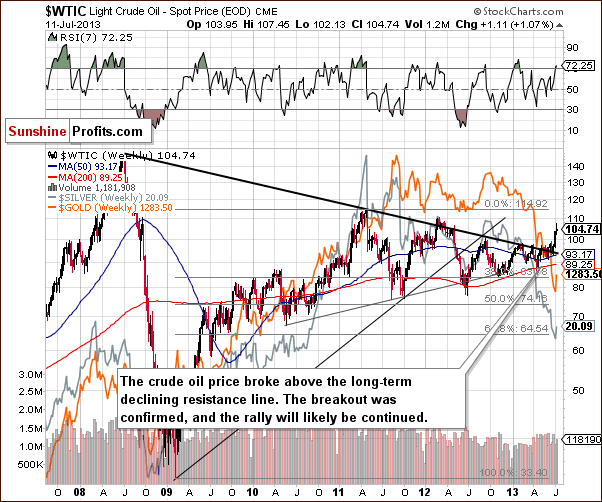
In this week’s chart, we see that crude oil clearly broke above the long-term declining resistance line. We saw a weekly close above this line, and the breakout was confirmed. From the long-term point of view, the rally is likely to continue.
Please recall that we wrote that gold could rally along with crude oil if the latter broke out decisively. Gold also failed to respond in a big way to this bullish factor, which, by itself is a bearish piece of information.
If you want to keep up with the latest developments on the crude oil market, you’ll find our articles on this market (usually 2 articles per week) in our Articles section.
Gold and Silver Correlations
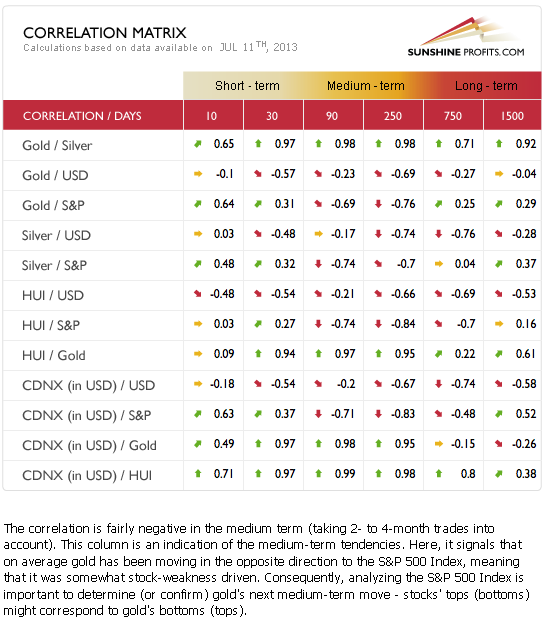
The Correlation Matrix is a tool, which we have developed to analyze the impact of the currency markets and the general stock market upon the precious metals sector, (namely: gold correlations and silver correlations). Beginning with the correlations between gold and the general stock market, we are reminded of a question regarding whether we felt gold was starting to trade along with the stock market. This may seem to be true this week, but we doubt if this will last. The very short-term coefficients are basically non-existent, the short-term are positive but weak, and the medium-term ones are negative and stronger than the short-term positive ones. The situation overall is mixed, but the negative correlations prevail in our view. It seems that if stocks rally in the medium term (which is likely), this will probably have a negative impact on the precious metals, not only for gold but also silver and the mining stocks (note analogous situation in the Silver / S&P and HUI / S&P rows).
The coefficients describing correlation between metals and the USD Index are negative but relatively weak in the short term. Gold is responding to some signals from the USD Index, but overall gold continues to underperform the dollar to a considerable extent. We saw gold moved higher when the dollar declined initially and also without the help of the greenback which was a somewhat positive sign. Nonetheless, as you have read in this week’s alerts, we remained skeptical as previously, gold was very oversold and likely to pull back anyway (so the gold-USD link might have nothing to do with it and a change in this relation was not the reason behind the move up), and it seems that our skepticism was correct. Thursday’s early trading and reaction during the day provided more proof of the metals’ weakness. The USD Index plunged dramatically on Thursday and gold, silver and mining stocks moved only a bit higher. Overall, we feel that the metals’ underperformance relative to the dollar remains in place, and the bearish outlook for the precious metals sector does as well.
Gold
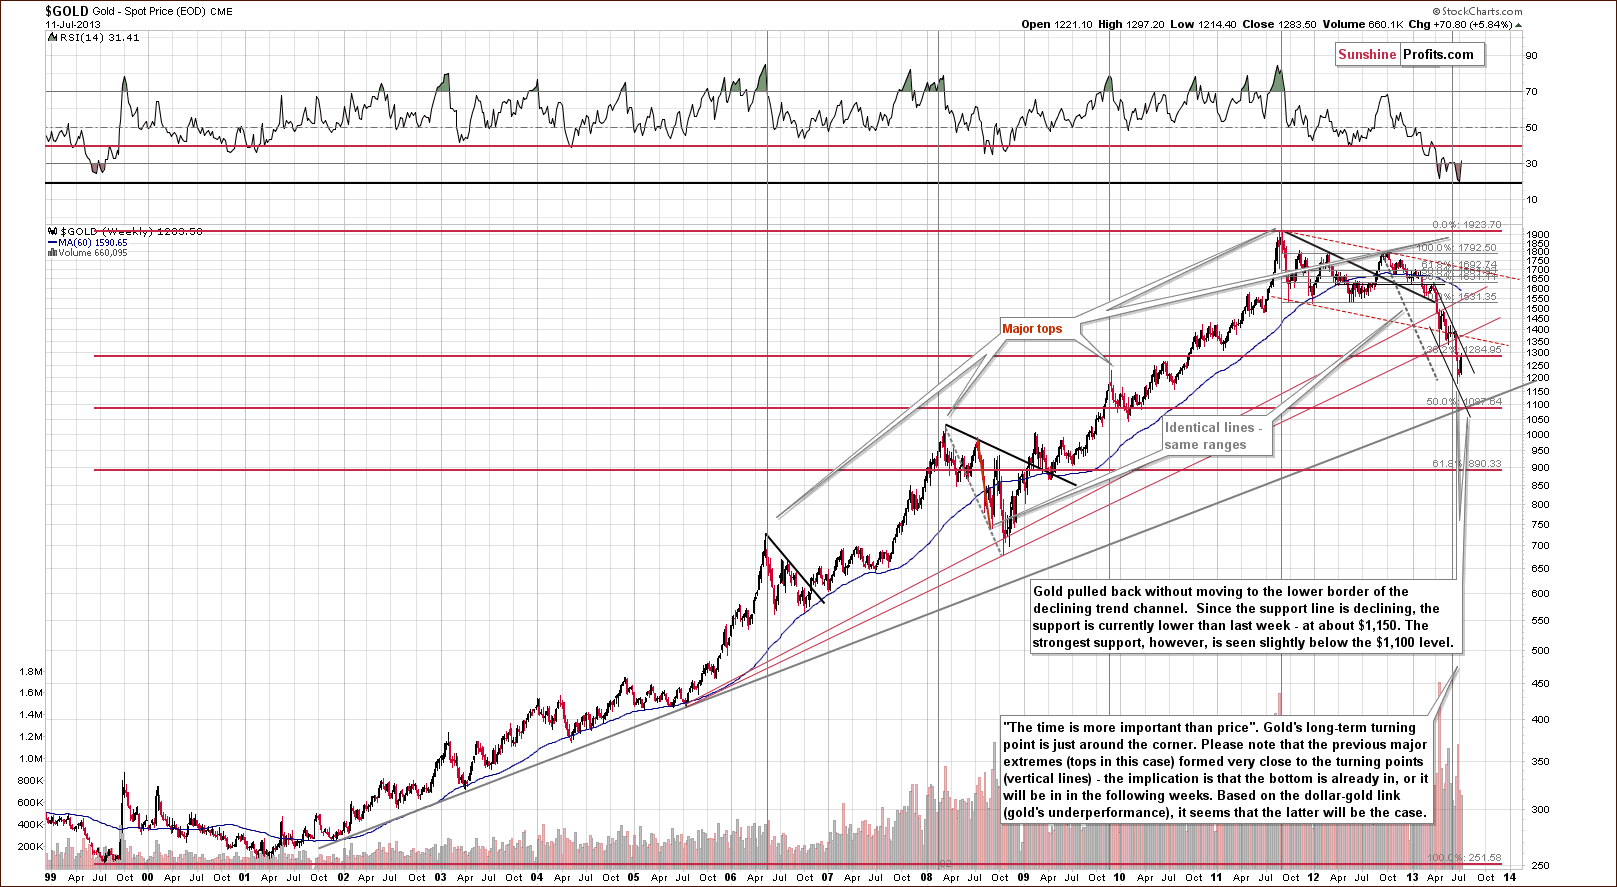
In this week’s very long-term gold chart, we see that the yellow metal has been trading sideways below an important resistance line, the first Fibonacci retracement level, verifying its breakdown.
On Thursday, gold moved higher (it is only a bit higher from this perspective), but the move truly was very small compared to the rally in the USD Index, which was happening at the same time. As we explained in our yesterday’s Market Alert, this provides us with bearish implications for the entire precious metals market and was one of the main reasons that we opened another short position in the sector.
The first resistance level in gold is currently at $1,320 (declining line based on closing prices). The next one is around the $1,335 price level based on intra-day highs. Even the lower one wasn’t reached nor broken on Thursday when gold rallied. Instead, gold pulled back after rallying and is now more or less at its 50% Fibonacci retracement level.
Again, the strength in gold relative to the dollar is not really visible - this is a bearish factor, and from this perspective the outlook is still bearish.
In our previous Premium Update we wrote the following:
Gold could initially decline to the lower border of the trend channel and if it does, a pullback will likely follow. The most important support line for gold is slightly below $1,100 where two major support lines intersect. These are the very long-term support and the 50% Fibonacci retracement level for the entire bull market.
So far gold did not decline to these levels, so there’s still room for another big slide.
Based on the moves in the USD Index and gold priced in the US dollars, one could expect gold viewed from the non-USD perspective not to do much. Was that the case?
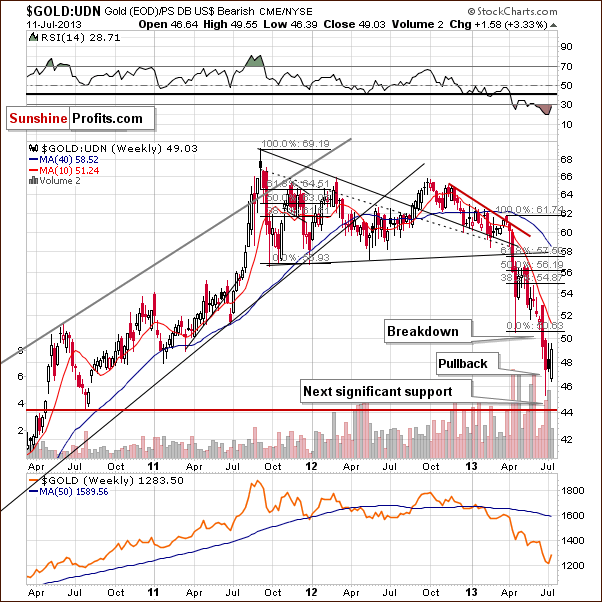
Gold viewed from the non-USD perspective showed some strength this week but the rally didn’t take it very far. The downtrend clearly remains in place.
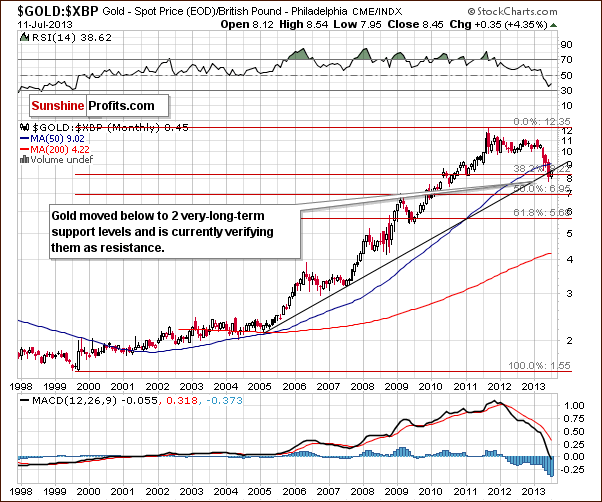
Gold priced in British pounds is currently verifying last week breakdown.
As we wrote in our previous Premium Update:
This is a breakdown below two important support levels, in this case the rising long-term support line and the first Fibonacci retracement level on the full bull market.
This is an important breakdown and, at this time, the next significant support line is slightly below the 7 level in this chart.”
After Thursday’s rally gold moved to the rising resistance line, but didn’t break it, so the outlook remains bearish.
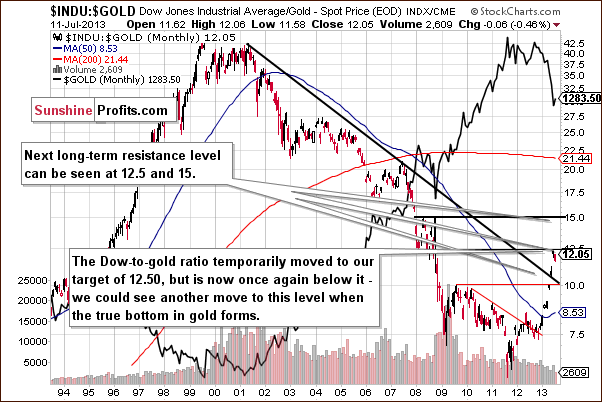
The Dow to gold ratio moved temporarily to our target of 12.50, but is now once again below it. It is quite neutral at the moment, but we could see the ratio move to this level once again when the true bottom in gold forms.
Summing up, gold rallied this week but the move to the upside did not invalidate the most important resistance levels. We saw some strength, but still, the move was smaller than one would expect it to be based on the size of the decline in the USD Index. The outlook and trend remain bearish for the short term.
Silver
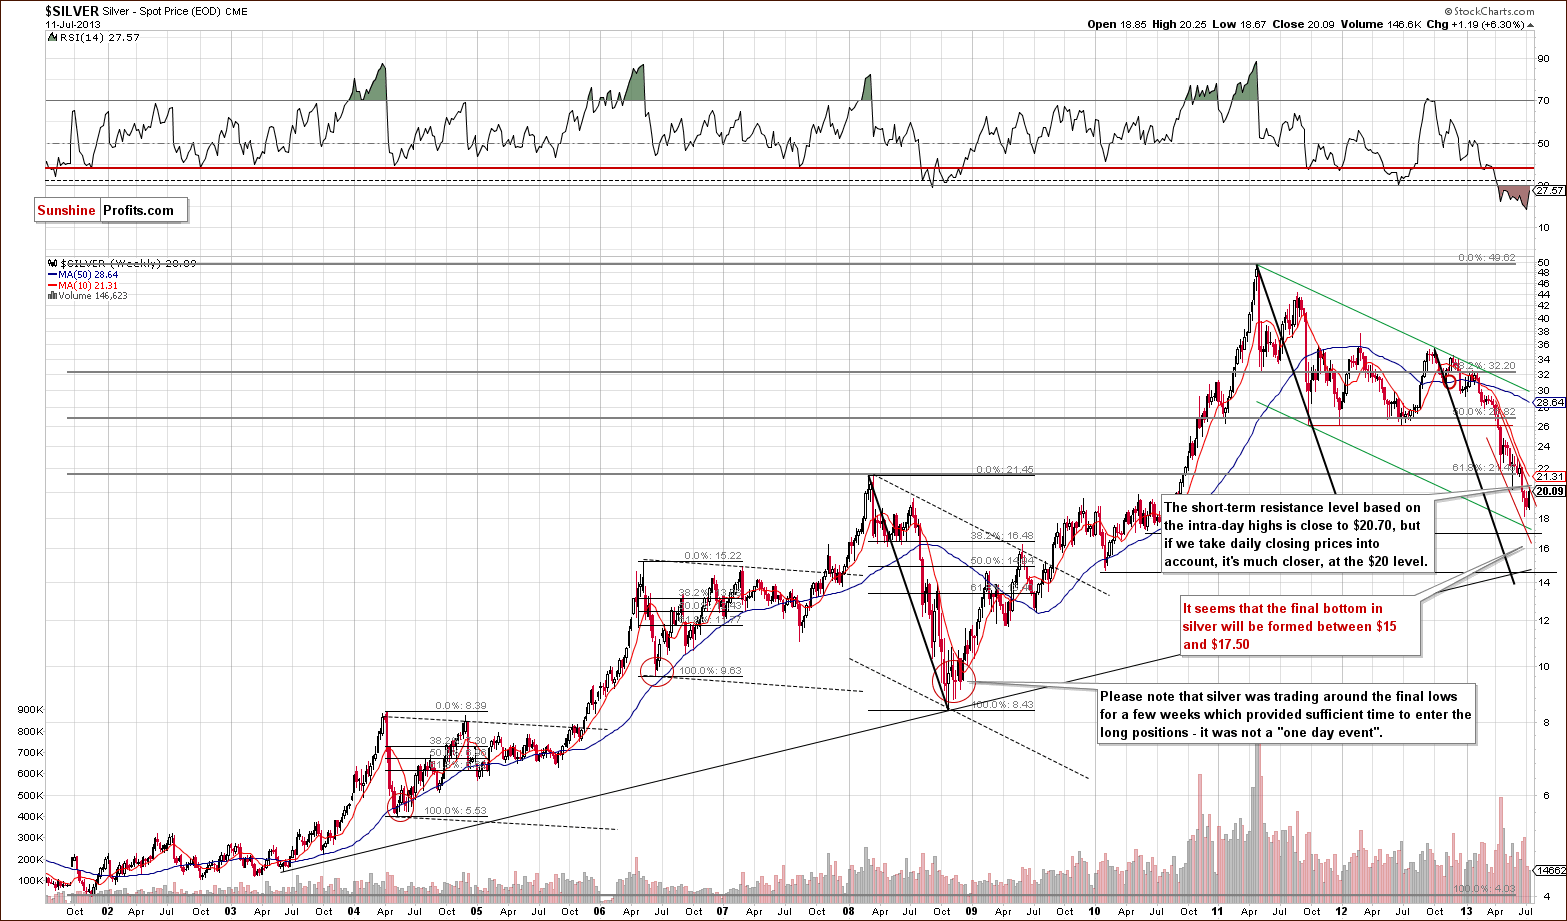
In this week’s very long-term silver chart, we have a situation somewhat similar to what we saw with gold this week. Silver also moved higher and attempted to move above the declining resistance line, finally closing right at it (a few cents below the $20 level) without breaking it. Technically at this time, we have no breakout, so the situation remains bearish (even the short-term trend). We see no indications that this week’s rally was anything more than a contra-trend bounce.
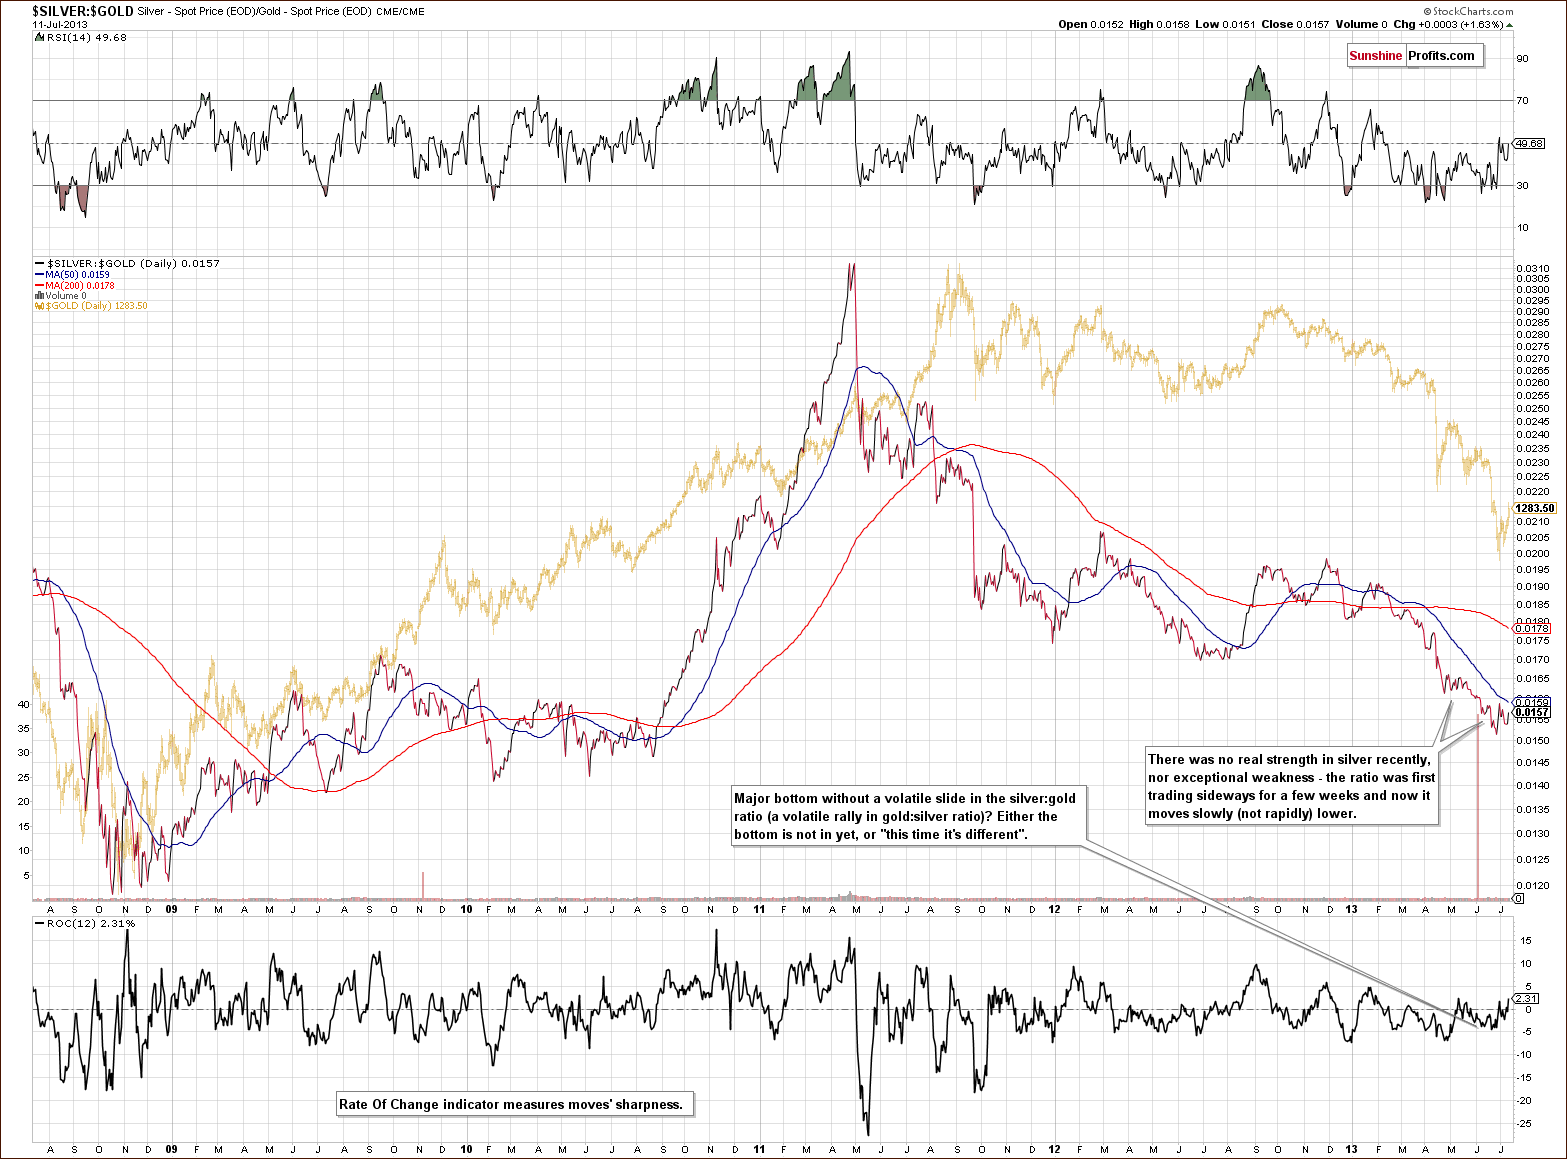
In the silver to gold ratio chart, we still see no signal of a bottom. Silver is likely to sharply underperform gold very close to the bottom based on historical data. We have not seen signs of such action this week, so it seems that the final bottom is still ahead of us.
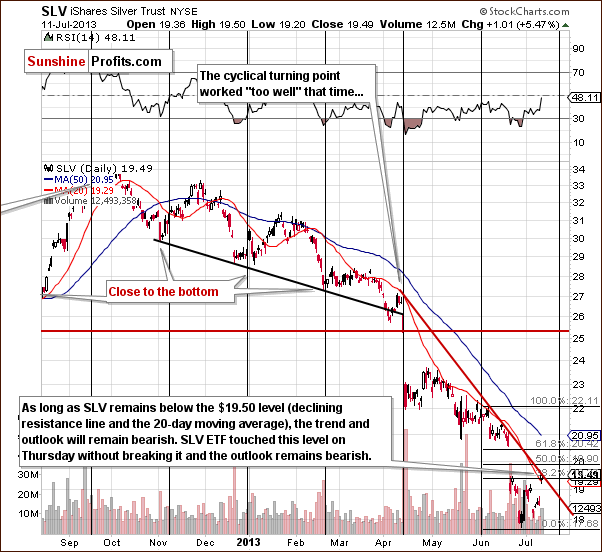
In this week’s medium-term SLV ETF chart, we see that silver is now slightly above the declining resistance line that we have previously discussed, and we also see that this level coincides with two more resistance levels.
The first is the 20-day moving average, the red slope in our chart, which has proven to be an important resistance line since it was broken in February. It has been tested a number of times since, and such is the case once again. All the previous cases were followed by downswings. The other level is the first Fibonacci retracement level, 38.2% based on the June decline. Silver did not move above these two resistance levels so the trend is clearly down.
We saw a small move to the upside for silver on relatively weak volume (it was average but comparing to the volume seen previously during similar 5% daily upswings, it was rather weak). In the recent past, this was also seen before bigger declines. This was the case in early June, late May, early May and also in April. It seems that we have this once again, and this was one of the reasons for which we opened a speculative short position once again (based on the price action that is, we didn’t have the volume data before the session, but the volume levels didn’t invalidate our initial suggestions).
Summing up, silver moved higher on Thursday but no breakout was seen to invalidate the downtrend. We think that the next move for silver will be down and in tune with its recent and current short-term trend.
Gold and Silver Mining Stocks
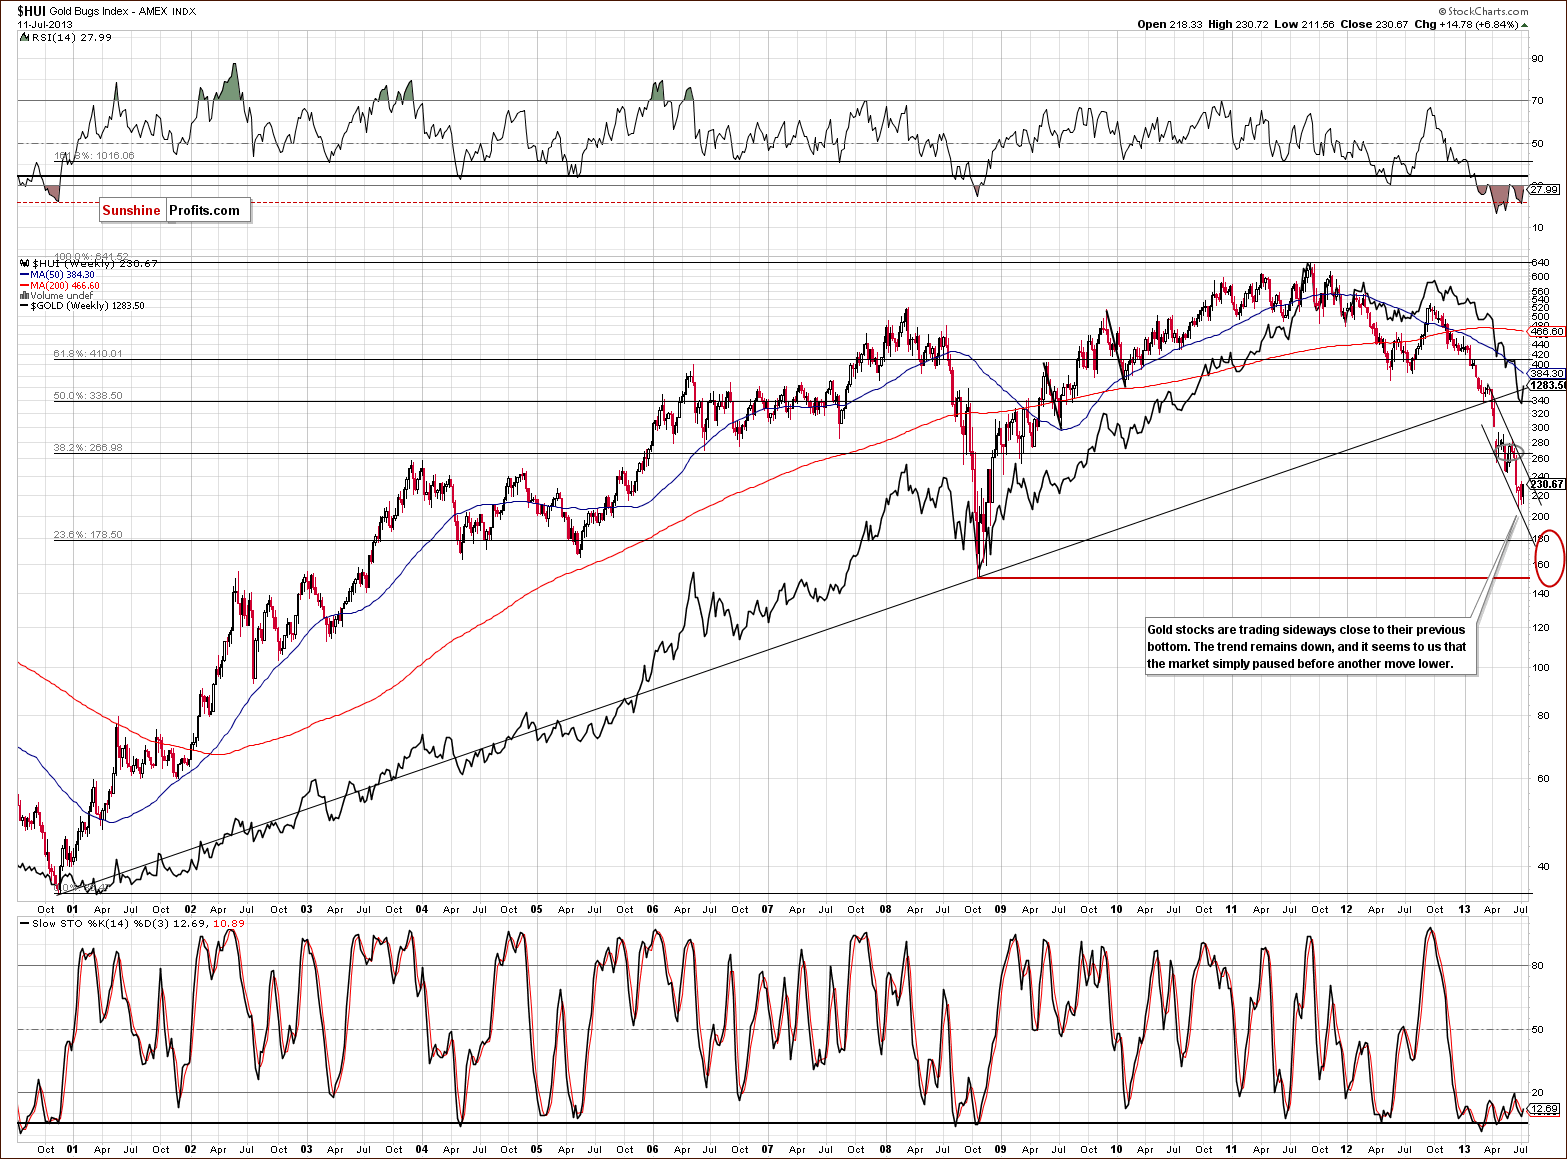
In this week’s very long-term HUI index chart (a proxy for the gold stocks), we see that the upper border of the declining trend channel was not reached. Prices consolidated close to their June bottom but did not manage to rally to the resistance line like gold and silver did. The sector remains weak, and no big reversal resulted from declines in the USD Index. Let’s now look at how gold stocks performed relative to gold.
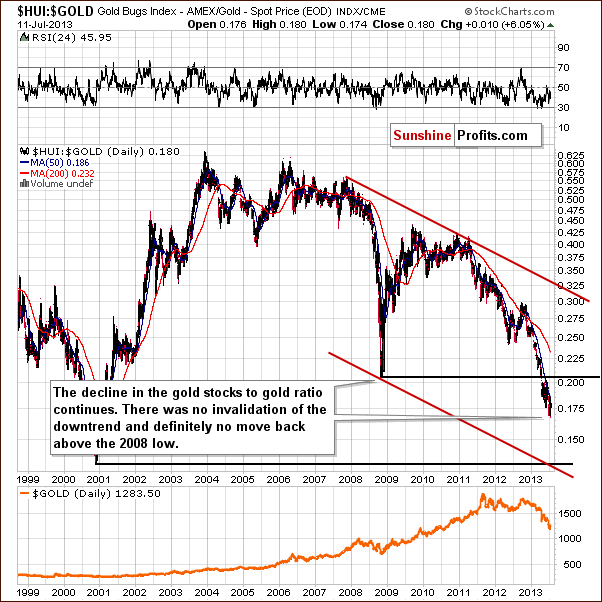
In the gold stocks to gold ratio chart, we see that the ratio moved higher on Thursday, closing at the 0.18 level. This was quite a small move especially from the long-term perspective, and the downtrend clearly remains in place. The rally has not even taken the ratio to the 50-day moving average, so overall there was no real change. The downtrend and bearish implications remain in place.
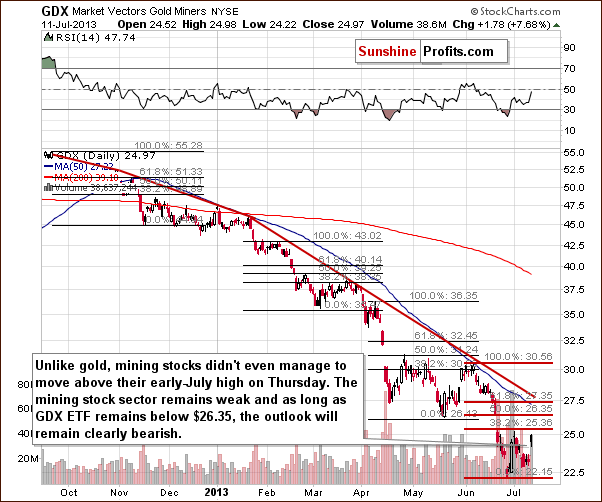
In this week’s short-term GDX ETF chart, we saw a rally to the previous July 2013 high, but while gold and silver moved above their highs, the miners closed slightly below. Clearly, mining stocks have underperformed the metals. As long as the miners don’t correct more than one half of their decline, this correction will be in tune with previous ones, and there are no bullish implications (please compare the retracements marked on the above chart). The trend seems likely to continue to the downside.
The way that miners corrected previously is being repeated, that is a self-similar pattern exists. Prices declined in April and then consolidated, the same was seen in June/July, and a sharp drop was followed by an ABC or zigzag correction with a second high forming at or slightly below the previous one. This is where we are once again. Yes, it is a bit smaller this time, but that’s the point of it being “self-similar” not identical. Notice that after the second bottom, a sharp decline was seen. This is the likely outcome also this time.
Summing up, the outlook for mining stocks remains bearish and the final bottom still appears to be ahead of us.
Letters from Subscribers
Q: Withsome mining stocks breaking down below 2008 levels, and the talk of inflation, do you think inflation will still be a problem in the next year or two and hyperinflation in the next 3-5 years.
Finally, PR, with amazing mining stock buys in the big Hui names , is there a big chance that some of the component companies in the hui will go bust over the next year with the badly depressed prices?
A: Yes, we think that inflation will be a problem in the coming years. It already is if you measure inflation as rising money supply (more info about our definition of inflation). It's a tough call to say if you will see sharply rising prices in the coming year or in the following years, but it seems that we will see substantial inflation globally. You simply can't get away with multiple Quantitative Easing programs even though The Powers That Be are trying very hard to convince everyone that this can be done.
Is there a big chance that some of the component companies in the HUI Index will go bust? No. There's a chance, but we don't view it as significant. We view this correction as a temporary phenomenon, not a sustainable one. If gold was to decline below, say $1,000, and stay there for many months, then we could discuss the possibility of bankruptcy of some gold producers. However, we don't think that this is a likely outcome. Why not prepare for that anyway by diversifying among several miners? Our Golden StockPicker and Silver StockPicker will detect stocks that are likely to provide greatest profits when gold resumes its bull market and at the same time owning more than just a few companies will ensure that a bankruptcy of one of them will not be devastating to your portfolio.
Q: The latest Premium Update talks about gold's "Turning Points". (Note: I'm referring to a note on the long term gold chart. I do not believe it's discussed in the main body of text.) Those Turning Points marked on the graph seem to carry a significant meaning. It's compelling to see how closely the previous tops have aligned to them. Question 1: The Turning Points appear to be spaced at 22 month intervals, is that correct? Question 2: In four previous cases the Turning Points coincided with price peaks. Are you sure that they indicate price extremes and not peaks? In other words, does this current Turning Point coincide with alocal top or local bottom? Question 3: There's no argument that the four price peaks between 2006and 2011 have an uncanny regular spacing. Do you have any theory as towhat underlying mechanism is at work here?
A: In the following answers we are referring to the very long-term gold chart featured in July 4, 2013 Premium Update.
- Yes, that's approximately the case.
- That's a very good question, thanks for asking it. Yes, the cycle based on major tops is more likely to result in another top than a bottom. In fact, if we didn't see on the chart what happened after the beginning of 2012, we would say that it's likely that the next turning point will mark another major high. However, there are two more things one should take into consideration, in our view. The path dependency and the other way that cycles work. Starting with the latter, it is quite often the case that cycles work on a "extreme" basis, meaning that we can have a bottom based on tops, tops based on bottoms or the cycle can turn upside down meaning that the top-to-top cycle can turn into a low-to-low cycle.
Actually, in our opinion it's best to view all cycles as "extreme-to-extreme" and only say what's more likely based on their previous performance. Then there's path dependency. In simple words, the way the cycle is very likely to work is based on what the price did right before the turning point. In short, if they price has been declining for some time already, it can't form a major top. You would need to have a price rally for a top to form.
Combining both factors gives us what we have today for gold - a cyclical turning point that is likely to be a major bottom as it can't be a major top since we have seen gold declining for months. - In fundamental terms - no. It's not a year or multiplication thereof, so it's not typical seasonality. In technical terms - yes. It's just how this market used to work in the second stage of this bull market. 2006 is the year that we view as the beginning of the second stage of the current bull market in precious metals (at that time gold started to rally in multiple currencies, not just in the USD) so what we see is based on an approximately similar group of investors, so there is a reason for this tendency to continue to work.
Each market needs to correct every now and then, however, why is it approximately 22 months and not 25 or 19? We don't know - we simply noticed how things used to evolve previously, which may indicate that the participants will react to price changes in a similar way also this time - perhaps it simply takes the majority of investors about 22 months to repeat the full optimism-pessimism cycle. Perhaps there is another reason. It's always difficult to reply to "why" questions regarding technical terms, because they are not based on logical reactions of the market, but emotional ones. Just like it is with other techniques, we focus on what works and include it in our analysis with a dose of skepticism. When a given outcome is confirmed by multiple independent techniques, the odds for a given scenario to play out as expected increase. The long-term cycles are one of these techniques in this case.
Q: Thank you for the helpful article Gold and Silver Portfolio Structure. As we are reaching a major bottom in both gold and silver, the downsiderisks are much more limited than at other points of the metals cycle. In rare opportunities like these, is there a case for shifting a substantial part of what would normally be one's investment capital to trading capital?
A: Not really. One reason is that we previously (a few hundred dollars ago in gold terms) suggested closing the long-term investment portion of one's capital and we have recently suggested moving back in with half thereof. In a way, this is a shift from the traditional buy-and-hold approach - we are already taking advantage of these major price swings without changing the portfolio structure.
Secondly, the trading capital in our approach toward portfolio structuring is the part where you are focusing on short- and (rarely) medium-term moves and where trades are quicker. The major bottom is a great opportunity to enter a position that one wants to hold for longer. Sure, it's a great speculative opportunity too, but it's one of many in this case - during horizontal price moves there may be many local bottoms/top with trading opportunities. Consequently, the major bottom creates a major opportunity for long-term positions, and thus one could even consider doing the opposite of what the question is about - moving more cash into the long-term investment part of the portfolio. Overall, we suggest keeping the portfolio structure unchanged.
Q: I copied the following from the "Gold Options" article under Cornerstones of Our Philosophy:
"Are we advocating switching to options only? No, we’re not. There is another risk involved in options and that is the fact that they additional legal regulations, though they are not as bad as futures, where powers that be can raise position limits to absurd levels – they did that about ten years ago on the palladium market."
I wonder if Sunshine Profits could provide further clarification/information (…). How an option change after one has acquiried it?
A: The regulator could simply close the market for a given series of options or ban delivery (for deliverables) and force cash settlement. For instance, if silver shoots $100 in a week, the regulators could say that "in order to protect the market" there would be no physical delivery so as not to exacerbate the shortage and the payouts could be scheduled several weeks or months from that time. Why is this bad? Because you could miss the best part of the upswing that comes after that. Why take such a risk with a large part of your capital? That's why we don't advocate using options for long-term investments, but we think that they are a useful instrument for trading purposes.
Q: DearPrzemyslaw, thestrong season for precious metals is coming, and you are projecting it will reach $1090 this month. Did you consider any of the seasonal factor? Thx in advance.
A: Yes, we are keeping the seasonal analysis in mind even when we don't mention it in our updates/alerts. There is a weak tendency for gold to move a bit higher in August, however, historically, gold doesn't pick up until the beginning of September. These patterns don't invalidate, nor are they contrary to our analysis or outlook – we think that gold will most likely form a bottom later this month.
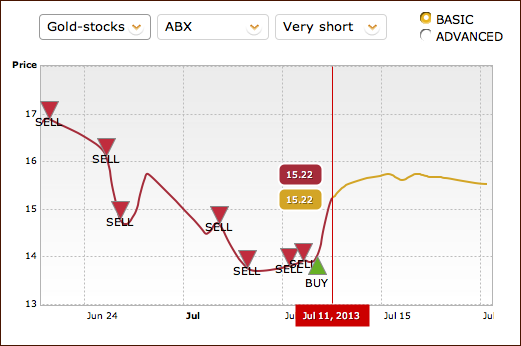
Q: What’s the status of the work on the new self-similarity based tool that predicted the April plunge?
A: We’re still fine-tuning details. The price predictions seem to work very well. Did we mention that it provides also signals for individual mining stocks? Here’s a screenshot for ABX – Barrick Gold Corp. It doesn’t provide any meaningful signals currently, so our position is in tune with the current trend – which is down.
Q: Could you please pass the following questions to Mr. Radomski:
1. Gold - Recent Gap Down
I have been following your articles religiously and and completely agree with the bearish thesis on Gold. In fact, I have been shorting gold (DZZ) for the past month (and thankful that I did) because of your articles and subscribed to Sunshine Profits after finding the advice here to be very valuable.
In reviewing the GLD chart. It seems that GLD gapped down twice in recent weeks, with first gap from around 130 to 125 and the second gap from 123 to 120. Yesterday's rally (Thurs, Jul 11) seemed to cover the second gap. However, I wonder whether the first gap needs to be covered as well before the definitive move down. What are your thoughts on this?
2. Gold - Bottom
I've noted your prediction of a gold bottom around roughly 1,100. However, I wonder that after such a long and intense gold bull market of 12 years, wouldn't the final bottom be at least a 50% retracement of the gold high (1,900)? Wouldn't this place the bottom in the range of 900-1000? I subsribe to the view that the bull will continue after the bottom, but just not sure where it will bottom. Just seeking your thoughts on this.
3. Emerging Markets
Would also like to seek your thoughts on emerging markets and their relationship with Gold.
Personally, I would share the same bearish thesis for EEM as I would for GLD, for the following reasons:
• EEM chart is very bearish with simulataneous "Death Cross" and completion of Head & Shoulders formation over last few months
• Fundamentals are poor and a number of countries in EM could potentially implode
However, the short EM trade has worked (until yesterday) because it benefitted from the strong dollar just like the short Gold trade. Does yesterday's news change the thesis? I still feel strongly about the short EM trade, but am just not clear about the timing.
A: Here's our take:
1. Thanks for the feedback, we're happy to see that you're happy with our service :) Our best guess goes to the scenario in which the second gap will not be closed and that the 50% Fibonacci retracement level will keep the rally in check as this level is so important from a long-term perspective. We are not that certain, though, as closing the second gap would still not invalidate the bearish outlook (please note that our stop-loss level is above the gap).
Generally, it seems that using gaps in case of assets that are traded intensively almost all the time in various markets might be misleading. Normally, when a given asset is traded on one market only, then when it opens much above its previous closing price can mean a lot. However, with GLD the situation can be different, because it's directly linked to gold, which trades all around the world and closing prices in US terms are relatively less important. In other words, they are important, but not as if gold weren’t trading anywhere else.
2. 50% retracement - yes, but not based on the top alone, but based on the entire bull market, which didn't start at $0, but at about $250. Of course that's just our subjective judgment and we could be wrong. Please note that if we assume that both ways that the retracement could work (based on the rally or based on the top alone), we still have greater odds for the rally-based analogy to work because it is strengthened by the long-term support line based on the 2001 and 2005 bottoms. Again, just our subjective judgment.
3. The outlook for emerging markets is a bit unclear to us and we'd prefer not to make more detailed price projections, but you asked about our thoughts on these markets, so here they are. On a short-term basis emerging markets are indeed reacting like gold, likely driven to a large extent by the moves in the USD Index and based on that, it seems that another move lower will emerge shortly (this is not our official prediction, though; we have much more details for the precious metals market and feel more confident making predictions there). Over the long run, we expect emerging markets to act more in tune with major stock indices and to move higher, especially after the main stock indices move much higher, the appetite for profits increases along with tolerance for risk.
Summary
The USD Index declined heavily this week, especially in the past few days. The key thing is the way the precious metals reacted, or – which is a better description in this case - didn’t react. We normally expect a strong rally when the USD Index drops by two points in a short period of time. What we got was only a small rally, that is, no significant rally in silver or mining stocks given the bullish move in stock prices. Higher crude oil prices (and finally a confirmed breakout!) had no real impact either. Simply put, the precious metals sector is not reacting to factors that should trigger a rally.
So what does all this mean? It seems that the markets have quite likely not bottomed just yet and are still in a downtrend with lower prices likely ahead. The shape of the decline and subsequent rally this week in silver and mining stocks suggest s that a downturn will likely be seen soon based on the very long-term cycles present in the gold market. It seems that the next wave lower could be the final part of the decline and mark the bottom, with gold probably close to $1,100.
Trading – PR: Short positions (half) in gold, silver and mining stocks. We suggest placing buy orders for the speculative long positions in gold and silver for gold at $1,140 and silver at $17,40 (and closing the short position at that time - if these levels are reached). We don't have analogous price levels for mining stocks, but it seems that it will be a good idea to buy them (close the short position) when you buy gold based on the $1,140 target.
Trading – SP Indicators: No positions: SP Indicators suggest long positions but the new self-similarity-based tool suggests short ones for the precious metals sector (for its key parts that is) and we think that overall they cancel each other out.
Long-term investments: Half position in gold, silver, platinum and mining stocks. As far as long-term mining stock selection is concerned, we suggest using our tools before making purchases: the Golden StockPicker and the Silver StockPicker
| Portfolio's Part | Position | Stop-loss / Expiry Date |
|---|---|---|
| Trading: Mining stocks | Short | 262 (HUI), $28.2 (GDX) / - |
| Trading: Gold | Short | $1,383 / - |
| Trading: Silver | Short | $22.55 |
| Long-term investments: Gold | Long - half | - |
| Long-term investments: Silver | Long - half | - |
| Long-term investments: Platinum | Long - half | - |
| Long-term investments: Mining Stocks | Long - half | - |
This completes this week’s Premium Update. Our next Premium Update is scheduled for Friday, July 19, 2013.
Thank you for using the Premium Service. Have a great weekend and profitable week.
Sincerely,
Przemyslaw Radomski, CFA


