- Euro & USD Indices
- General Stock Market
- Crude Oil
- Copper
- Correlation Matrix
- Gold
- Silver
- Palladium
- Mining Stocks
- Letters from Subscribers
- Will the next drop be the beginning of an eventual move up?
- Silver tends to sell off in foreign markets
- A possibility that gold will form a double bottom around $1,200
- Summary
This Premium Update begins with an excerpt from our just-released Market Overview. It focuses on gold as an anti-inflation hedge, and why it is precisely a hedge against something else.
Last week, we discussed John Paulson’s comments on gold, and today we continue from the point where we left off. As a reminder, we stated that significant increases in base money can be good reasons to be bullish, but not necessarily as bullish as Paulson argues.
John Paulson is betting in favor of gold based on his inflationary explanation of the current situation. He is consistent is his belief in the inflationary scenario when he states that the housing market is not far away from the bottom. He even goes so far to say that buying a home is one of the best investments one can make. (Let us not forget that Paulson correctly predicted the peak in the housing market and became a billionaire by short selling subprime mortgages in 2007. So where is the consistency? What does being bullish about gold have to do with being bullish about the real estate market? The answer is: if you believe in strong inflationary forces, you have to believe they should prevail macroeconomically, and you cannot separate various markets. If money printing should lead to inflation, you should see inflation everywhere, because it is a universal phenomenon; an upward march of prices. Of course, some markets are more affected than others. One price can increase by 10%, another by 25%, other by merely 4%. Nevertheless, once inflation takes a hold there are no doubts about it, since rising prices are noticeable virtually everywhere. Therefore, it would seem contradictory to argue on the one hand that high inflation is coming, and at the same time state that the housing market should still plummet. In other words, if you believe in hyperinflation, you should believe in a runaway boom, a flight into real assets, any assets useful to the public despite any possible debt shackles (since the real value of debt shrinks in the high inflation storm).
This of course does not imply that gold always has to move in the same direction as real estate. But, if the argument for buying gold is based on hyperinflationary conclusions, then one must accept the consequences and argue that other real markets also have to boom. That is the nature of high universal inflation: everything gets more expensive (except for money and past contracts, which lose their value). Therefore, if one posits that gold will rise because very high inflation is around the corner, one could just as well say that real assets are going to rise due to the upcoming inflation.
Actually the same goes with interest returns, including government bonds. If high inflation is on its way, one should see investors demanding inflationary compensation. In other words, interest returns on current investments should take into consideration the inflationary wave that is supposed to swipe the currency market. If you believe in hyperinflation, observe current interest returns and all commodity markets. If you do not see an upswing in both cases, nobody’s really expecting high inflation to happen. Therefore, you should not make the case for gold based on hyperinflation argument.
In the environment of very high levels of inflation (tens of percent) gold will rise as other real values. What is the case with single-digit inflationary scenario? Is gold really the inflation-hedge as it is touted? People believe so, and they are right when it comes to high inflation scenarios, but if we focus on smaller doses of inflation there is little correlation between the inflation rate and the gold price. Actually, as stated above gold is an anti-inflation instrument only when big inflation is on its way. Very big. The last 40 years tell us that gold has its own cycle, in fact unrelated to levels of inflation. Take a look at this graph:
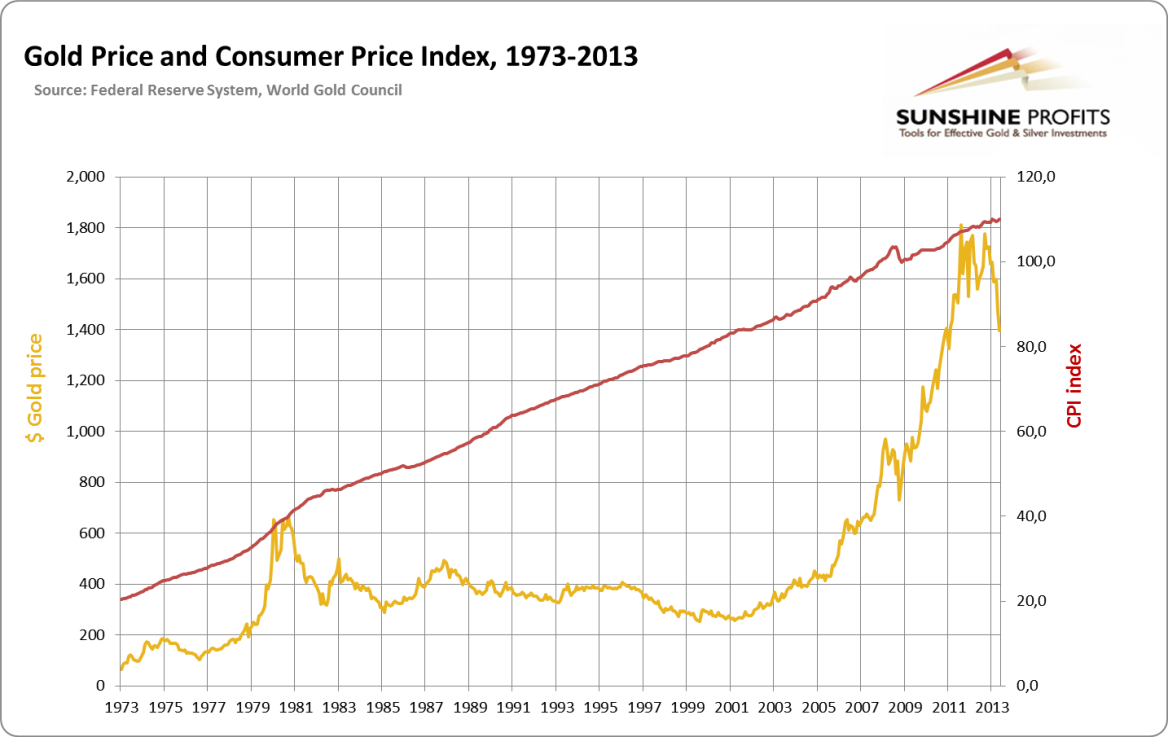
For the last 40 years the dollar was constantly losing its value (right scale) sometimes faster, sometimes slower. Yet gold appears to have its own way of reacting to this steady decline in the dollar’s purchasing power. Take as an example the case of the period between 1982 to 2002 when the dollar lost half of its value. During the same period gold did not gain 100% to compensate for inflation. It did not increase and did not even stay at the same level. In fact it lost its value. It was one of the worst inflation-hedges one could pick. It did not save your capital from inflationary policies. Worse, because it was inferior to the dollar putting your green paper currency in socks was a better choice than buying gold.
Two decades is not a short run. We do not take the highest gold price from the 1980s to prove the point. During those 20 years gold was losing its value faster than the dollar. Then things changed. For the next ten years the dollar lost its value, but there was a significant shift in the gold market. During that period of time, as we well know, gold gained tremendously. Even though the time period is not very long it can clearly confirm one thing: gold has its own separate market. Its value may be related to the inflation rate, but it is not a primary reason for major shifts in the value of gold. Simply put, there is more--much more. Historically gold is not a good inflation hedge (or precisely it can be in only certain circumstances).
The key to proper understanding of the gold market and more importantly – making a correct investment choice in the gold market – is getting rid of this popular notion about the yellow metals and admitting that gold will not necessarily save you from the inflation monster. Yet it can save you from something else: the endangered dollar system.
As mentioned earlier, the above is a part of the first Market Overview report that we have just published. The full version includes detailed discussion of the anti-inflationary investing vs. anti-system investing (when is gold exactly an inflation hedge?), physical gold production, mining costs, and more. We are generally fans of the try-before-you-buy policy, so we have already provided two parts of this month’s Market Overview this and last week. We are also posting this month’s Overview later than usually so that if you sign up for the monthly subscription, you’ll be able to read 2 monthly Market Overview reports in this period. The price for one month is $14.95, but we decided to lower it for the first month to $9.95. So, instead of one for $14.95 you get two for $9.95 – that’s a 67% discount for a premium publication. We’re not saying that you have to sign up but we highly recommend that you do and given the discount, it would be a waste not to take advantage of it. You can sign up here.
Having said that, let’s move to charts (courtesy of http://stockcharts.com) and the short-term outlook for the precious metals market. Before moving on to gold, silver and mining stocks, let’s take a look at the related markets to put metals’ and miners’ moves into perspective.
USD and Euro Indices
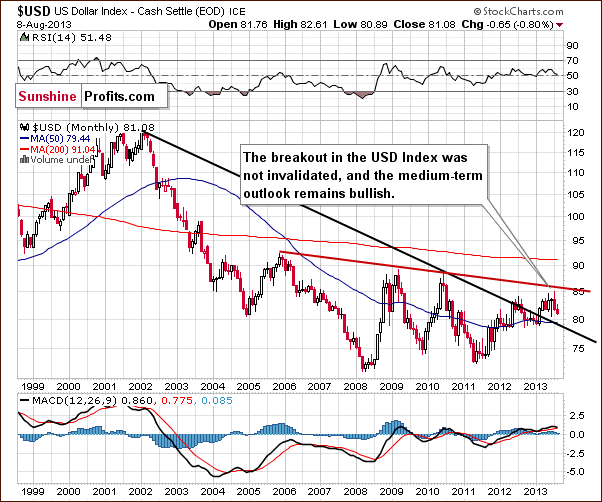
The situation in the long-term chart hasn’t changed much recently.
As we wrote in our last Premium Update:
The breakout above the declining support/resistance line (currently close to 79) was still not invalidated. From this perspective, the situation remains bullish.
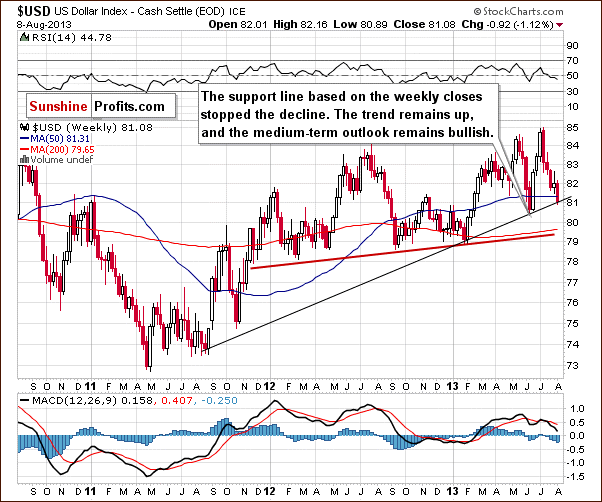
On the above weekly chart, we can see that in the past week, the USD Index has declined once again. The recent declines took the index to the medium-term support line (currently close to the 81 level). Keep in mind that this strong support line stopped the decline in June (although it was not even reached) and encouraged buyers to act, which resulted in a sharp rally in the following days. Taking this into account, we might see a similar situation in the coming days.
From this perspective, the medium-term uptrend is not threatened, and the situation remains bullish. Therefore we can expect the dollar to strengthen further in the coming weeks.
Now let's zoom in on our view of the USD Index and discuss the short-term chart.
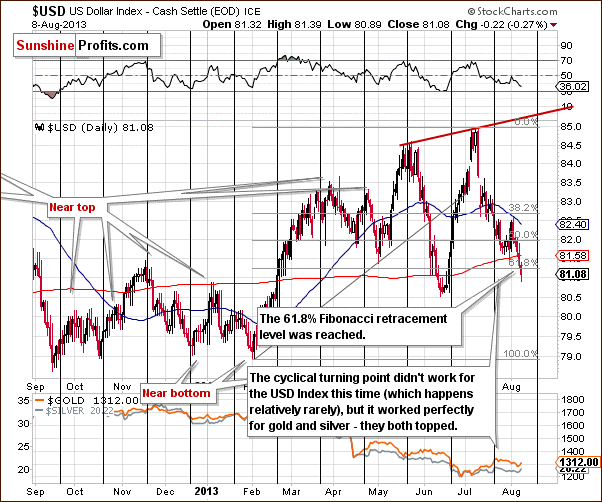
From the short-term perspective, we clearly see that the US dollar moved lower once again in the past few days. After a drop below the 50% Fibonacci retracement level based on the entire February – July rally, the USD Index moved back above this level in the days which followed. However, the improved situation didn’t last long. Last Friday and earlier this week, the dollar moved lower once again. In doing so, the USD dropped slightly below the 61.8% Fibonacci retracement level based on the entire February – July rally and is now slightly above the 81 level.
This is quite a strong support level, and when we factor in the previously mentioned medium-term support line, it’s quite possible that the bottom of the recent correction is already in. The short-term breakdown is small and unconfirmed, and unconfirmed by what we see on the medium-term chart, where a strong support line stopped the decline. Consequently, it seems that the short-term breakout will be invalidated shortly.
If the buyers manage to push the USD Index higher, we might see an increase to the level of the June top or even to the rising resistance line based on the May high and June peak before another pause is seen. Taking a look at the long-term charts, however, we see that the next significant resistance is currently close to 86 (86.4) – the declining red line in the chart.
Let’s now take a look at the Euro Index.
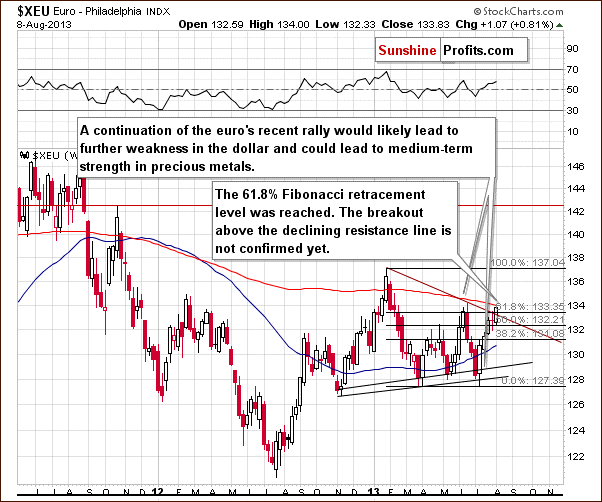
On the above chart, we see that the situation has changed very little. After a small pullback, the European currency continued its rally throughout the past week. The euro climbed up once again and moved slightly above the 133 level.
In our previous Premium Update, we wrote:
The recent price action in the euro led to further weakness in the dollar, but it did not result in significant short-term strength in precious metals, which is a bearish sign.
In the past and this week we saw similar price action, which confirms negative signals.
We also wrote about another bearish factor - the declining resistance line based on the January top and the June peak. As you can see on the weekly chart, it stopped the rally last week, but the buyers didn’t give up, and they managed to push the euro higher in the days which followed. It led to the breakout above this resistance line, but it’s not yet confirmed.
At this point, it’s worth mentioning that the recent rally reached to the 61.8% Fibonacci retracement level based on the entire February-March decline, which serves as a resistance now (again, Thursday’s move above this level is small and unconfirmed).
Another resistance level that is currently in play is the 200-week moving average which has been keeping rallies in check since September 2011. Please note that there is also the June top, which may provide resistance slightly above the 134 level.
Summing up, the long- and medium-term outlooks for the dollar remain bullish. From the short-time perspective, we see that the USD Index declined once again in the past week. The recent decline took the U. S. currency slightly below the 61.8% Fibonacci retracement level based on the entire February – July rally, but this move was not confirmed. The medium-term support line held. Taking the above-mentioned into account, it is quite possible that the bottom of the recent correction is already in, which may lead to a move to the upside.
At the same time, the Euro Index climbed up and broke above the psychological resistance level of 133, reaching the declining resistance line based on the January top and the June peak. Although these changes should have had bullish implications for gold, the yellow metal did not climb up sharply (despite what one might think based on Thursday’s price action alone). When the Euro Index was previously where it is today, gold was trading close to $1,400. It’s almost $100 below that level now.
General Stock Market
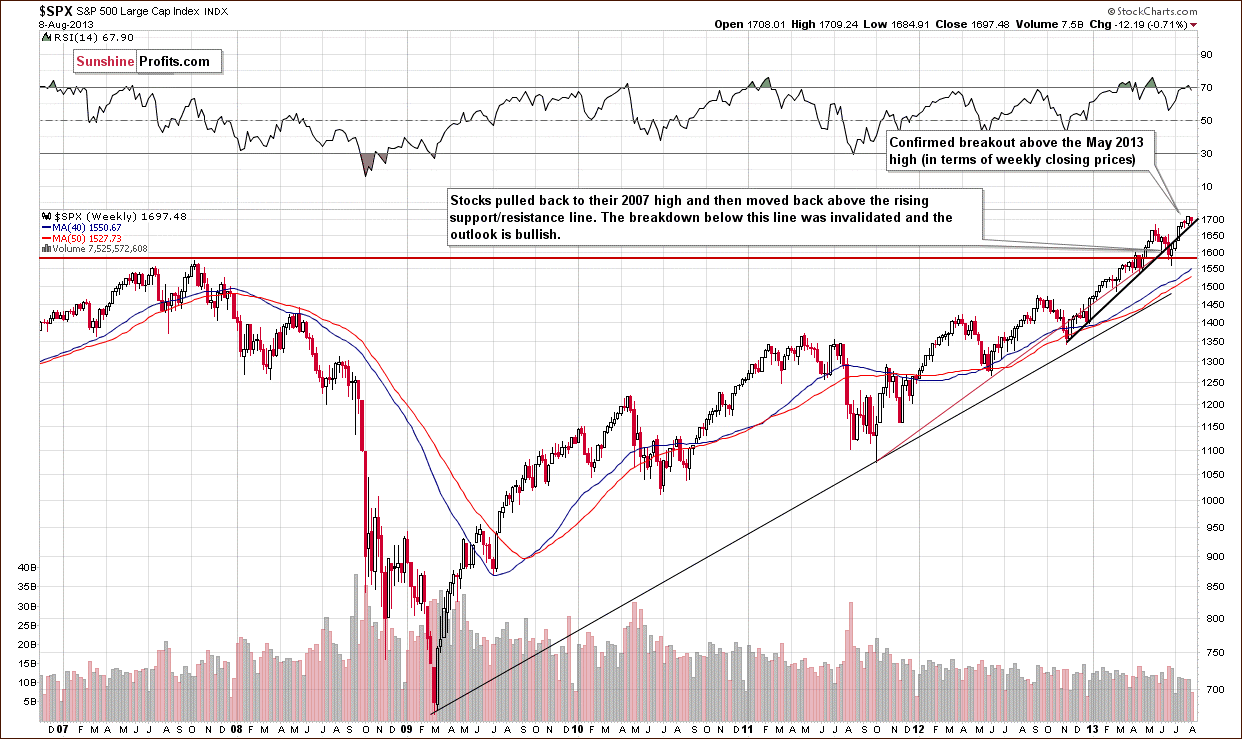
On this week‘s long-term S&P 500 chart, we see that the situation hasn’t changed much. After a small pause, traders and investors continued to buy, which resulted in another all-time high of 1,704.95 last Friday. In so doing, the S&P 500 crossed the level of 1,700 for the first time ever.
In the following days, investors took some profits, and this led to a corrective move. The correction is very shallow, however, and the S&P 500 index is still above the previously broken rising trend line based on the November 2012 January 2013 lows.
Please note that the RSI is no longer above the 70 level, and from this point of view, the stock market is not so overbought anymore.
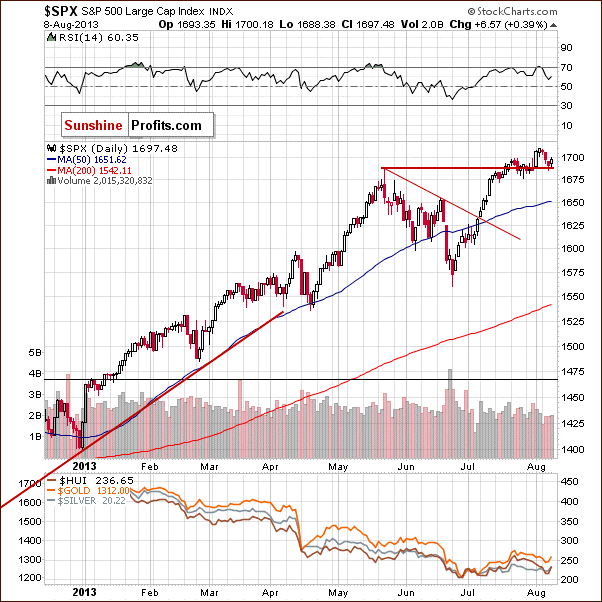
On the above daily chart we see that prices climbed once again, resulting in another all-time high of 1,704.95 last Friday. Despite this growth, the higher price levels did not last long. The S&P 500 index gave up the gains and dropped a bit in the following days.
However, the corrective move is quite small at the moment. Although stocks moved back below the May top (intraday) once again, the breakout above this level has still not been invalidated.
From the short-term point of view, the outlook is also bullish.
Summing up, although we saw a small corrective move in stocks, the previously confirmed long-term breakout was not invalidated. Thus, the outlook remains bullish for the general stock market.
Crude Oil
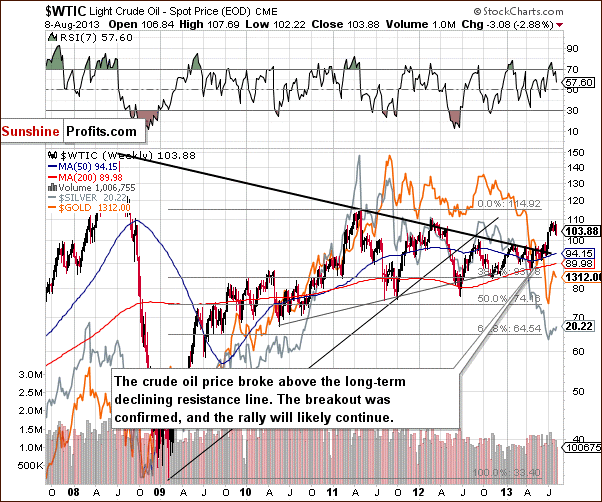
On the above chart, we see that the situation hasn’t changed much recently. After the RSI dropped below the 70 level generating a sell signal, oil bears went short and triggered a corrective move, which took crude oil below $105 per barrel.
Despite this decline, the following two days saw a pullback, and this price move reversed earlier losses. In this way, the oil bulls almost reached the strong resistance level based on the July 19 top. However, the proximity to this strong resistance level has encouraged investors to take profits in recent days. This price action resulted in the consolidation visible on the above chart.
In our previous Premium Update, we wrote:
In the past, we saw that the yellow metal’s price moved higher along with the price of crude oil (there are periods when this relationship works, but that’s not always the case). The current rally in gold took place along with the rally in crude oil. If oil corrects, this could trigger another move lower in gold as well. Please note that gold - unlike crude oil - is in a medium-term downtrend.
Taking the above-mentioned into account, we clearly see that the consolidation in crude oil was a sufficient factor, which perhaps triggered a decline in gold (or perhaps it was triggered by something else and gold reacted much more significantly which is a bearish indication anyway). If this relationship continues, a downward move in the “black gold” will likely lead to a huge decline in gold.
Copper
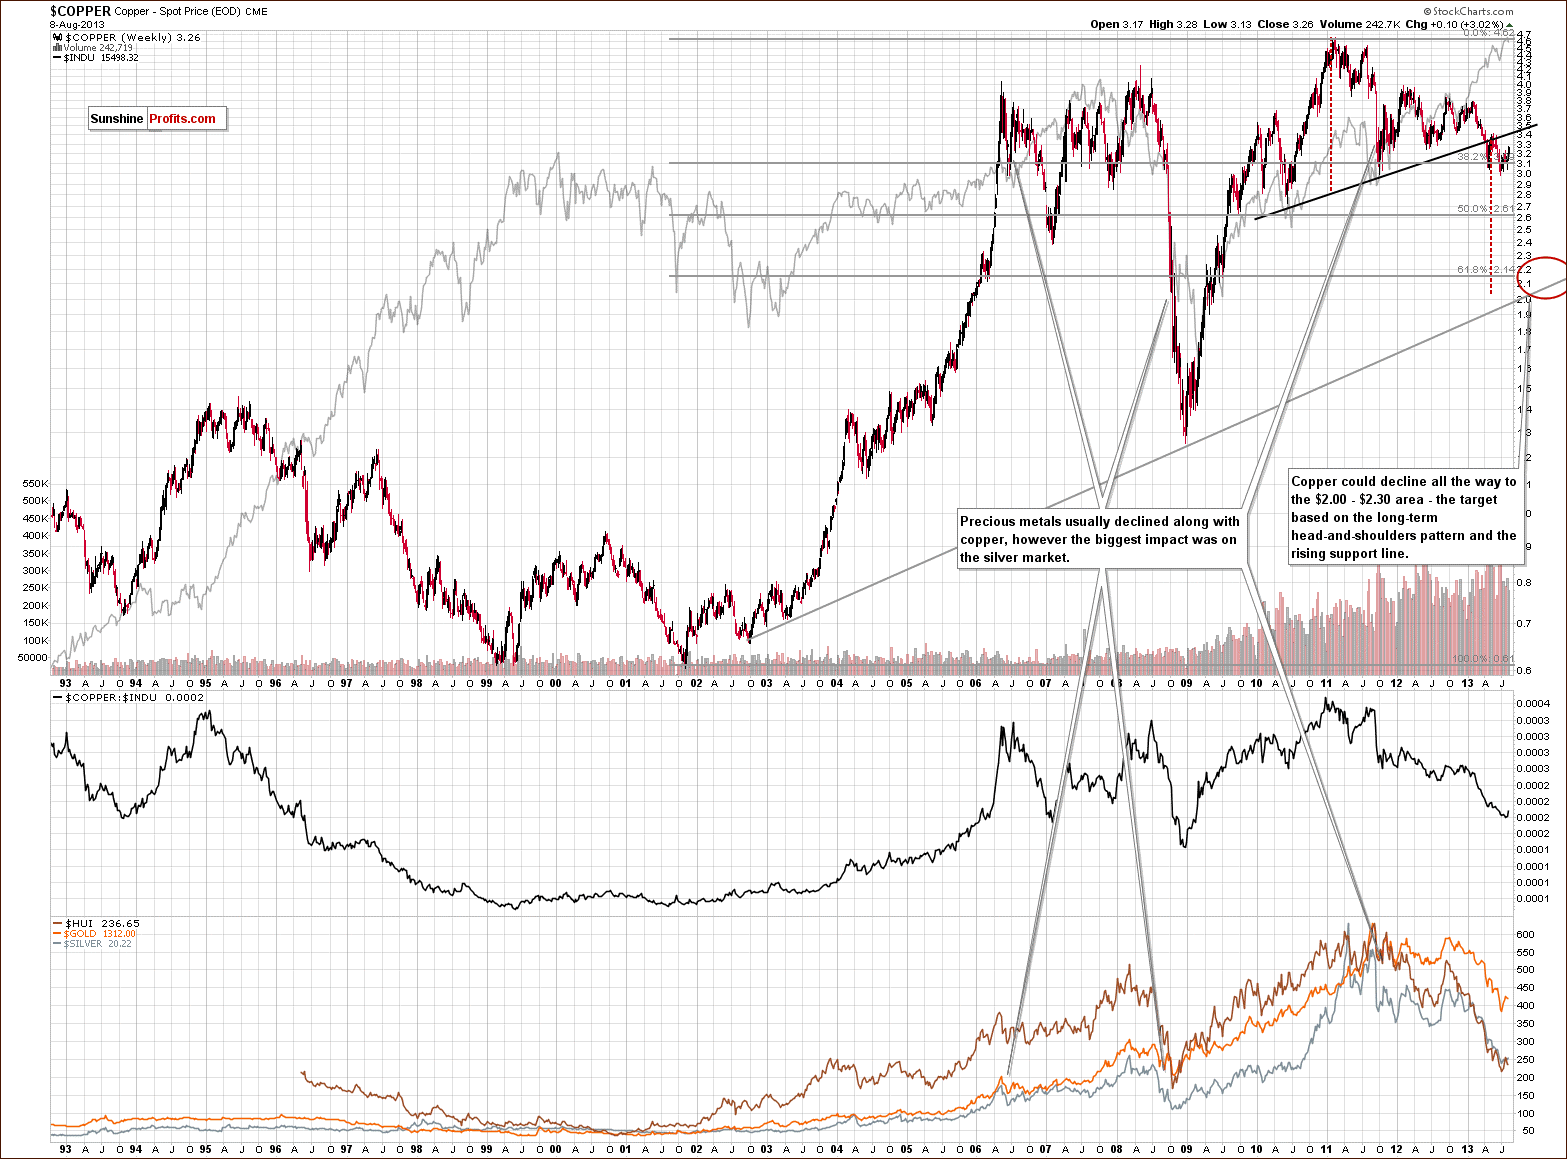
On the above chart, we clearly see a big head and shoulders pattern. According to theory, a move below the neckline triggers further declines. In the above case, copper dropped below the support level based on the June 2010 low and the October 2011 bottom and has already confirmed this breakout. The price target for the pattern is around $2.00 -$2.30.
As we wrote in our Market Alert on August 6:
Copper itself could move to the $2.00 - $2.30 area before bottoming, as this is where two strong support levels intersect: the rising long-term support line and the Fibonacci 61.8% retracement level based on the entire 2001 - 2011 rally. This level is also in tune with the target based on the big head-and-shoulders pattern which has already been completed and verified.
In short, this would likely take precious metals lower and, in fact, could be the catalyst needed for the final big drop to begin.
With plunging copper, we could see a big drop in gold and a much bigger drop in silver. Please recall that we have been expecting to see silver's sharp underperformance at the end of this decline and the situation in the copper market seems to fit this scenario very well. Falling copper could ignite a big decline in the silver-to-gold ratio and create a technical situation which previously was seen right before major bottoms.
Gold & Silver Correlations
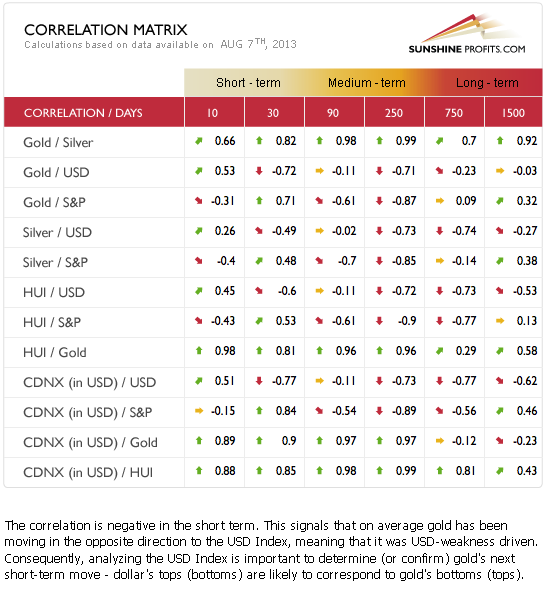
The Correlation Matrix is a tool which we have developed to analyze the impact of the currency markets and the general stock market upon the precious metals sector (namely: gold and silver correlations). Basically, there are no changes in the values of coefficients since we commented on them previously in last week’s Premium Update:
We have seen negative correlation between the metals and the USD Index, while the general stock market coefficients with the metals are pretty much neutral. Taking the short-term, bullish outlook for the USD Index into account, the implications for gold, silver, and the mining stocks are clearly bearish at this time.
At this point we would like to add that even though the USD Index declined by almost a full index point this week, gold didn’t rally – it moved lower by about $3. Gold’s underperformance remains in place – or at least Thursday’s rally is not enough to change it.
Gold
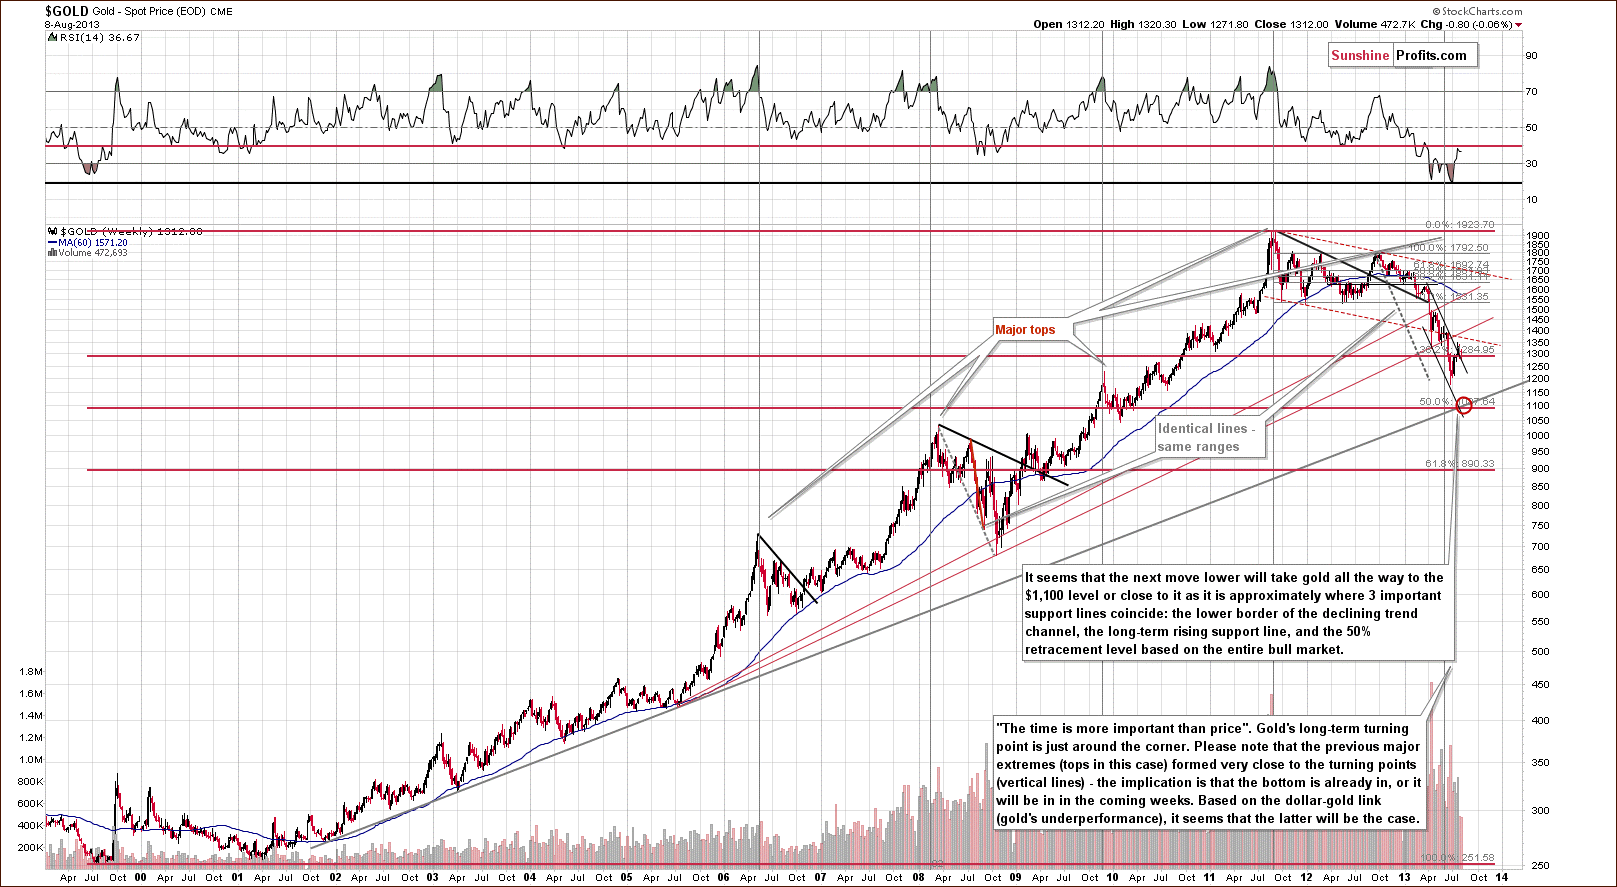
On the long-term gold chart, we see that the situation hasn’t really changed. We see that gold declined to the combination of two support/resistance levels – the Fibonacci retracement level and the upper border of the declining trend channel – and then pulled back on Thursday. However, we need to take into account gold’s extreme underperformance relative to the USD index in recent days and weeks. It simply seems to be a pause at this time, not a bottom.
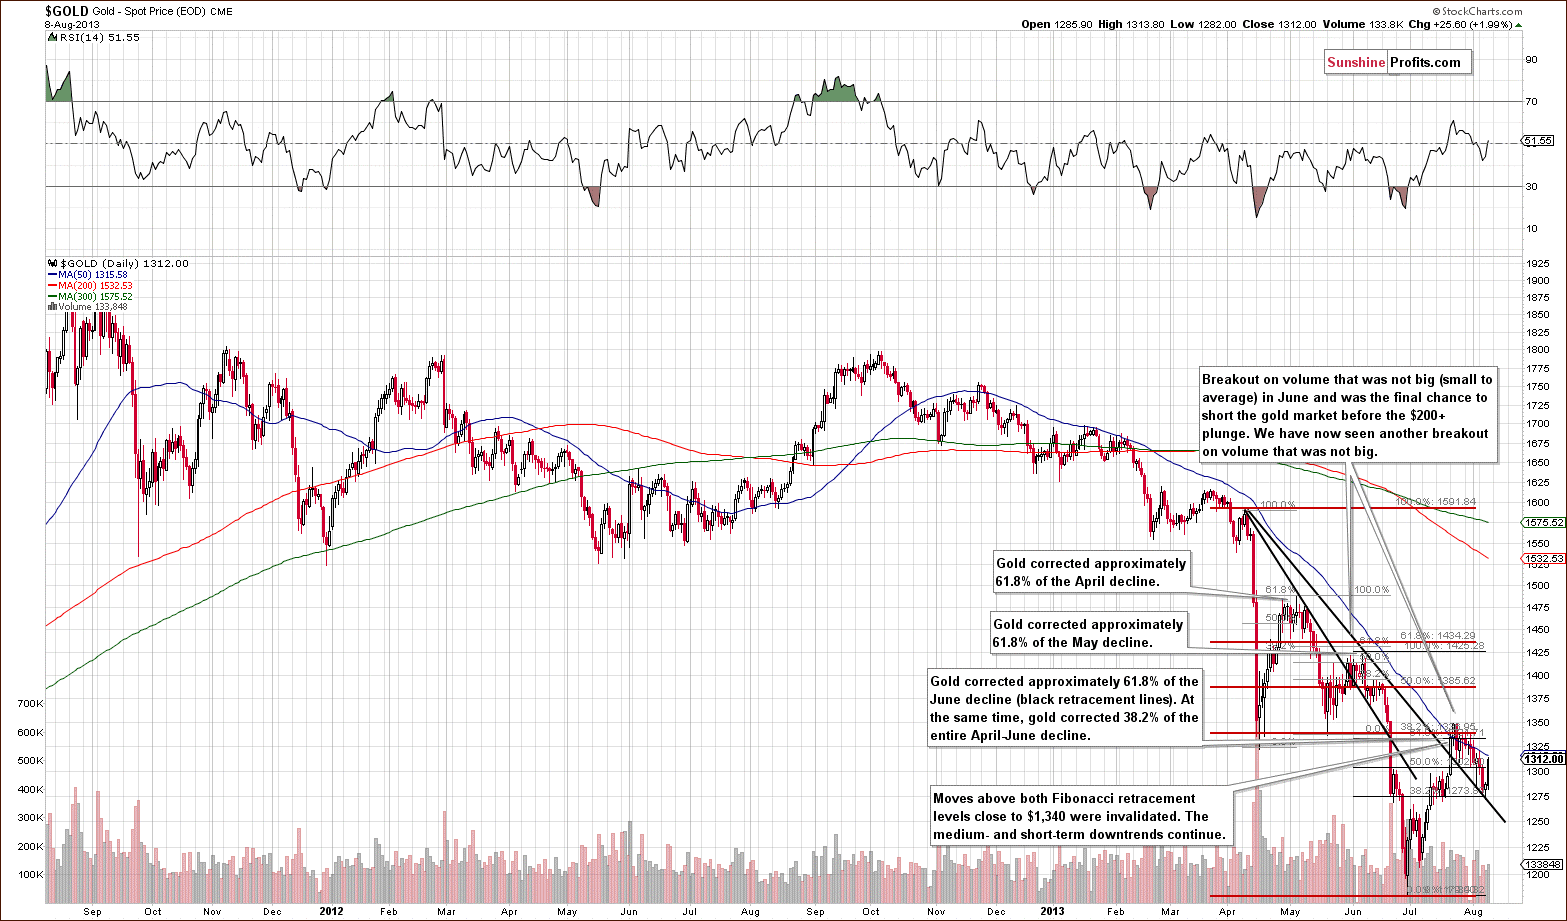
On the above chart, we see once again that gold stopped or paused at the intersection of the two support levels and pulled back on Thursday. Please note that this price action is similar to what we saw in June.
We discussed this situation in Wednesday’s Market Alert:
Gold moved to its declining support line (based on the April and June highs) which remains in tune with what we had seen at the beginning of the previous decline, on June 11. At that time gold bounced slightly and then plunged.
Just before the plunge in June, gold corrected about one-half of its early-June decline. It was at that time when the USD Index was forming its final lows after a huge short-term decline. We saw something very similar on Thursday. We had one day of higher prices in silver after quite a calm week. Again – the situation is quite similar here.
Now let’s take a look at the chart featuring gold‘s price from the non-USD perspective.
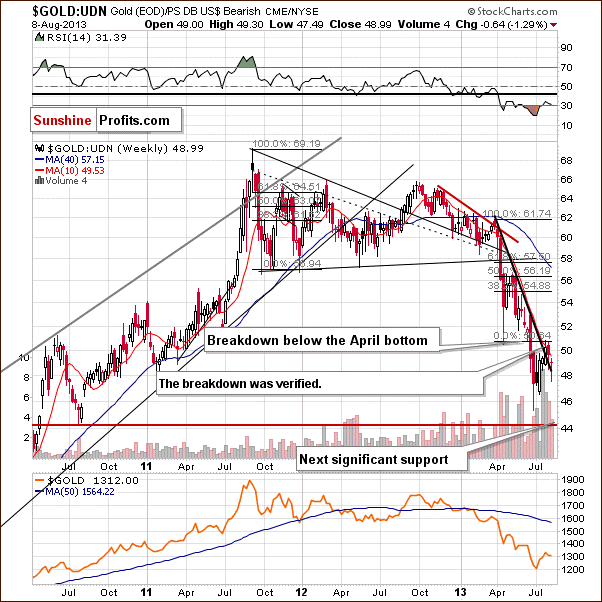
As we wrote in our previous Premium Update:
It’s worth mentioning that last week’s move to the upside took gold above the declining support/resistance level. However, we think that gold’s failure to move back above the April bottom is more significant.
On this week‘s chart, we clearly see that gold showed weakness in the past week as well as this one, and the breakdown below the April’s bottom was verified.
Gold has not broken below the declining support line so far. When it does, the decline is likely to accelerate. Once this has happened, however, it could be too late to open short positions as the decline can take place very quickly.
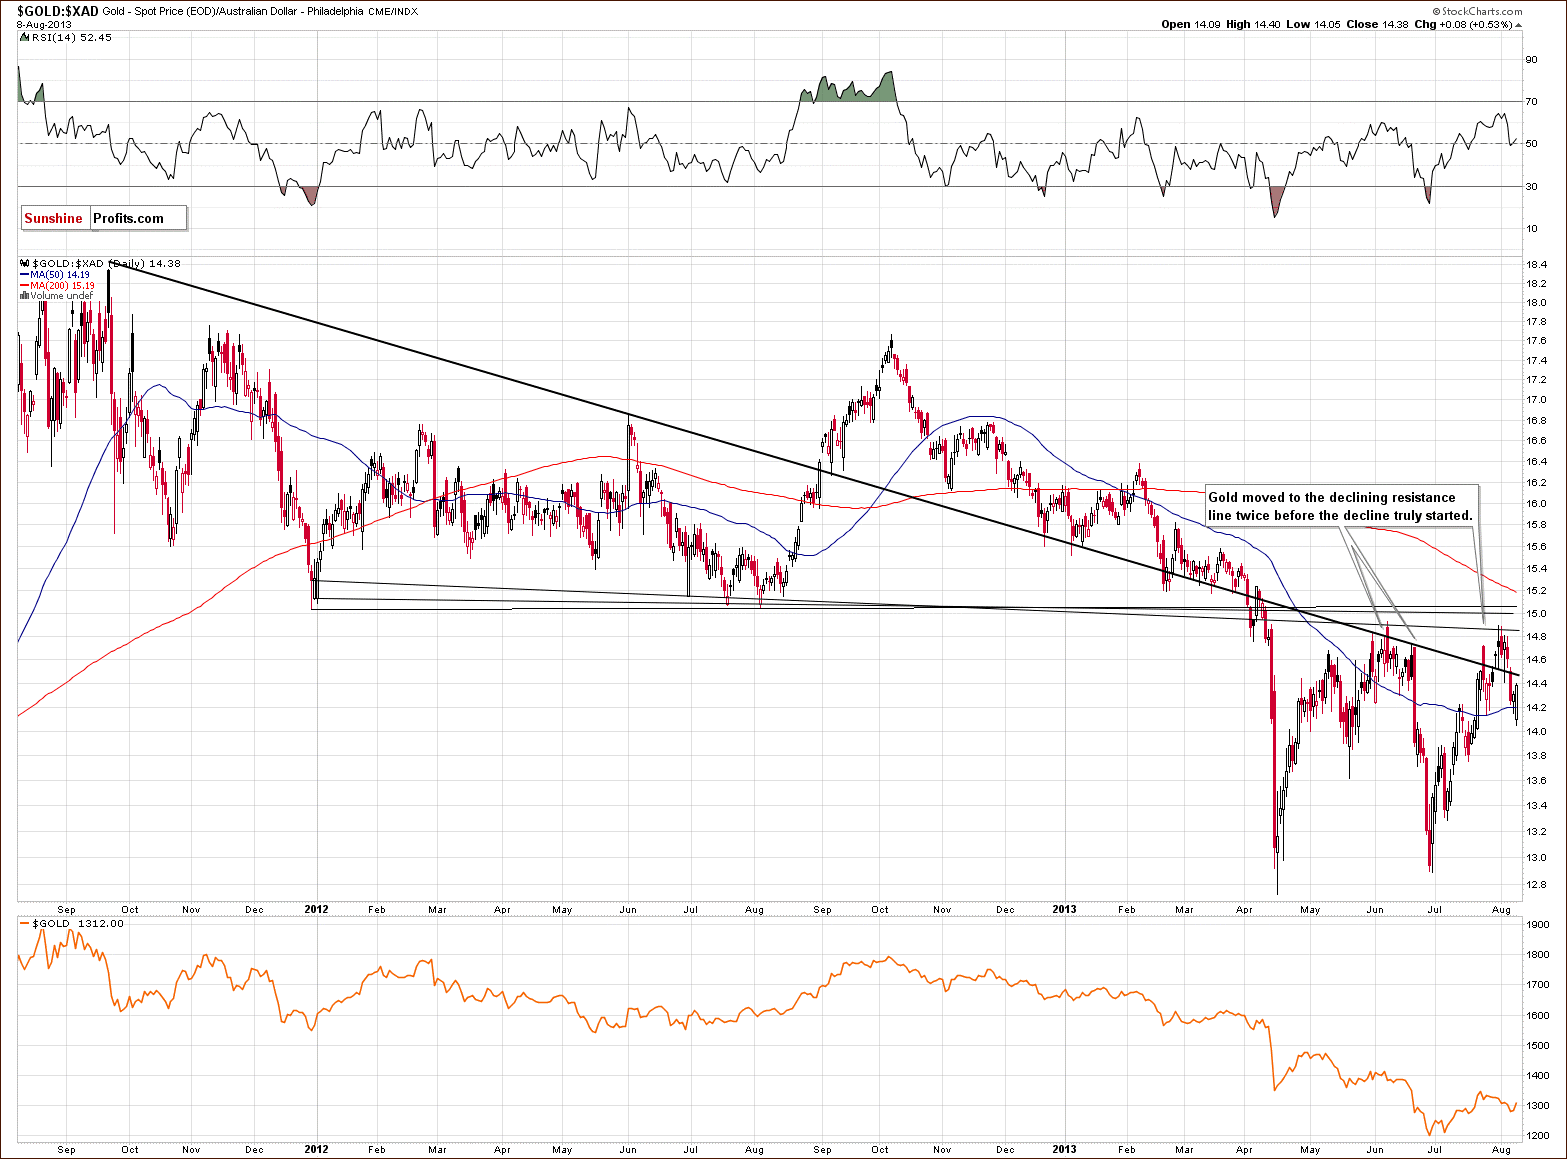
On the gold priced in Australian dollar chart, we see that the previous breakout was invalidated very quickly, and the price came back below this declining resistance line. However, buyers didn’t give up and triggered one more move to the upside. That increase resulted in the next breakout above the previously-broken resistance/support line.
Despite this growth, gold did not manage to break above the June top as the above-mentioned strong resistance level stopped the rally. The corrective move took the yellow metal below the previously-broken resistance/support line and reached the 50-day moving average.
Keep in mind that we saw a similar price action in June. After the invalidation of the breakout above the above-mentioned declining support/resistance line, there was a pullback to this resistance line. The buyers, however, didn’t manage to push gold above it, resulting in strong declines. This time, the gold bulls were stronger and pushed the price a bit higher, but it doesn’t change the similarity of these two situations (still looks like a double-top pattern).
In June, the strong corrective move took gold‘s price all the way back down to the April bottom area. If we see similar price action here, gold priced in Australian dollars will likely decline heavily once again.
So, from this point of view, the recent price increase hasn’t changed the current outlook, and the implications remain bearish.
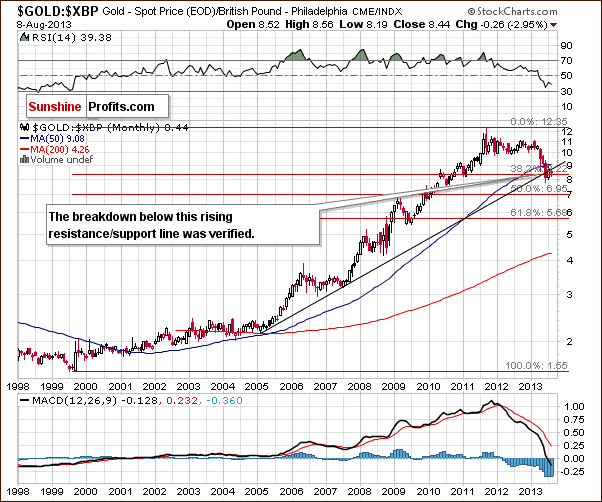
After the recent decline, gold priced in British pounds moved above the rising resistance line. Although the monthly candlestick closed slightly above this resistance line, the breakout was not confirmed. At the beginning of the month, gold reversed and moved back below not only this previously-broken rising resistance line, but also below the 38.2% Fibonacci retracement level.
Consequently, we don’t really view this chart as bullish.
Summing up, the situation in gold remains bearish. Gold moved higher on Thursday, but overall it’s down $2.90 this week, while at the same time, the USD Index is down almost a full index point. Gold continues to underperform the dollar and a one-day rally on relatively low (compared to the size of the rally and volume accompanying previous days’ declines) volume doesn’t change that. The situation remains in tune with what happened in June right before the big plunge.
Silver
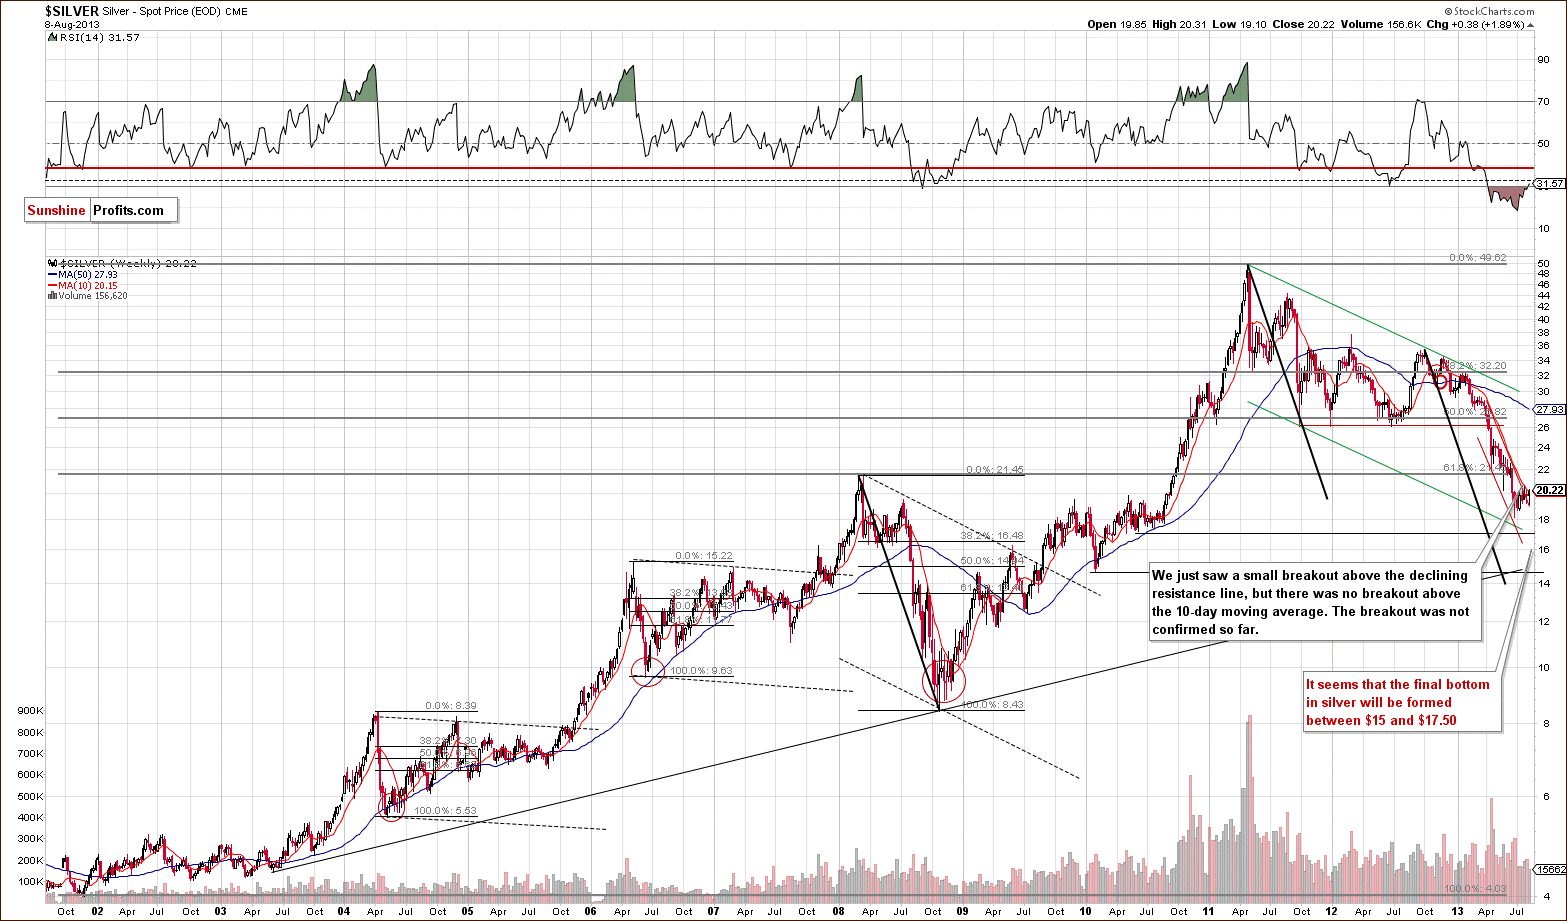
In this week’s very long-term silver chart, we see that silver is trading very close to the upper border of the declining trend channel, but it mostly remains below the 10-week moving average. Silver moved a few cents above it on Thursday, but that’s not enough to make the breakout meaningful.
We see the current price action more clearly in the daily SLV ETF chart.
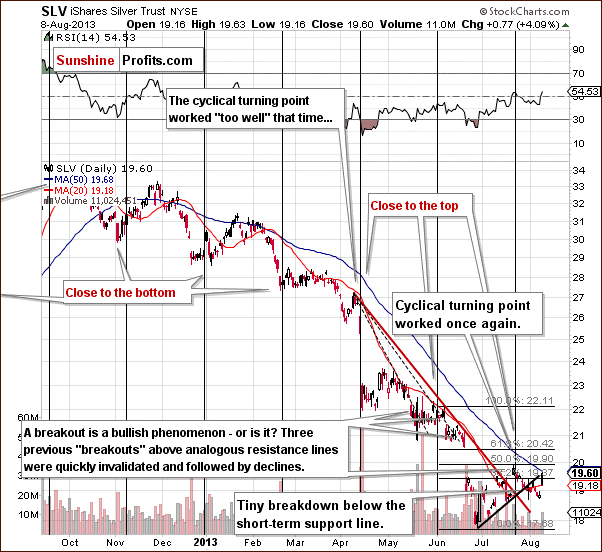
Please note that in the previous two cases when the precious market declined heavily silver was not volatile until the final part of the decline. So, just because silver didn’t decline so far does not mean that it won’t move down with vengeance in the days/weeks ahead.
Moreover, please note that, in the past, silver has moved higher on the day just before the declines really began. This was seen in early June and also in early April. Consequently, it’s not that clear that Thursday’s move higher in silver is a really bullish phenomenon.
Summing up, the outlook remains bearish for the white metal even despite the strength shown on Thursday.
Palladium
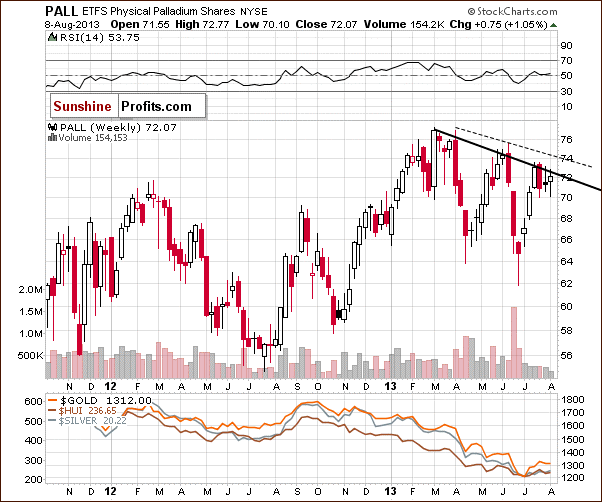
On the above chart, we see that the declining resistance line based on the 2013 top and the May peak (in terms of weekly closing prices) stopped buyers. It resulted in another decline last week. Although we saw a pullback this week, the bulls didn’t manage to push the prices above the resistance line. It seems that we have a bearish head-and-shoulders pattern underway.
This might result in further declines and the implications for the precious metals sector are therefore bearish.
Gold and Silver Mining Stocks
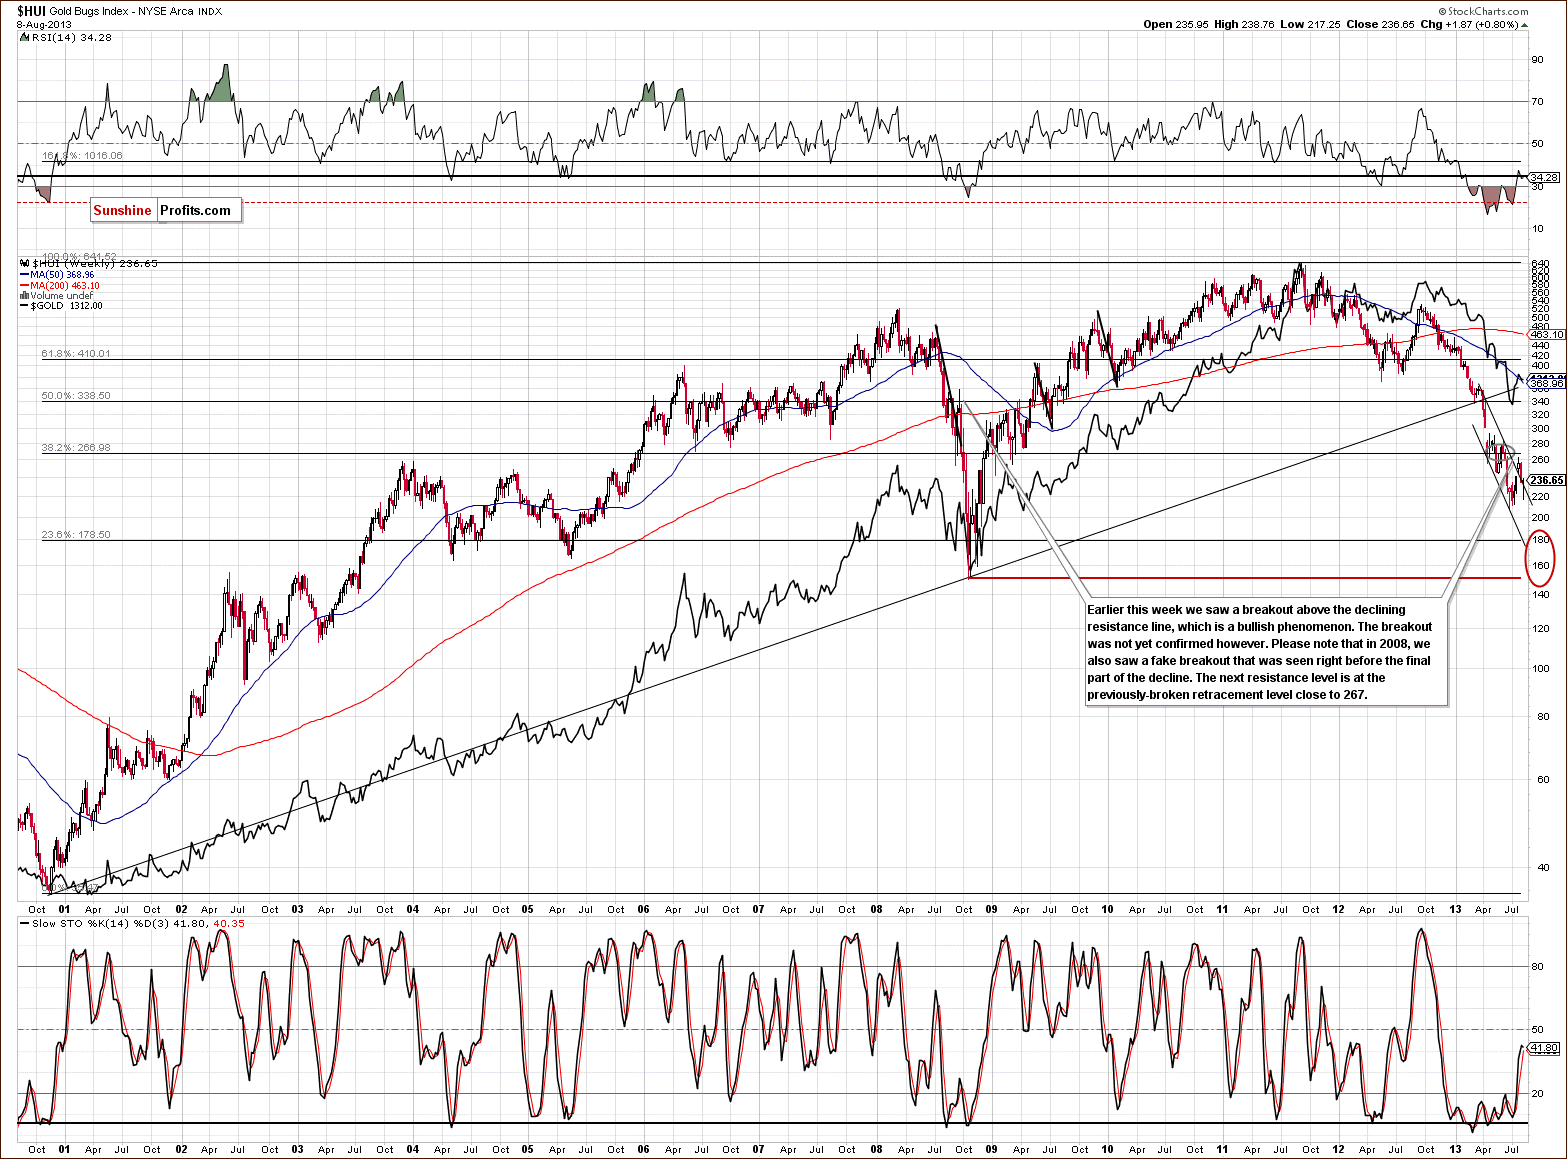
In this week’s very long-term HUI index chart (a proxy for the gold stocks), we see that the mining stocks returned to the trend channel, and this retraction was confirmed by three consecutive closes.
We previously wrote that a move back into the declining trend channel would be a bearish phenomenon. From this point of view, the situation has become more bearish, and it seems that the only thing that last month’s rally did was to verify the breakdown below the April’s low.
On Thursday, the HUI Index moved a bit above upper border of the declining trend channel, but the breakout (the part of the move above the resistance line) was insignificant. We would need to see 2 more consecutive closes above it for the situation to become bullish for the very short-term.
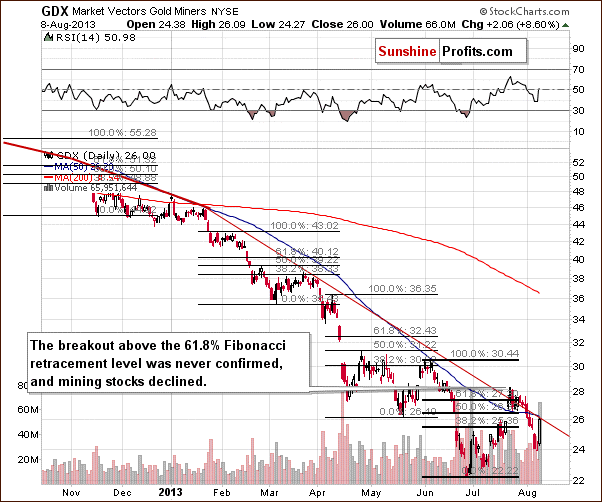
In this week’s medium-term GDX ETF chart, we see that the mining stocks dropped in recent days and moved below the previously-broke declining support/resistance line. Despite Thursday‘s move to the upside, they are still below this line.
At this point, it’s worth mentioning the 61.8% Fibonacci retracement level. As we see on the above chart, the breakout above this level was never confirmed, which led to the above-mentioned decline.
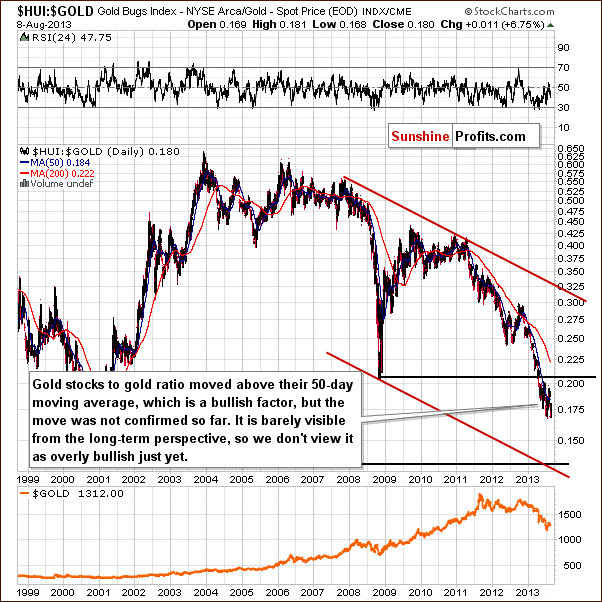
The pullback in the gold stocks to gold ratio was visible from the long-term perspective. It seems that it’s already over, and the ratio continues to move lower in tune with main trend which is currently down. Thursday’s pullback took the ratio back to the middle of its recent trading range, but by no means did it invalidate the main trend.
The strong support level is relatively far away, so we might see another significant downswing before a bottom is formed.
Summing up, the outlook for the mining stocks remains bearish, and the trend is still down despite Thursday’s strength. The breakdown below the April low was not invalidated, and the short-term breakout above the 61.8% Fibonacci retracement was never confirmed, which led to the recent decline. Thursday’s show of strength doesn’t change much as it was stopped by the declining resistance line, which can be seen on the GDX chart.
Letters from Subscribers
Q: I read that SP feels the bottom is not for precious metals. My question is, once the next drop occurs, will it be the beginning of an eventual move up? Will it stagnate for years at this lower level or does SP see moves that will take it above its last high?
A: We think that gold will not stagnate below the recent lows (below $1,200) for years. In fact, our best bet is that gold will not stay there even for several months. We think that the coming bottom will be the beginning of another move up that will take precious metals above their previous highs.
Q: Apart from the odd days, like two days ago, I have noticed that silver tends to sell of in foreign markets, but when the New York NYMEX opens the dips seem to be bought and the trend is generally up. Is this a worry for the short side?
A: We don’t think that it’s really important right now. If you examine the daily candlesticks on the SLV ETF chart (to see what part of the move happened during the session – within the candlestick – and which between sessions) you’ll see that the moves lower took place both during US trading and between sessions. Moreover, the moves were very small on an intra-day basis in recent weeks (except Thursday’s session of course), so it’s a tough call to say if this pattern would be meaningful even if it was visible from the SLV perspective.
Q: Dear Sunshine profit Thank you for your through works. Gold declined today breaking $1300 support line as you've been saying. I'm wondering about the big decline you've been telling us. Would there be a possibility to make double bottom keeping about $1200 support line or basing around this price? Is it good idea to sell half of short position at this price? What would be a catalyst of the further big drop? And it was a roller coaster ride in gold price here in us with FED meeting, non farm payroll job data last week. Any thought about September FED meeting and tapering? Thank you very much. Best wishes
A: Yes, there is a possibility that gold will form a double bottom around $1,200. It's more likely in our view, however, that it will move as low as $1,100. The underperformance of gold relative to the USD Index suggests a move much bigger than just several tens of dollars. Plus, the support level at $1,100 is much stronger than the previous bottom close to $1,200, and it seems that we'll need strong support to stop this medium-term downtrend. We'll keep watching for bullish signs, though. If we see divergences, strength in gold relative to the USD or other bullish signals, we may suggest closing short positions and going long even before gold hits $1,100.
The final decision is up to you - we don't know details of your portfolio and financial situation, and we can't provide investment advice, but we do think that metals will move lower and, thus, that having a short position now seems justified in general.
As far as the catalyst for the next big drop is concerned, it's a tough call to say what it will be. It could be a decline in copper, or it could be a rally in the USD Index - or both, or perhaps something else. The most important thing is that metals seem to be willing to decline and are just waiting for any catalyst - that's how one can translate gold's underperformance relative to the moves in the USD Index and the miners' underperformance relative to gold. Because of the above, what really happens regarding the tapering in September doesn't seem that important - the markets will likely move before that based on the rumors about what is likely or might happen. Actually, we wouldn't rule out the situation in which someone says that the Fed will limit QE in September - gold plunges and in the end we would hear in September that there will be no tapering yet after which gold rallies. In fact, this scenario seems quite likely.
Summary
Gold declined this week by about $3.00 so far even after Thursday’s pullback. At the same time, the USD Index declined by almost a full index point. Gold’s underperformance clearly remains in place.
The USD Index is at its medium-term support which stopped the previous volatile decline (gold topped at that time), and it seems that it will be the case once again.
Silver moved sharply higher on Thursday after a several-day-long pause, which is something that we saw right before big declines in the recent past. Yes, it could be the beginning of a new rally, but we don’t view this as a likely outcome.
The HUI Index declined earlier this week and pulled back on Thursday. When it declined, it confirmed the breakdown below the declining support line, and the subsequent move back up is an unconfirmed breakout at this time. Consequently, the outlook still remains bearish.
All in all, Thursday’s rally, although eye-catching, changed the situation much less than one might think. The outlook for the precious metals sector for the weeks ahead remains bearish.
Trading – PR: Short positions in gold, silver and mining stocks.
Trading – SP Indicators: No positions: SP Indicators suggest long positions, but the new self-similarity-based tool suggests short ones for the precious metals sector, and we think that overall they cancel each other out.
Long-term investments: Half position in gold, silver, platinum and mining stocks. As far as long-term mining stock selection is concerned, we suggest using our tools before making purchases: the Golden StockPicker and the Silver StockPicker
| Portfolio's Part | Position | Stop-loss / Expiry Date |
|---|---|---|
| Trading: Mining stocks | Short | 273 (HUI), $29.4 (GDX) / - |
| Trading: Gold | Short | $1,356 / - |
| Trading: Silver | Short | $20.90 / - |
| Long-term investments: Gold | Long - half | - |
| Long-term investments: Silver | Long - half | - |
| Long-term investments: Platinum | Long - half | - |
| Long-term investments: Mining Stocks | Long - half | - |
This completes this week’s Premium Update. Our next Premium Update is scheduled for Thursday, August 15, 2013. We will continue to send out Market Alerts on a daily basis (except when Premium Updates are posted) at least until the end of August 2013 and we will send additional Market Alerts whenever appropriate (like the one that you received yesterday).
---
Starting today, we’re accepting subscriptions to our monthly Market Overview report. It will be extensive enough to analyze trends that are too big for the weekly Premium Updates.
Market Overview is not a substitute to Premium Updates by any means. It’s an add-on that enables you to see great things from the distance. The price tag is liberal. $14.95 per month.
Important: This first month, and only this month, the subscription is just $9.95. That’s because we want to make it initially available to as many readers as possible.
In fact, there is also an unintentional bonus: You’ll get 2 reports for $9.95 instead of just 1 for $14.95. That’s because we are a bit late with publishing the August report. (Normally, it will go out in the first days of each month). So, your $9.95 subscription will still be active when September’s Market Overview is out.
Please click here and subscribe now.
---
Thank you for using the Premium Service. Have a great week-end and a profitable week.
Sincerely,
Przemyslaw Radomski, CFA


