- Euro & USD Indices
- General Stock Market
- Copper
- Crude Oil
- Correlation Matrix
- Gold
- Silver
- Mining Stocks
- Letters from Subscribers
- How to short gold?
- Technical analysis - a matter of preference
- Impact of the India / China buying on our analysis
- Should one go partially into precious metals at this time?
- Summary
Capitalism may be changing in front of our eyes but no one can tell what a future model will look like. Gold has done well through the centuries in almost every economic system conceived by human beings. The way that capitalism may evolve in the future may have an effect on gold.
The global financial crisis of 2008 created an ideological and philosophical crisis that caused many to eulogize capitalism and search for alternate models. Even in the World Economic Forum, in the Swiss mountain resort of Davos questions were raised that in past years interested only the demonstrators agitating outside. Does capitalism have a future? What are the values upon which one can define capitalism in the 21st century? What will the global economy look like?
Writing in the Huffington Post after the Davos Conference in 2012, Klaus Schwabb, the conference’s founder and executive chairman, wrote “Many participants were asking whether capitalism, with all of its excesses, still has a place in today's world. The media, meanwhile, speculated that if even managers and bankers were raising doubts about the system's future, then perhaps capitalism had already been laid to rest in Davos.”
With the recent demonstrations in various countries around the world, the Middle East, Turkey, and Brazil being the latest, it seems clear that many believe that the current system favors the rich. The free market economies that western nations have adopted in the past 30 years have led to one of the longest periods of growth in the history of capitalism.
But it doesn’t seem to have trickled down much. However, with all its inherent problems, there is no competing economic system to replace it as of yet. Despite the financial crisis, there are no signs of any serious rival to capitalism emerging in the foreseeable future. Nevertheless, there are various visions being proposed.
Ed Miliband, the leader of Britain’s Labour Party, calls for “responsible capitalism.” In a talk he gave at a Google event, he showed a photo of Montgomery Burns, the cartoon character on The Simpsons, who runs the local nuclear power plant and leaves radioactive nuggets lying around.
“He illustrates my case today because there is a choice to make. A choice between an "irresponsible capitalism" which sees huge gaps between the richest and the poorest, power concentrated in a few hands, and people are just in it for the fast buck whatever the consequences. And a "responsible capitalism", and this is an agenda being led by business, where companies pursues profit but we also have a equal society, power is in the hands of the many and where we recognize our responsibilities to each other.”
In 1714, the English-Dutch philosopher Bernard Mandeville, wrote a satirical poem called the Fable of the Bees about a thriving bee hive that succeeds until the bees develop a sense of morality. The basis for the poem is the idea that people are motivated by greed and the reason they don’t break the law is fear. In short, human beings are egotistical beings who care only about themselves.
Although the Fable of the Bees was taken at the time as an attack against the church, over the years it got a second reading as a prophetic text that voiced some of the basic principles of the free market economy. The poem suggests many key principles of economic thought, including division of labor and the invisible hand, seventy years before these were more deeply elucidated by Adam Smith. John Maynard Keynes cited Mandeville who said that if everyone acts out of selfish motives to improve his own situation, the entire society will prosper and prosperity will trickle down.
Now, 300 years after the publication of the poem, we know that it doesn’t quite work that way. Five years after the great financial crisis of the past 80 years—a crisis caused partly by gross greed—one can come to the conclusion that the hive is somewhat out of control.
The British economist Geoff Mulgan, key advisor to Gordon Brown and Tony Blair, claims that Mandeville missed out one important insect in his fable—the locust. In his book The Locust and the Bee: Predators and Creators, published early this year, Mulgan divides the economic world into two types, the bees and the locust. The bees in this analogy are the entrepreneurs, the small business owners, the innovators, the people working hard to better themselves and by doing so are also improving all of society. The locusts, on the other hand, are the financiers who have caused the financial crisis, who don’t create anything and who don’t think about the future, only about immediate profits.
The book’s first chapter is entitled “After Capitalism” with a suggestion that capitalist economies might evolve into something different. Mulgan’s analysis is based on the assumption that, for practical and political purposes, capitalism is here to stay.
“Creators, makers and providers,” he writes, “create valuable things for others” while “takers and predators” are those who “extract value from others without contributing much in return. In Mulgan’s version, the bee “is quietly productive, providing benefits to many. It is also intensely co-operative.” The implication is that capitalism will improve to the extent that it encourages bee-like virtues. It is up to government to regulate and hold back the locust, says Mulgan.
However, the idea of Mandeville’s fable is that capitalism’s productivity is accompanied by moral hazard and comes from harnessing private vices – rivalry, greed predation – to public benefit.
Professor Eric Maskin, who won the 2007 Nobel Prize for economics, said that societies should not rely on market forces, capitalism, to care for the public good. Inequality is built into the globalization and the capitalistic system, says Maskin. Capitalism offers opportunities to those that have skills whereas those without skills have no place in today’s global economy. Maskin doesn’t see any far reaching changes in the future. In macro terms, he says, in the future it will look like the 2008 crisis had never happened.
Joseph E. Stiglitz, a Nobel Laureate and professor of economics at Columbia, seeks to shift the terms of the debate about capitalism. It is not uncontrollable technological and social change that has produced a two-tier society, he argues, but the exercise of political power by moneyed interests over legislative and regulatory processes.
“While there may be underlying economic forces at play,” he writes, “politics have shaped the market, and shaped it in ways that advantage the top at the expense of the rest.”
Stiglitz argues that a free and competitive market is highly beneficial to society at large, but that it needs government regulation. Without government constraint, dominant interests use their leverage to make gains at the expense of the majority. Concentration of power in private hands, Stiglitz believes, can be just as damaging to the functioning of markets as excessive regulation and political control.
So does the future lie with the bee or the locust? Whatever system may emerge in the future, we are willing to bet that gold will be a part of it.
To see what’s in store in the next week for precious metals, let’s begin this week's technical part with the analysis of the USD Index (charts courtesy of http://stockcharts.com.)
USD and Euro Indices
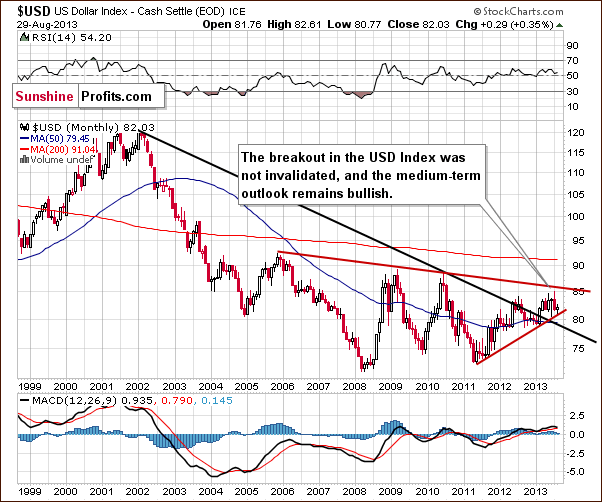
The situation in the long-term chart hasn’t changed much recently.
As we wrote in our last Premium Update:
The breakout above the declining support/resistance line (currently close to 79) was still not invalidated. From this perspective, the situation remains bullish.
Now, let’s examine the weekly chart.
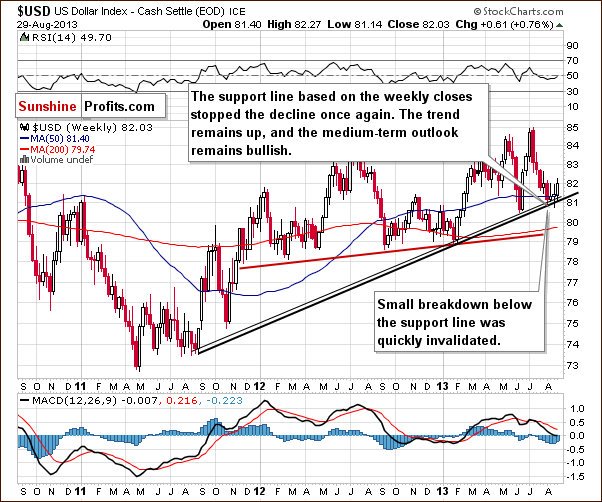
Despite the fact that the USD Index declined once again in recent days, the medium-term support line was not breached. Although we saw a small move below the upper support line, even this small breakdown was quickly invalidated, which is a bullish signal.
From this perspective, the medium-term uptrend is not threatened, and the situation remains bullish. Therefore, we can expect the dollar to strengthen further in the coming weeks. It seems that it will rally sooner rather than later, fueling declines in the precious metals market.
Now, let’s check the short-term outlook.
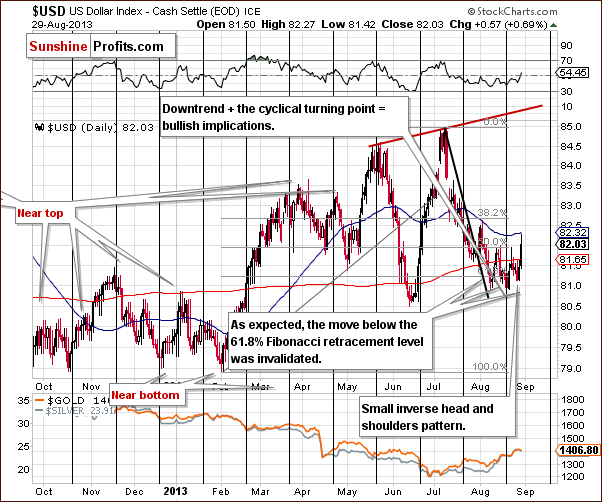
From this perspective, we see that the recent decline once again took the USD Index below the 61.8% Fibonacci retracement level based on the entire February – July rally.
Despite this decline, buyers managed to push the USD Index higher, and the short-term breakdown below the above-mentioned Fibonacci retracement level was invalidated.
When we take a closer look at the weekly chart, we see a small inverse head and shoulders pattern underway (based on three August lows). If the U.S. currency moves higher and breaks above the 82 level, this bullish formation will be confirmed.
Additionally, when we factor in the cyclical turning point (which we see after a monthly decline), the outlook here looks very bullish. In fact, it seems that the USD Index already started to move higher right at the turning point.
Let’s now take a look at the Euro Index.
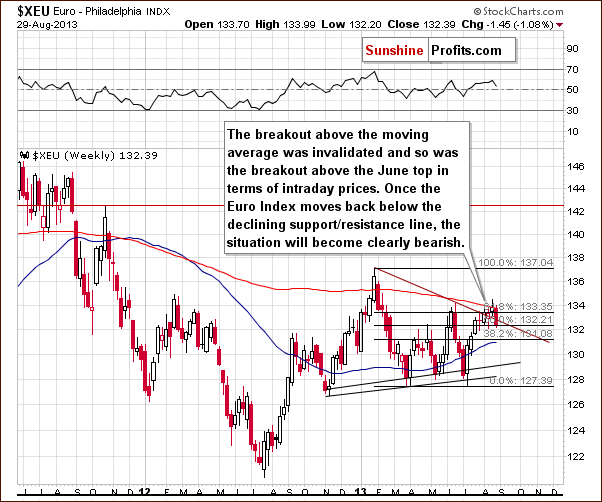
On the above chart, we see that the Euro Index attempted to move above the 200-week moving average once again, but this attempt failed for the second time, and the breakout was invalidated.
Looking at the above chart we can say that history repeated itself, because the European currency is now back at the 61.8% Fibonacci retracement level based on the January - July decline. This is where it was when we posted our previous Premium Update; it simply moved a bit higher temporarily and then declined again. At this time we also see an invalidation of the breakout below the declining support/resistance line based on the January and June highs, which is also a bearish factor.
Summing up, the short-term outlook for the USD Index is bullish and will likely trigger a decline in the Euro Index, which – if it declines back below the declining red support line - will make the outlook for the Euro even more bearish. If this happens, the outlook for the USD Index will become even more bullish. This cycle will likely have bearish implications for the precious metals sector as it unfolds.
General Stock Market
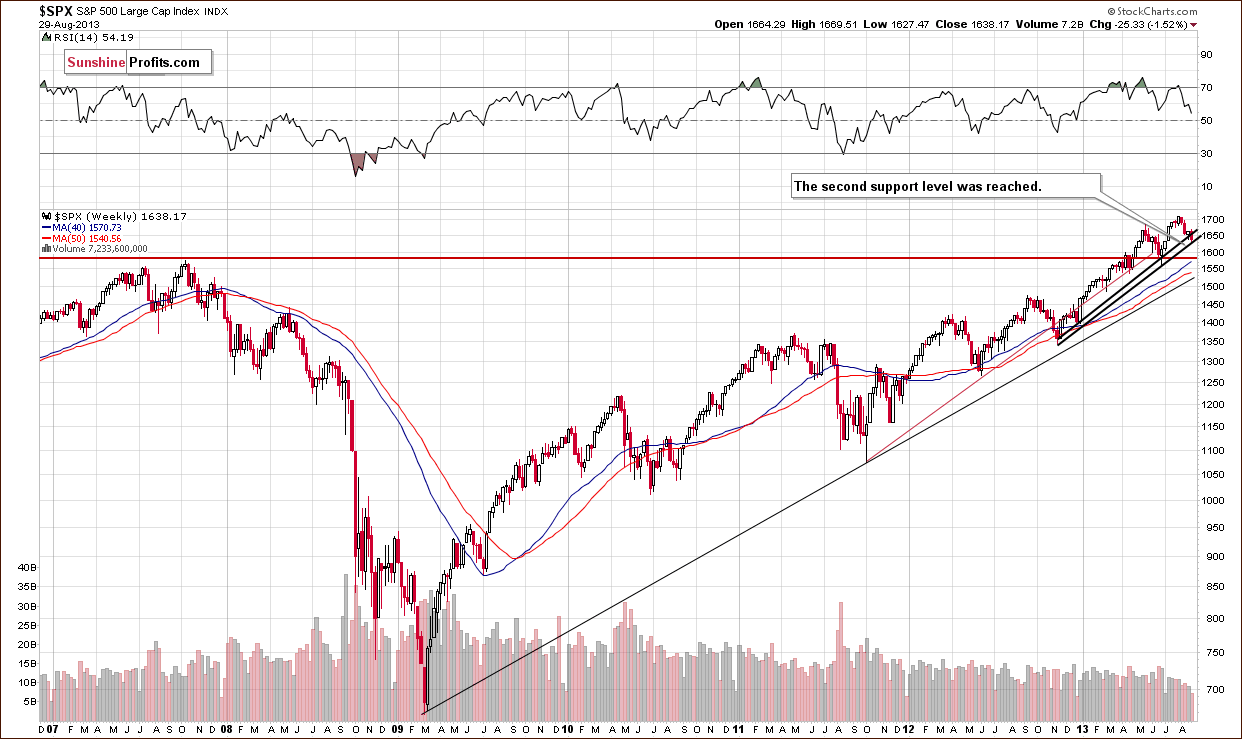
On this week‘s long-term S&P 500 chart, we see that the situation hasn’t changed much from a week ago.
In our previous Premium Update we wrote:
The correction is still shallow from the long-term perspective, and the S&P 500 Index reached the rising support line based on the November 2012 January 2013 lows (in terms of weekly closing prices).
Please note that there is another rising support line based on the November 2012 -January 2013 lows (on an intraday basis), which may stop a correction even if the current support doesn’t hold. Therefore, the downside seems limited.
As you see on the above chart, we witnessed this type of price action in the past week. Technically, the outlook for the S&P 500 index hasn’t changed. It remains bullish.
Before we examine the Broker-Dealer Index chart to see what the financial sector is doing, let’s take a look at the DIA ETF chart, which is another proxy for the general stock market.
Quoting from our previous Premium Update:
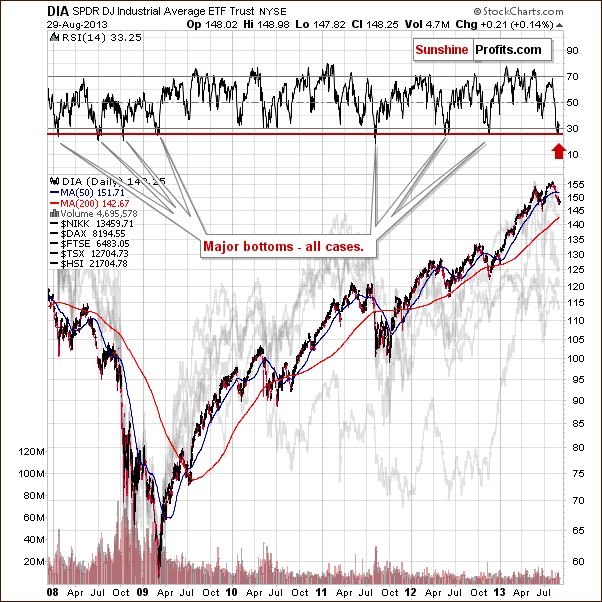
(…) the DIA ETF moved lower, and the RSI based on it moved below 30 - almost to the 26 level. Since the beginning of 2008, there have been exactly 7 cases when we saw something similar. In 4 of them, this meant that an important bottom had just been formed. In the remaining 3 cases, a major bottom was formed in a short time anyway.
Although we didn’t see this signal have an impact in the past week, it is still in play and can lead to a bigger pullback or – more likely – a new up-leg. It seems that the bottom might already be in.
We turn now to the financial sector, which in the past used to lead the rest of the general stock market, to see whether the above is confirmed or invalidated.
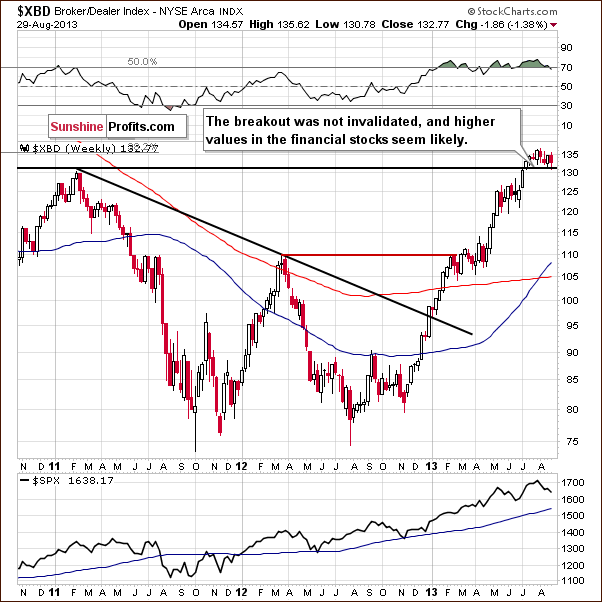
It’s confirmed. On the above chart, we see that there was another downward move which took the financials to the previously broken resistance level of 130. Despite this fact, the financials still remain above the 130 level, which also corresponds to the 2011 top.
The breakout above the level of 130 has not been invalidated, and this confirms that nothing has changed. We can still expect further growth in the financial sector and the general stock market.
Summing up, the outlook for general stock market is very bullish in the medium term and also bullish in the short term.
Copper
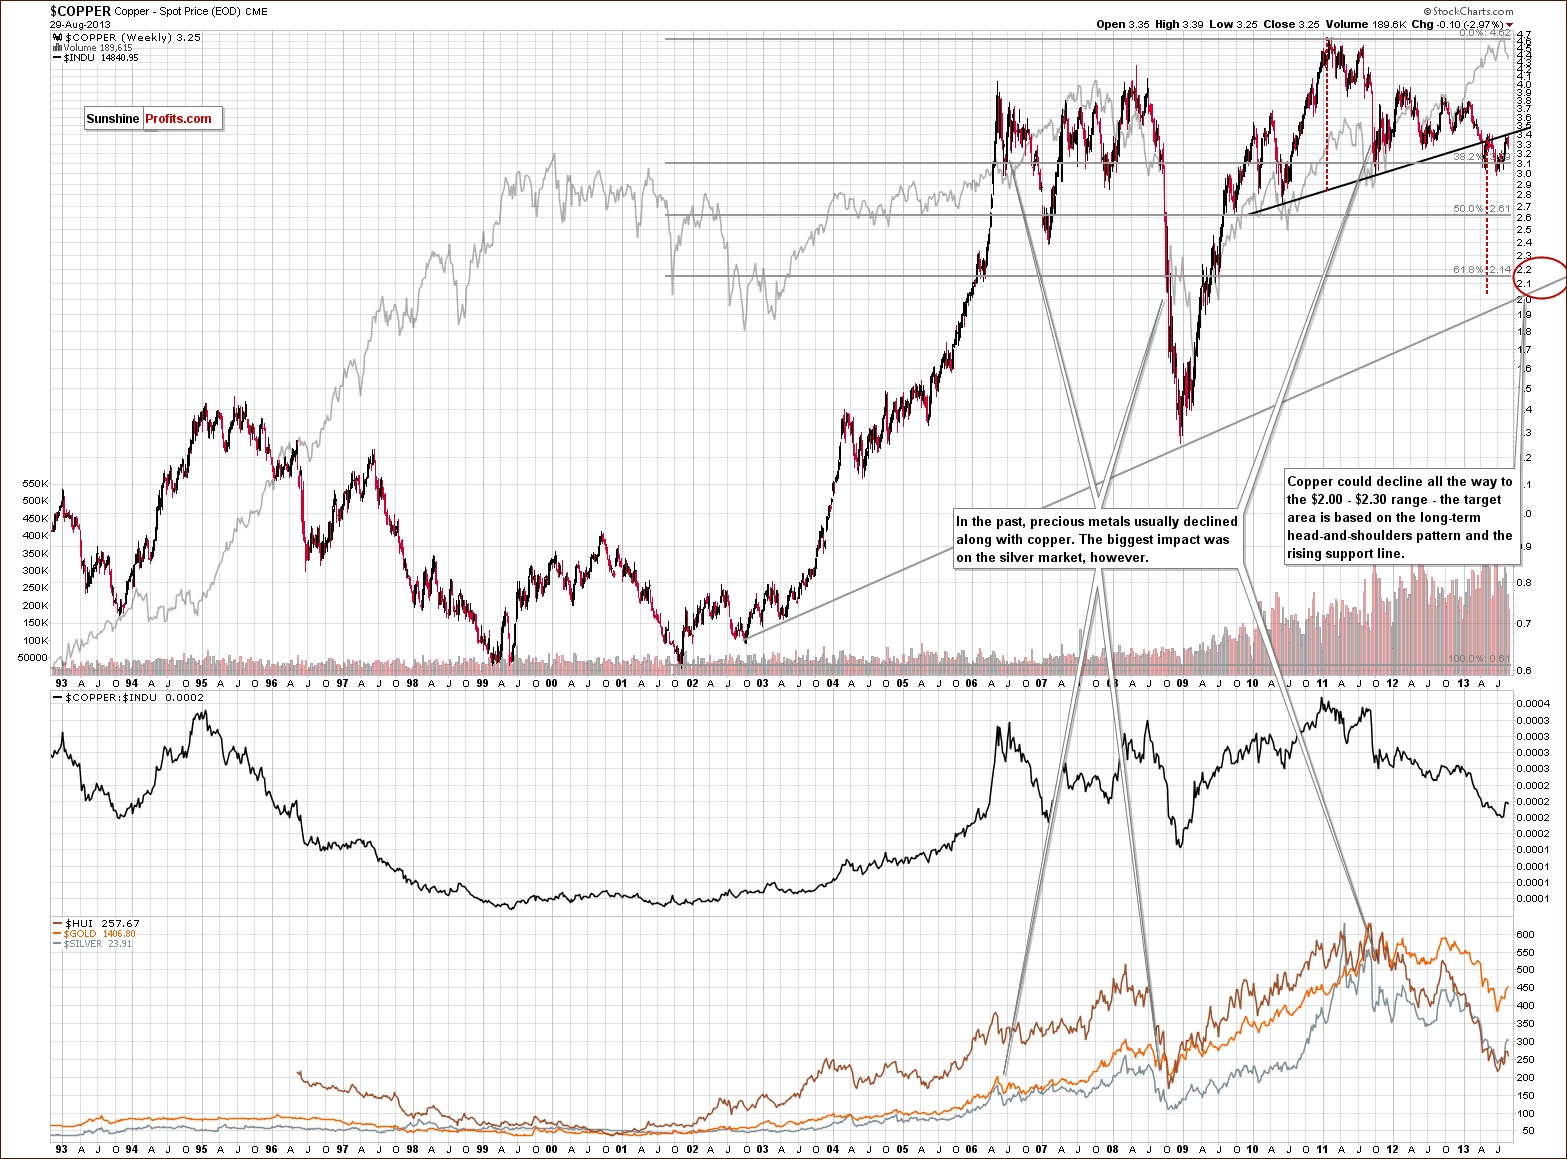
On the above chart we see that there was another short-term correction in the past few days. This upward move took copper to the neck level of the bearish head-and-shoulders pattern once again; however, there was no breakout above it, and the price of copper declined shortly after this neck level was reached. What this means is that nothing has changed as far as the bearish implications of this pattern are concerned.
From this point of view, it was just another correction, which didn’t invalidate the previous large head-and-shoulders pattern or its implications.
Consequently, the medium-term outlook for copper remains bearish.
Crude Oil
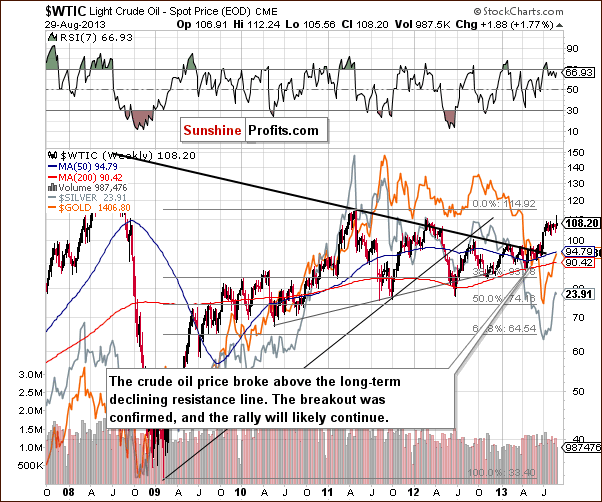
On this weekly chart we see that the oil bulls managed to push the price of crude oil higher, and it reached over $110 per barrel. In this way, oil broke above the March 2012 top, but this breakout was not confirmed.
When we take a closer look at the above chart, we see that there is a strong resistance level based on the May 2011 top, which may encourage oil bears to go short. However, even if the sellers trigger a correction, a downward move to the previously-broken long-term declining resistance line will not disrupt the trend of general long-term increases.
From this perspective the medium-term outlook is bullish, but the short-term outlook is unclear.
If you want more details about the current oil market situation, we invite you to read our Oil Update (it’s free at this time; these updates will become a premium product in a few weeks – similar to the current Premium Updates, but focusing on crude oil).
Gold & Silver Correlations
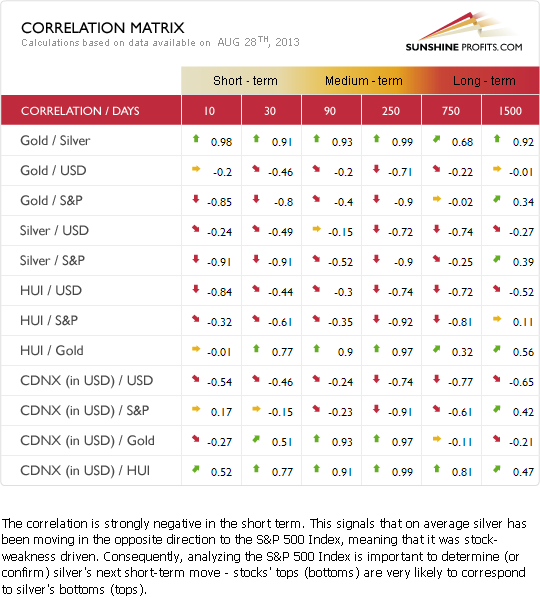
The Correlation Matrix is a tool, which we have developed to analyze the impact of the currency markets and the general stock market upon the precious metals sector (namely: gold correlations and silver correlations).
Basically, the situation in the stock market and the USD Index hasn’t changed as far as the outlook is concerned. There also have been no changes in the values of coefficients since we commented on them previously in last week’s Premium Update. Therefore, the implications that these markets are likely to have on precious metals remain in place and unchanged.
The recent strength in gold relative to the dollar seemed to be a very short-term phenomenon lasting only through last week, and we didn’t see a continuation this week. The coefficients based on the previous 30 trading days are still negative. The medium-term coefficients are also negative; however, the 90-day column has a very small, negative value.
The reason for the 90-day column value being so insignificant is that gold underperformed the USD Index for quite a long time; therefore, the implications are bearish anyway.
Generally, the above provides us with a bearish outlook for the precious metals sector because of the medium-term outlook for the USD Index, which is bullish. Since the USD Index just invalidated a small breakdown below the strong support line, its downside seems very limited.
What’s very interesting is that the correlation between silver and the stock market is strongly negative. It’s negative in the short and medium term. This is so interesting because theoretically, silver used to be positively correlated with the stock market most of the time, which you can see in the very long-term, 1500-day column because of silver’s industrial uses. With the bullish outlook for the stock market suggesting higher values, it seems that the outlook for silver is quite negative in short and medium term.
It seems that we will need to see silver moving higher regardless of what the stock market is doing before we can say that another huge up leg is in the cards for the white metal.
Gold
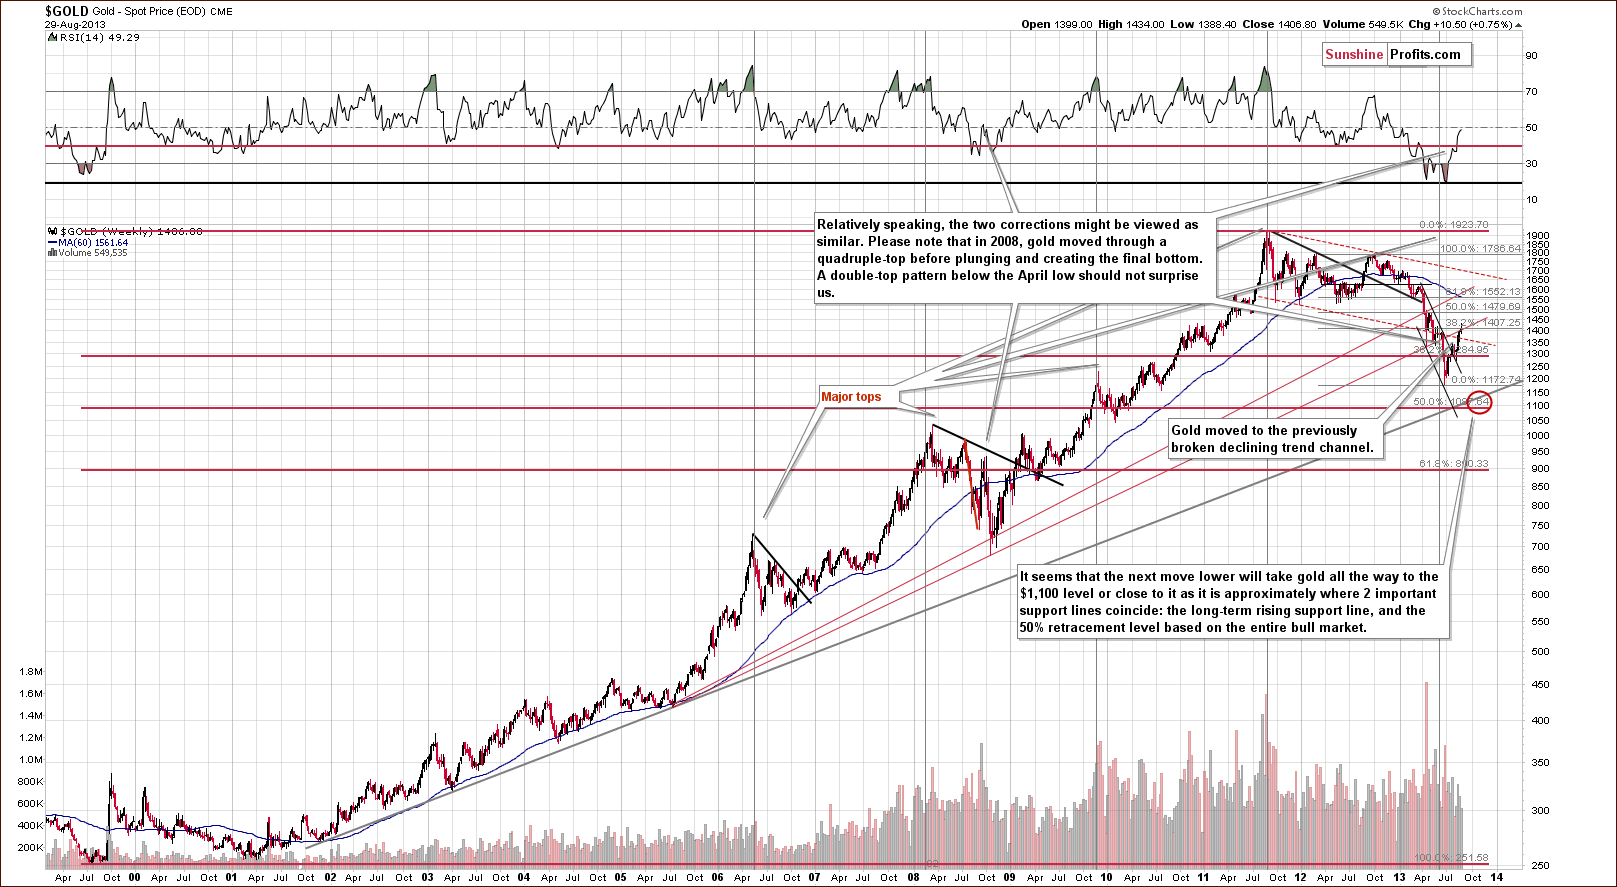
On the long-term gold chart, we see that the yellow metal climbed once again and reached the previously-broken rising support/resistance line based on the July 2005 low and the October 2008 bottom (on an intraday basis). At this point, it’s worth noting that this area is strengthened by the 38.2% Fibonacci retracement level based on the September 2012 - June 2013 decline. Although gold broke above this resistance zone in the past few days, the breakout was not confirmed.
Taking the above-mentioned into account and combining it with the current situation in the USD Index, it seems that gold will not move much above its present level before declining.
From this perspective, the medium-term downtrend remains in place.
Let’s now take a look at the medium-term picture to see more details.
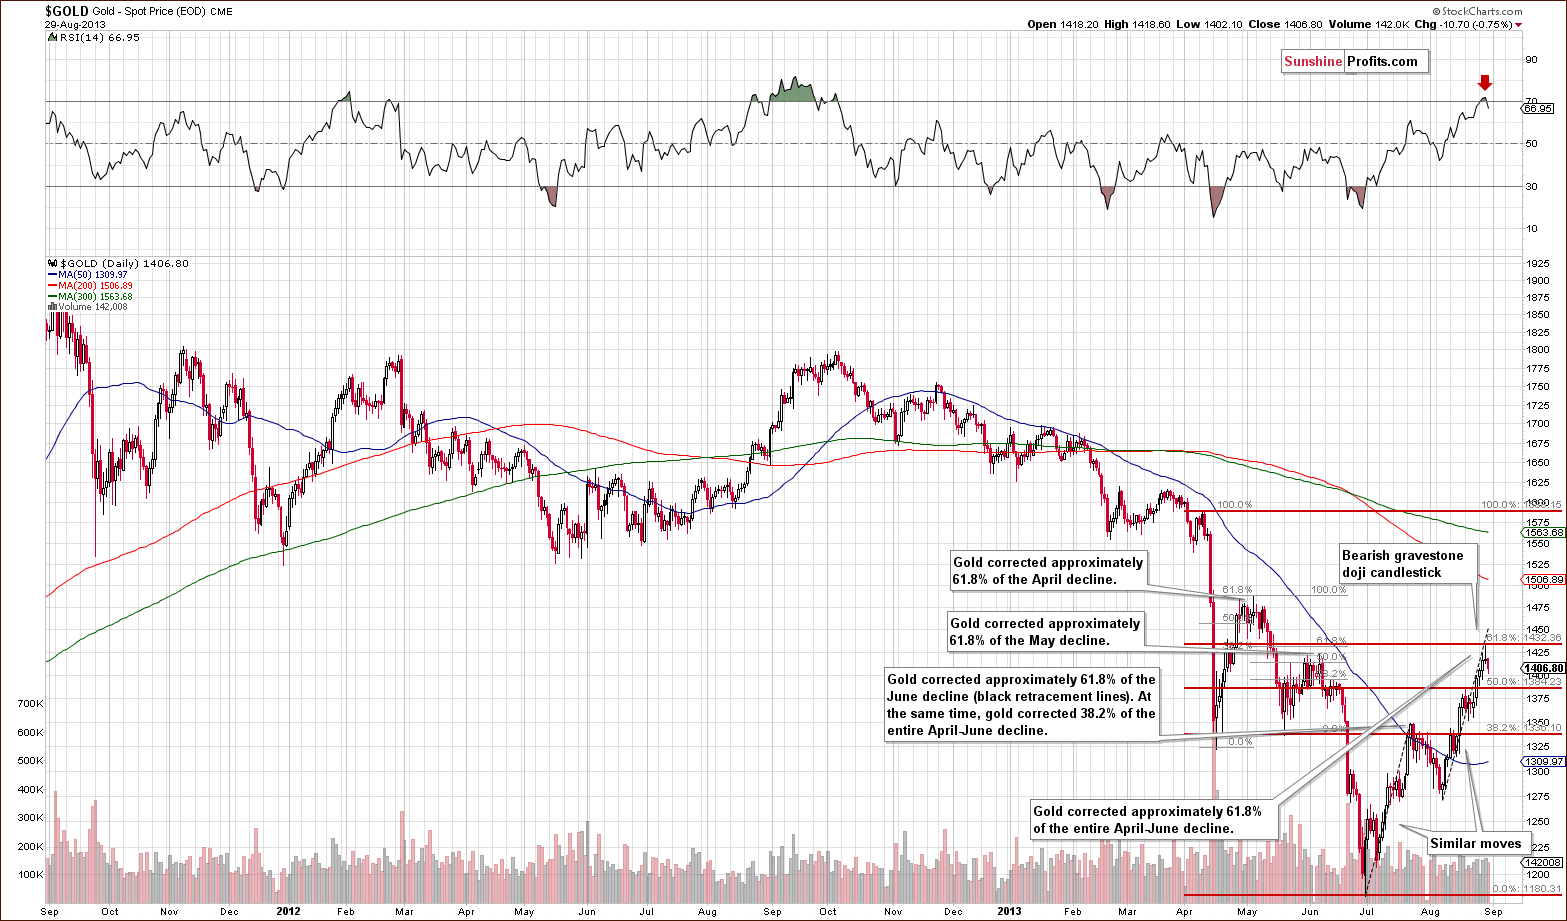
On the above chart, we see that gold continued its rally in recent days and reached the 61.8% Fibonacci retracement level based on the entire April-June decline. Although the price of gold managed to break above its June top, this breakout was quickly invalidated.
Additionally, when we factor in the Fibonacci price projections, we see that the recent rally from the August 7 low to the August top is similar to the upward move seen in July. If history repeats itself, we will see a downward move – similar to the July-August decline.
From this point of view, it seems that the strong resistance range based on the June top and the 61.8% Fibonacci retracement level may keep the rally in check as it further strengthens the resistance created by the rising long-term line marked in red on the previous (long-term) chart.
With a bullish outlook in place for the USD Index, it doesn’t seem likely that gold will have enough strength to move above the previously mentioned resistance levels.
Now let’s take a look at the chart featuring gold’s price from the non-USD perspective.
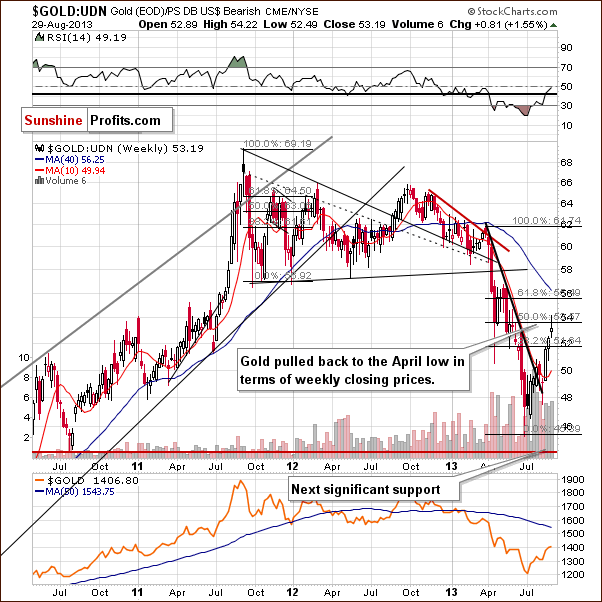
On the above chart, we clearly see that gold continued its rally in the past week and reached the level of the April bottom (in terms of weekly closing prices).
It’s worth mentioning that this resistance level also intersects with the 50% Fibonacci retracement level, which gives us a strong resistance zone. Although we saw a small move above it, the breakout was not confirmed, and from this point of view, the downtrend remains in place.
Earlier this month we saw a breakout above the declining resistance line, and a rally followed. However, at this time, it seems that what was supposed to happen based on the breakout has already happened, so it no longer appears to have bullish implications going forward.
From this perspective, the situation is mixed at the moment with a bearish bias.
Let’s examine gold from another perspective – gold priced in British pounds.
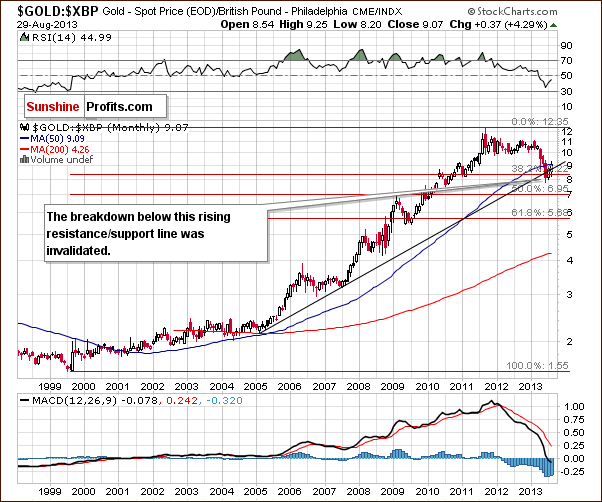
Looking at gold’s price from the British pound perspective, we see that it moved above the rising resistance line once again. Technically, the breakdown below this line and the 38.2% Fibonacci retracement level was invalidated. Please note that the breakout above the 50-month moving average has not yet been invalidated.
Taking the above-mentioned into account, the outlook has turned to bullish, and if we get a monthly close above this line, the outlook will become even more bullish.
Let’s now take a look at gold priced in euros.
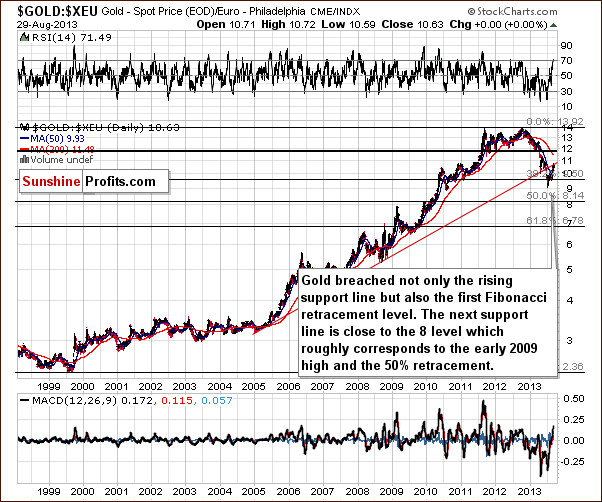
On the above chart, we see that the situation hasn’t changed much. Although gold priced in euros moved above the rising support/resistance line (marked with red) temporarily, the breakout was invalidated. Therefore, the implications here are still bearish.
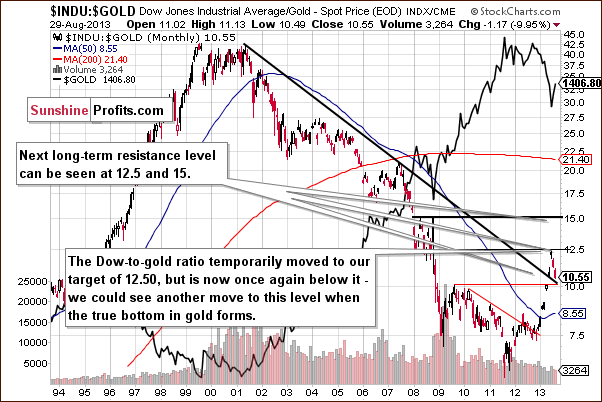
On the above monthly chart we see that the ratio moved temporarily to our target of 12.50 in June, but this situation didn’t last long. In the following months, the ratio has declined and moved very close to its previously-broken long-term declining support/resistance line.
Please note that the above-mentioned declining support/resistance line approximately intersects with the August 2009 top at the current levels. Therefore, this strong support could trigger a pullback to 12.5 or even a rally to the 15 level.
From this point of view, it seems that if we see the ratio move to the 12.5 – 15 range, the true bottom in gold will then have formed or be close at hand.
Summing up, despite the recent show of strength, the medium-term outlook for gold remains bearish. One bullish chart – the one featuring gold priced in the British pound – is not enough to invalidate the bearish implications from all the other ones.
Silver
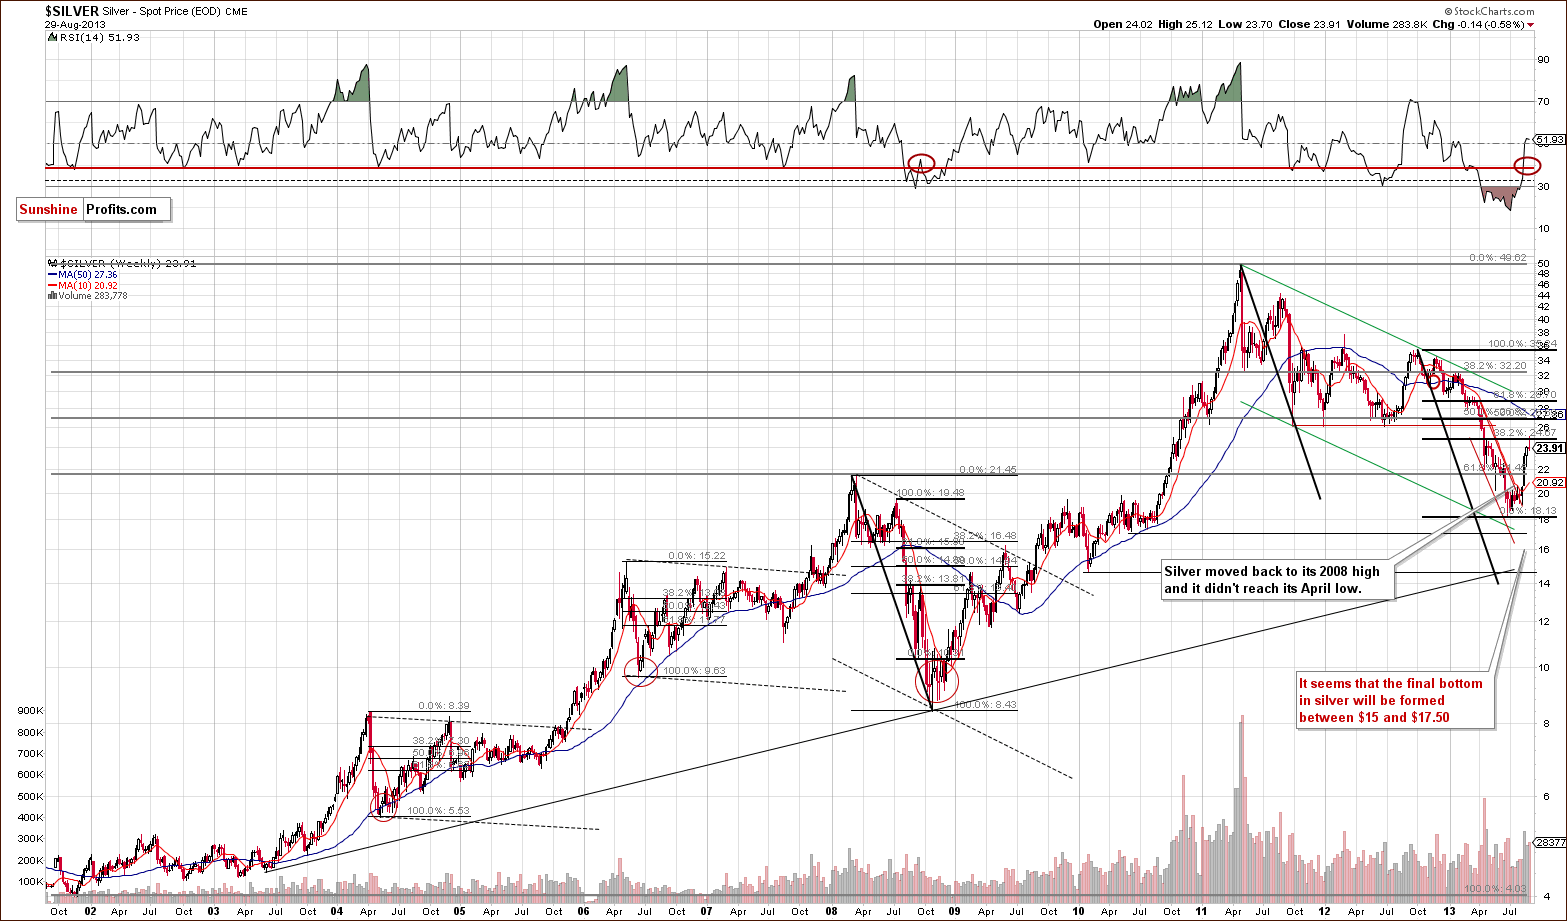
In our previous Premium Update we wrote:
(...) silver might climb higher as the analogy to the 2008 decline suggests a 38.2% pullback, but this scenario doesn’t have to be realized.
When we take a look at the above chart, we clearly see that history has repeated itself once again, and silver reached the 32.8% Fibonacci retracement level. Taking this into account, it seems that this could be the resistance level that keeps the rally in check.
Additionally, please note that back in 2008, silver corrected to the local high that was created after the first sharp decline. We can say the same about the most recent decline and the subsequent pullback. In this case, silver moved to the local top which followed the April plunge.
It’s visible more clearly on the short-term chart, so let’s move to it right now.
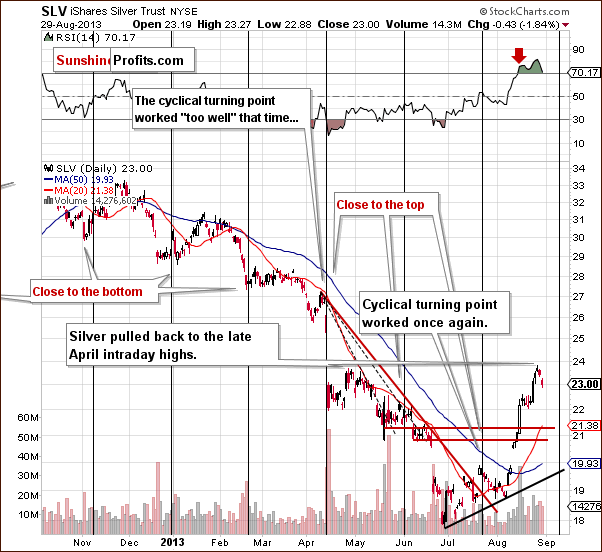
At the beginning of this week, we clearly saw significant strength in the short-term SLV ETF chart. The recent increases have brought silver’s price to the late April intraday highs. As you see on the above chart, this resistance level might have encouraged silver bears to go short. A small breakout above the April 26 top was quickly invalidated in recent days, which is a bearish signal.
A week ago, the RSI indicator was strongly overbought. Early this week, however, it dropped below the 70 level and generated a sell signal. This means (according to the classical definition) that the local top is already in. Therefore, we can expect that silver will decline in the coming weeks.
Before summarizing, let’s take a look at the long-term turning points in silver.
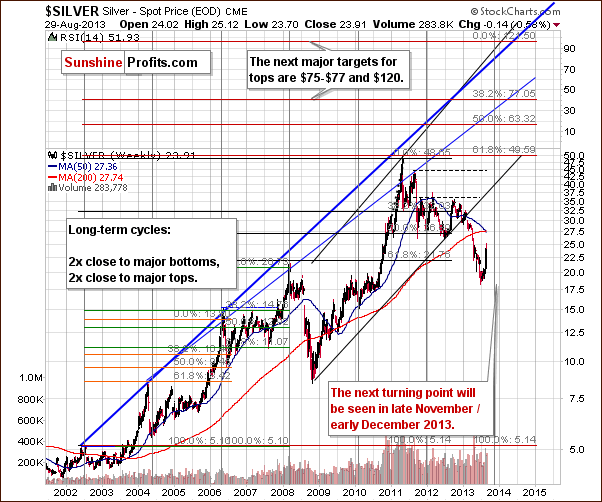
Quoting from our last Premium Update:
There were two major bottoms and two major tops in the case of this major, long-term cycle. As you see on the above chart, the next cyclical turning point will be seen in late November or early December this year. This may be where the next major bottom in silver materializes.
Of course this could be a local top and we could see further rally from where we are today, but taking into account other charts (and the negative correlation of silver with the stock market), it seems that the trend is still down, and we will likely see a final bottom close to these dates.
Since the entire precious metal sector tends to move together during major price swings, the above has bearish implications for gold and mining stocks in the medium term.
Gold and Silver Mining Stocks
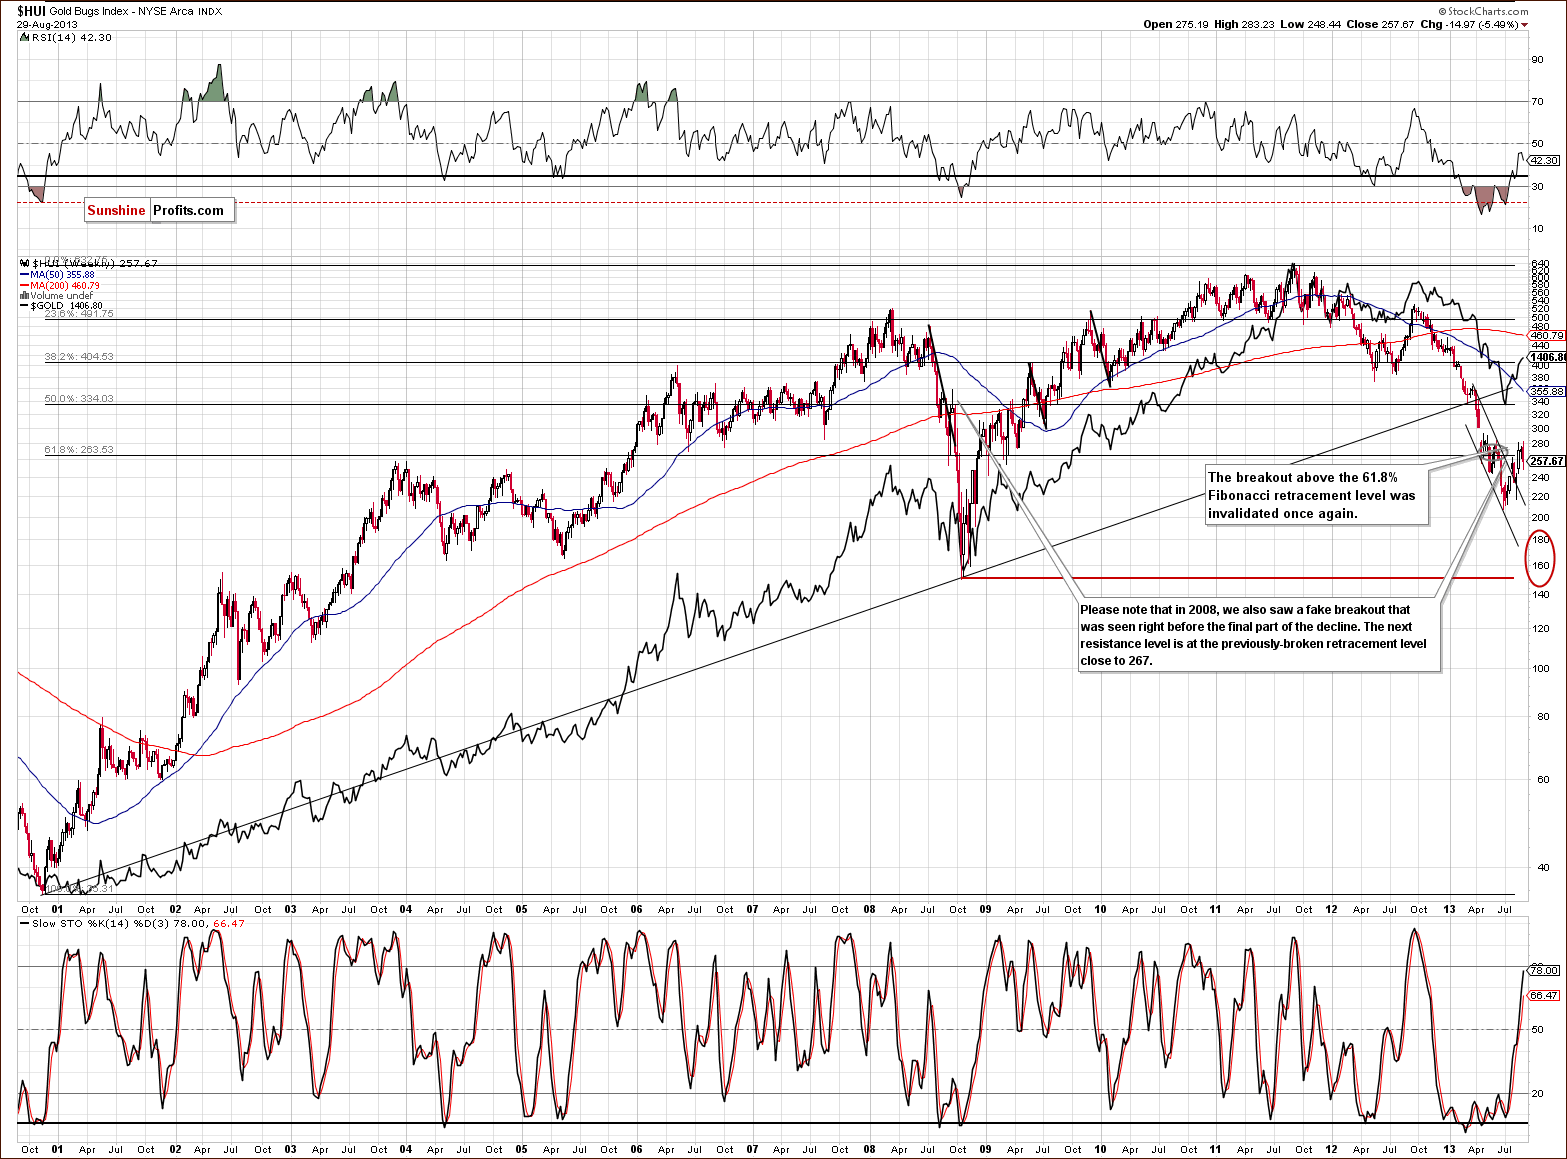
In this week’s very long-term HUI index chart (a proxy for the gold stocks), the situation hasn’t changed much. As you know from last week‘s Premium Update, in the past weeks and months, we saw several unsuccessful attempts to move above the 61.8% Fibonacci retracement level based on the entire bull market.
On Wednesday, we had another small move above this level, but just like the previous attempts, this one also failed. The mining stocks returned to below the 61.8% retracement level (at approximately 267), and the breakout above this resistance level was invalidated once again.
The implications are therefore bearish once again, and the trend remains down, even though we saw a breakout above the declining trend channel earlier this month.
Now that we know the situation in the HUI index, let’s move to the XAU Index, which is another proxy for the precious metals mining stocks.
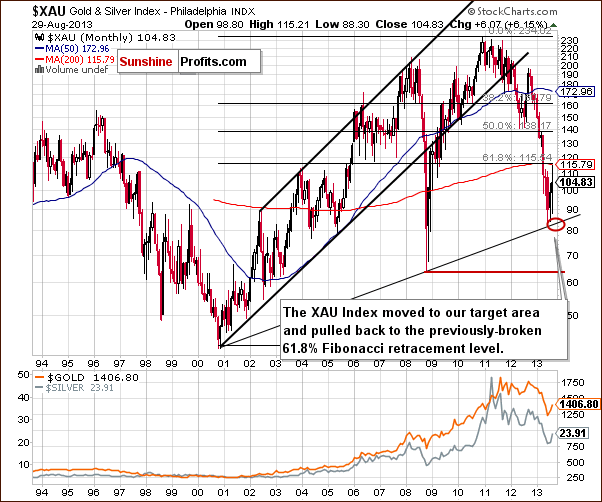
On the above XAU Index chart, we see that our previous target area (marked with a red ellipse) was reached in June. The strong rising support line based on the 2000 and the 2008 bottoms seems to have encouraged buyers to act, and we can see that the mining stocks pulled back to the previously-broken 61.8% Fibonacci retracement level in the months since – without a move above it.
As you see on the above chart, this resistance level slowed further growth and mining stocks declined in recent days. From this perspective, it seems that the next move lower will take the XAU Index to the bottom of the previous corrective move. However, if it is broken, the next downside target for the sellers will be around the 2008 low or even below it.
Now, let’s move on to the gold stocks to gold ratio.
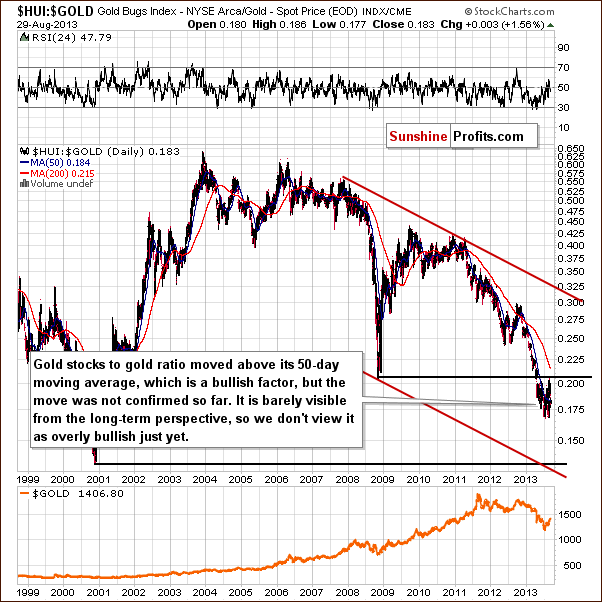
On the above chart, we see that last week there was a verification of the breakdown below the 2008 low. Although, the ratio reached its 2008 low, it slipped below it once again in the following days. Earlier this week, we saw a significant decline which took the ratio to the 0.180 level. With this move, the gold stocks:gold ratio dropped below the 50-day moving average, which now serves as resistance.
From this point of view, the trend remains down, and the recent rally was nothing more than a verification of a major breakdown. The above picture remains bearish.
Summing up, the outlook for the mining stocks remains bearish, and the trend is still down despite last week’s strength. The long-term tendencies seem most important at this time, even for short-term price moves. The breakdown below the April low was invalidated and the move above the 61.8% Fibonacci retracement failed once again. The long-term trend in the gold stocks to gold ratio remains down, and a major breakdown seems to have just been verified.
Letters from Subscribers
Q: I keep hearing you to short gold how do you short gold? I have not gone short before.
A: The easiest way to short gold, which means betting on lower gold values, is to buy an inverse ETF / ETN which will appreciate when gold declines. We have a huge ranking of such funds available on our website so that you can pick the one that suits you. You will also find analogous funds for silver and mining stocks. Also, we have replied to a similar question recently, so you might find this reply useful as well
Q: Curious, why not consider a fib retracement off end of june bottom for spec long play in pm/miners with stops instead of trying to short on continued rallies off bottom? Just trying to understand future tradingas lot of traders made that trade, now out of it for pullback, thanks.
A: It's just a matter of preference. We are currently focused on the next big move in the precious metals market, which we believe will be to the downside. At any time, you will find traders doing something and making money and at times you will find those traders losing them. For instance, the short-term approach would have likely led to closing the short positions prematurely during the April and June declines.
We are currently focused on the next medium-term move, which, according to the medium-term trend, should be to the downside.
The situation in the related markets (stocks, USD Index) favors a big drop in the precious metals market, which is why we are striving to take a short position. We are careful when doing so by placing close stop-loss orders. Please note that thanks to them you are not short during the whole rally, only at some points. This means that when the big decline finally does materialize you will likely gain much more than was lost for the trades that were closed due to stop-loss orders being reached.
Naturally, everyone would wish to be invested 100% of time and be correct 100% of time, but if one makes this their benchmark, then they will never be satisfied. In fact they will get frustrated after the first unlucky trade (which is also why we suggest limiting the size of the speculative positions - not only are huge speculative positions unprofitable over the long run - see the corresponding research here - but they are unhealthy too). The point is not to aim at winning all the trades, the point is to position yourself so that over time you will gain more than you lose - at the end of the day that's what will make you money.
Q: Verygood call.Do u consider any impact of the India / China buying in ur analysis. R u just using charts. I read Harvey Organ on a regular basis he argues that physical is not being delivered, shortage, - bah bah.
A: We consider the impact as far as the long- and, sometimes, medium-term outlook is concerned. Fundamentals don't have to influence the short-term price swings, so we use charts and our in-house developed investment tools to detect optimal times to enter a trade (from the risk/reward perspective).
You can read more about Gold in India in our recent article on this topic:
Q: I started my subscription after gold left its recent low and am entirely in cash. I am waiting to seewhether gold will fall again before rising. Do you think I should go partially into precious metals at this time?
A: We don't know if you should get in the market, because we don't know your financial situation, your risk tolerance, liquidity preferences, financial goals etc. (and we can't provide investment advice based on such anyway, because of the way the financial system is currently regulated). However, we can provide general suggestions that stem from our views on the market - and we think that it's best to have half of one's long-term investments already back in the precious metals market (which means buying if one doesn't have any). You will find more information as to what we define as long-term investment capital and speculative capital in our gold portfolio report.
Summary
The situation hasn't changed much since last week as far as the USD Index and the general stock market are concerned, so the outlook remains the same.
The USD Index remains at the medium-term support line, and it invalidated a small breakdown this week, which is a bullish sign. The situation in the general stock market is bullish as well, with the RSI indicator based on the DIA ETF moving below the 30 level.
The above create a bearish outlook for the precious metals sector.
Both gold and silver reached their important resistance levels and, in the case of silver, the action was very similar to what we saw in 2008. This means that if history is to repeat itself, we might very well see a sharp plunge in the coming weeks.
The underperformance of the miners relative to gold – as seen in the HUI-to-gold chart – seems to confirm the bearish outlook for the entire precious metals sector.
For now, we think it’s safest to bet on lower mining stocks’ values.
Trading – PR: Short position (half) in gold and mining stocks (full).
Trading – SP Indicators: No positions: SP Indicators suggest long positions, but the new self-similarity-based tool suggests short ones for the precious metals sector, and we think that overall they cancel each other out.
Long-term investments: Half position in gold, silver, platinum and mining stocks. As far as long-term mining stock selection is concerned, we suggest using our tools before making purchases: the Golden StockPicker and the Silver StockPicker
| Portfolio's Part | Position | Stop-loss / Expiry Date |
|---|---|---|
| Trading: Mining stocks | Short | 289 (HUI), $32.6 (GDX) / - |
| Trading: Gold | Short - half | $1,439 / - |
| Trading: Silver | No positions | - |
| Long-term investments: Gold | Long - half | - |
| Long-term investments: Silver | Long - half | - |
| Long-term investments: Platinum | Long - half | - |
| Long-term investments: Mining Stocks | Long - half | - |
This completes this week's Premium Update. Your editor starts his vacation next week, so our next Premium Update is scheduled for Wednesday, September 4, 2013. This upcoming Premium Update will brief you on what’s been going in the market, and it will present preferred ways of reacting to the possible scenarios for the days to follow. A Market Alert / Message will be sent and published no later than Monday, September 16th to update you once again on the current market conditions. I (PR) will strive to obtain Internet access and check what's happening on a daily basis, but I can't guarantee that I will be able to send out a Market Alert between Thursday and Sep 16 (Monday). However, since I will provide you with a list of preferred responses to various situations that might take place during that time, you will know how to react to whatever happens. Meanwhile, the rest of the SP Team will be working normally (actually, more than normally as we are finalizing preparations for the launch of new tools and also fleshing out a very important report on portfolio rebalancing).
Thank you.
Sincerely,
Przemyslaw Radomski, CFA


