

-
S&P 500: Volatility Following Last Week’s Sell-Off, Should We Buy the Dip Again?
February 14, 2022, 9:07 AMAvailable to premium subscribers only. -
Stocks Move Sideways, It May Be Bullish
February 11, 2022, 9:01 AMStocks retraced their Wednesday’s advance yesterday. Was this a downward reversal, or just a correction within an uptrend?
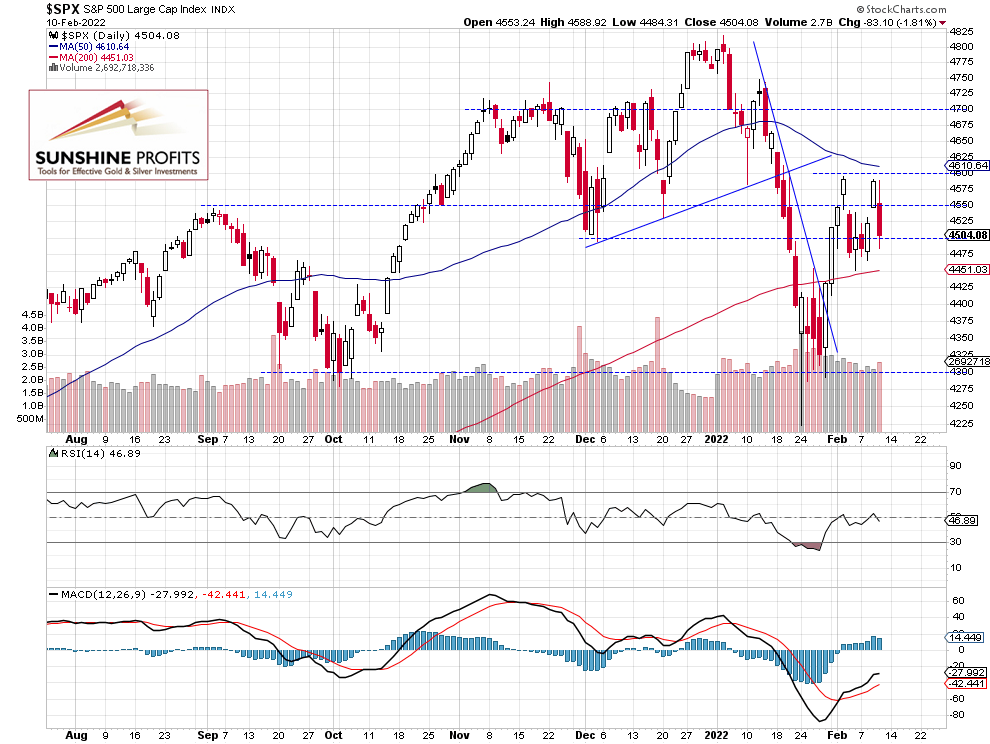
The S&P 500 index lost 1.81% on Thursday, Feb. 10 after gaining 1.5% on Wednesday, as investors reacted to higher-than-expected inflation number release. Investors fear that the rising inflation will lead to a faster tightening by the Fed. On Wednesday the index got close to its previous Wednesday’s local high of 4,595.31, and yesterday it fell to the 4,500 level (the daily low was at 4,484.31). This morning the market will likely open 0.2% higher after an overnight decline. We may see some more short-term uncertainty. For now, it looks like a flat correction or a consolidation within an uptrend from the Jan. 24 local low of 4,222.62.
The nearest important resistance level remains at 4,550-4,600. On the other hand, the support level is at 4,450-4,500. The S&P 500 index is close to the previous Friday’s daily closing price, as we can see on the daily chart (chart by courtesy of http://stockcharts.com):

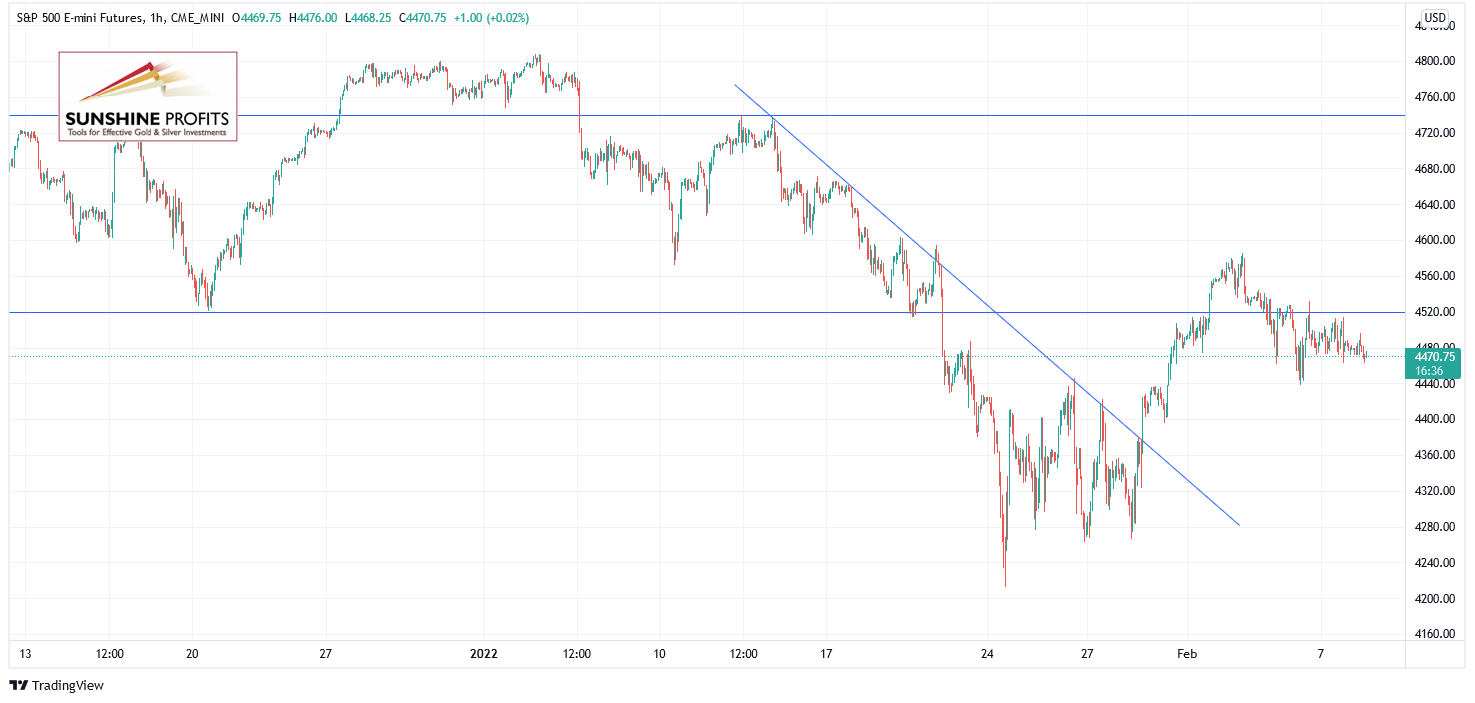
Futures Contract Trades Along the 4,500 Level
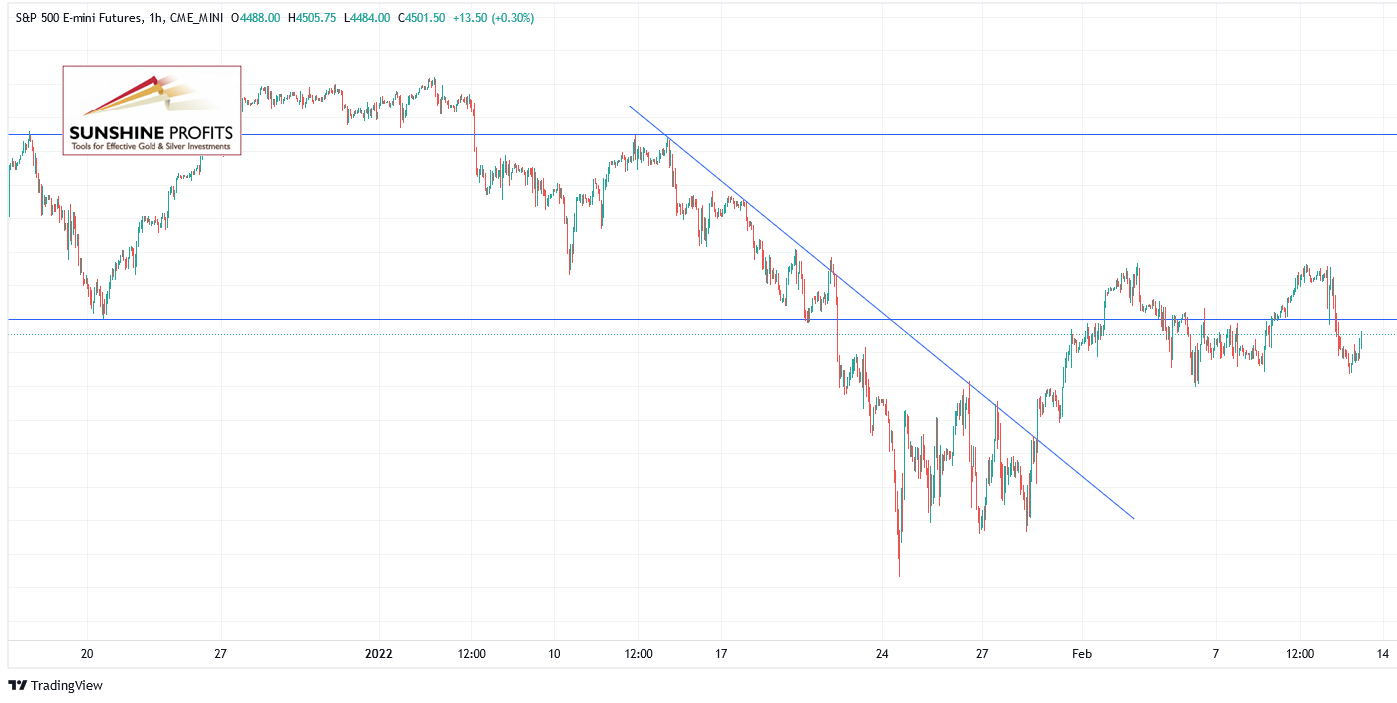
Let’s take a look at the hourly chart of the S&P 500 futures contract. It broke above the short-term downward trend line in late January before rallying up to around the 4,600 level. Since then, it has been fluctuating along the 4,500 level.
The market remains at the resistance level of its previous local lows, but there have been no confirmed negative signals so far. So in our opinion, no positions are currently justified from the risk/reward point of view. (chart by courtesy of http://tradingview.com):

Conclusion
The S&P 500 index will likely extend its almost two-week long consolidation after rallying from the mentioned late January local low. So far, it looks like a consolidation within an uptrend.
The quarterly earnings season is mostly over now, and there is still an uncertainty concerning Russia-Ukraine tensions.
Here’s the breakdown:
- The S&P 500 index will likely open slightly higher this morning and we may see more fluctuations along the 4,500 level.
- In our opinion, no positions are currently justified from the risk/reward point of view.
Today's premium Stock Trading Alert includes details of our trading position. Interested in more exclusive updates? Join our premium Stock Trading Alerts newsletter and read all the details today.
Thank you.
Paul Rejczak,
Stock Trading Strategist
Sunshine Profits: Effective Investments through Diligence and Care -
Stocks: Negative Expectations Following Inflation Number Release
February 10, 2022, 8:59 AMAvailable to premium subscribers only.
-
Will Stocks Break Above Their Last Week’s High?
February 9, 2022, 9:15 AMAvailable to premium subscribers only.
-
Stocks’ Hangover Following Earnings, Data Releases
February 8, 2022, 9:07 AMThe S&P 500 index remains close to the 4,500 level following last week’s retreat. Was this just a downward correction?
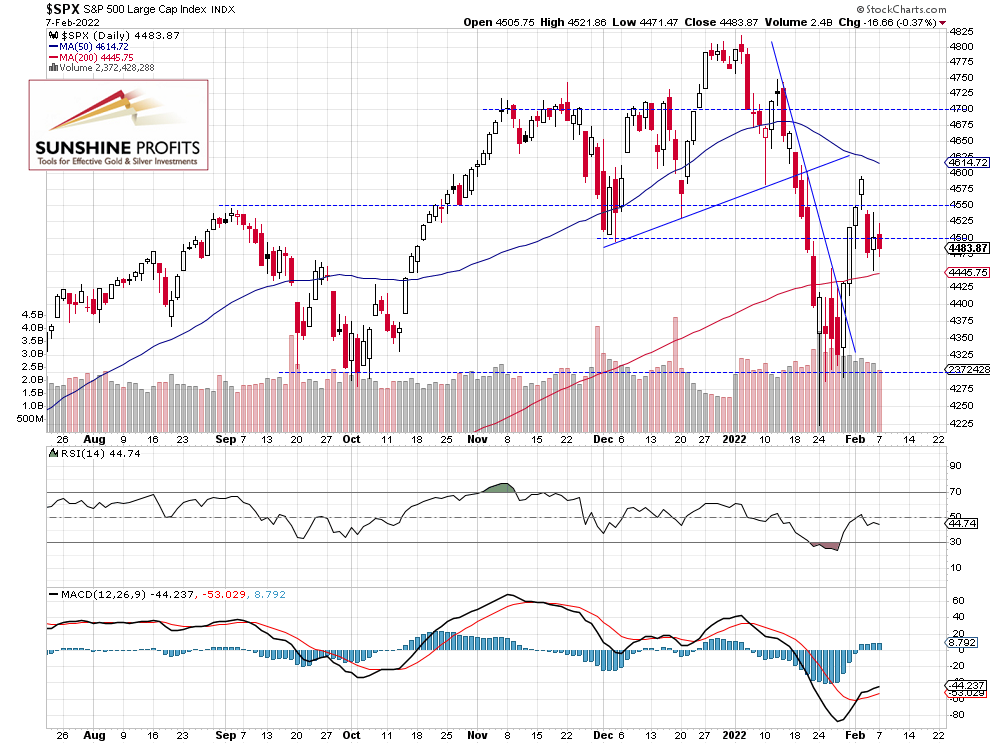
The broad stock market index lost 0.37% on Monday, as it continued to fluctuate within a short-term consolidation. The broad stock market’s gauge retraced some of its recent rally, as it fell to the local low of 4,451.50 on Friday. The market found a short-term bottom after reversing from last Wednesday’s local high of 4,595.31. This morning the S&P 500 index is expected to open 0.2% lower. We will likely see more consolidation along the 4,500 level.
The nearest important resistance level remains at 4,540, market by the recent local highs. The resistance level is also at 4,600. On the other hand, the support level is at 4,400-4,450. The S&P 500 continues to trade below the November-January consolidation, as we can see on the daily chart (chart by courtesy of http://stockcharts.com):

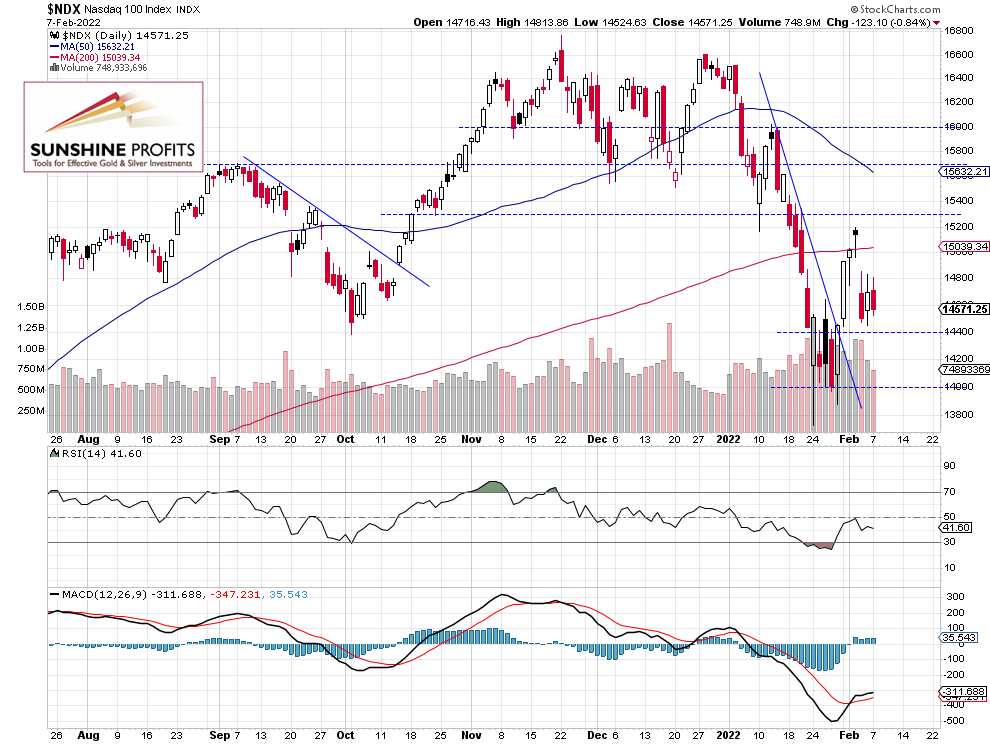
Nasdaq 100 Remains Relatively Weaker
The technology Nasdaq 100 index followed a similar path last week, as it retraced some of the rally. It remains relatively weaker than the broad stock market. The support level is at 13,800-14,000, and the resistance level is at 15,000-15,200.

Futures Contract – Short-Term Consolidation
Let’s take a look at the hourly chart of the S&P 500 futures contract. It broke above the short-term downward trend line a week ago before rallying up to around the 4,600 level. It’s trading along the 4,500 level after backing from the Wednesday’s high of 4,586.
The market remains close to the resistance level of its previous local lows, but there have been no confirmed negative signals so far. So in our opinion, no positions are currently justified from the risk/reward point of view. (chart by courtesy of http://tradingview.com):
 Conclusion
The S&P 500 index trades within a short-term consolidation following the decline from last week’s Wednesday’s local high. The market will likely extend its consolidation, as investors will be waiting for the Thursday’s Consumer price index release. The quarterly earnings season is mostly over now, and there is still an uncertainty concerning Russia-Ukraine tensions.
Here’s the breakdown:
- The S&P 500 index will likely trade within a consolidation ahead of the important Thursday’s consumer inflation number release.
- In our opinion, no positions are currently justified from the risk/reward point of view.
Today's premium Stock Trading Alert includes details of our trading position. Interested in more exclusive updates? Join our premium Stock Trading Alerts newsletter and read all the details today.
Thank you.
Paul Rejczak,
Stock Trading Strategist
Sunshine Profits: Effective Investments through Diligence and Care
Free Gold &
Stock Market Newsletter
with details not available
to 99% investors
+ 7 days of Gold Alerts
Gold Alerts
More-
Status
New 2024 Lows in Miners, New Highs in The USD Index
January 17, 2024, 12:19 PM -
Status
Soaring USD is SO Unsurprising – And SO Full of Implications
January 16, 2024, 8:40 AM -
Status
Rare Opportunity in Rare Earth Minerals?
January 15, 2024, 2:06 PM

