

Briefly:
Intraday trade: Our Tuesday's intraday outlook was neutral. The S&P 500 index gained 0.3% after opening 0.2% higher. So, our yesterday's intraday outlook has proved quite accurate. Stocks will likely extend their short-term fluctuations ahead of today's FOMC Statement release at 2:00 p.m. We prefer to be out of the market, avoiding low risk/reward ratio trades.
Medium-term trade: In our opinion, no medium-term positions are justified.
Our intraday outlook is neutral. Our short-term outlook is neutral, and our medium-term outlook is neutral:
Intraday outlook (next 24 hours): neutral
Short-term outlook (next 1-2 weeks): neutral
Medium-term outlook (next 1-3 months): neutral
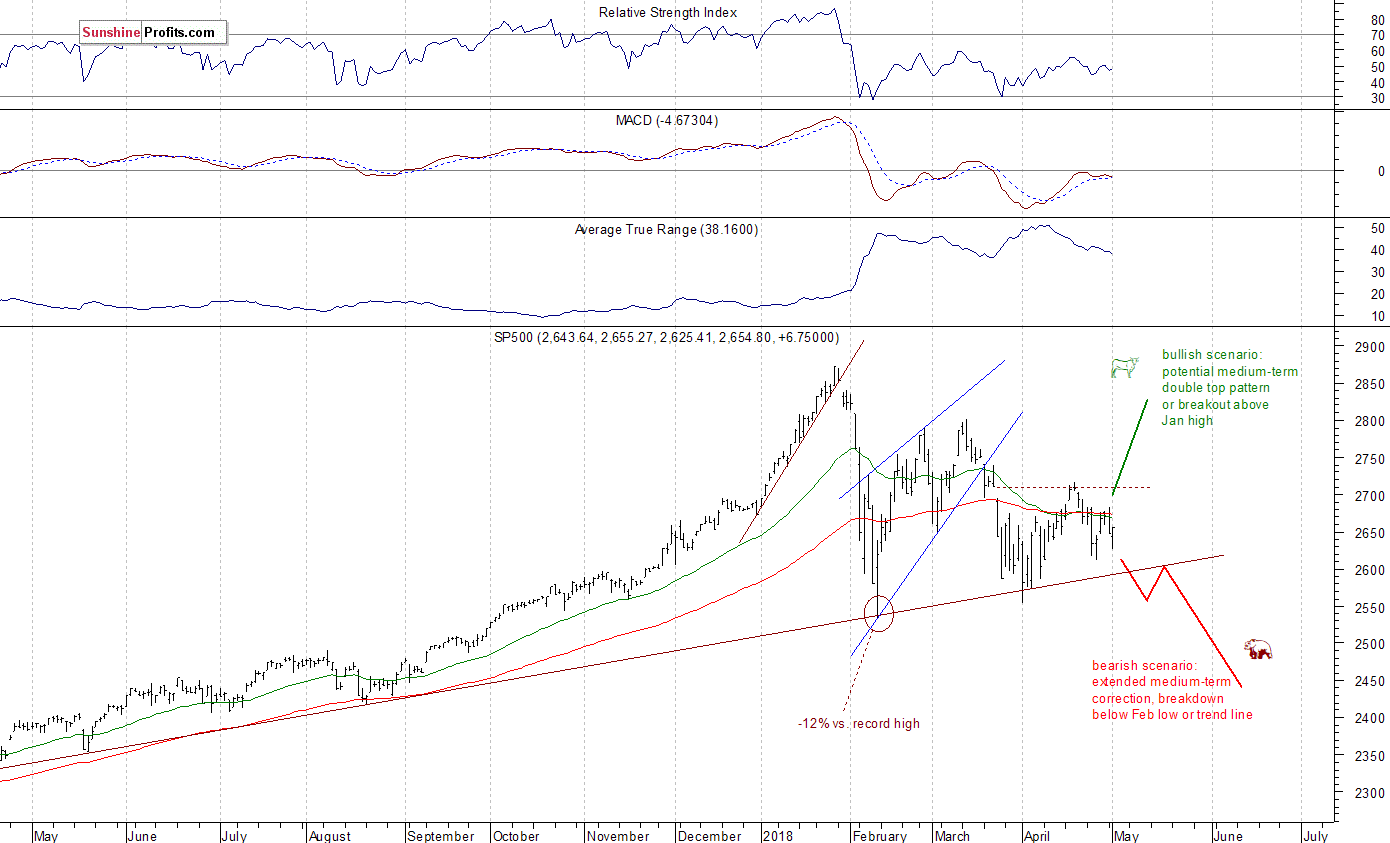
The main U.S. stock market indexes were mixed between -0.3% and +0.9% on Tuesday, as investors hesitated ahead of quarterly earnings, economic data releases. The S&P 500 index reversed its intraday downtrend yesterday, as it was getting closer to its late April local lows. It currently trades 7.6% below January 26 record high of 2,872.87. The Dow Jones Industrial Average lost 0.3% and the technology Nasdaq Composite gained 0.9% on Tuesday, as it was relatively stronger than the broad stock market ahead of Apple earnings release.
The nearest important level of resistance of the S&P 500 index remains at 2,680-2,685, marked by previous local highs. The next resistance level is at 2,695-2,710, marked by March 22 daily gap down of 2,695.68-2,709.79. The resistance level is also at 2,740. On the other hand, support level is at around 2,745-2,750, marked by Thursday's daily gap up of 2,645.30-2,647.16. The level of support is also at 2,610-2,615, marked by previous local lows.
The broad stock market continues to trade above its medium-term upward trend line. Stocks extend their three-month-long consolidation following early February sell-off. Is this a bottoming pattern before another leg higher within the long-term bull market? Or just pause before another wave of selling? So, there are still two possible future scenarios - bearish that will lead us below February low following trend line breakdown, and the bullish one in a form of medium-term double top pattern or breakout towards 3,000 mark:
Slightly Positive Expectations, FOMC Release Ahead
Expectations before the opening of today's trading session are slightly positive, because the index futures contracts trade between +0.1% and +0.3% vs. their yesterday's closing prices. The European stock market indexes have gained 0.1-1.0% so far. Investors will wait for some economic data announcements: ADP Non-Farm Employment Change number at 8:15 a.m., Crude Oil Inventories at 10:30 a.m., the FOMC Statement at 2:00 p.m. Investors will also wait for more quarterly corporate earnings releases. The S&P 500 index will probably extend its short-term fluctuations today. The market continues to trade below the resistance level of around 2,700. If it breaks below the medium-term upward trend line, it could continue towards February 9 low of 2,532.69.
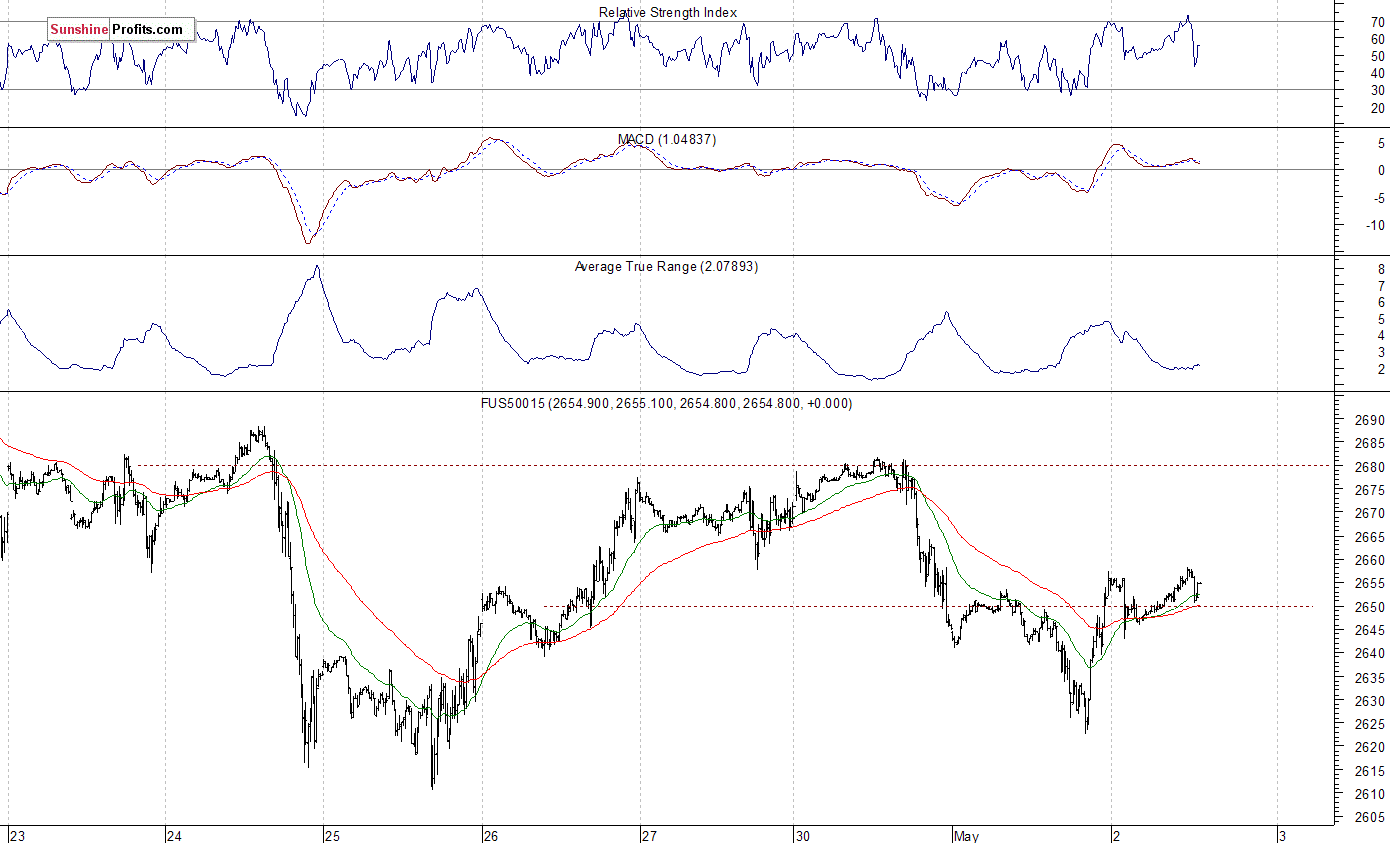
The S&P 500 futures contract trades within an intraday consolidation, as it fluctuates after yesterday's rebound off support level. The nearest important level of support is at around 2,640-2,645, marked by short-term local lows. The next level of support is at 2,600-2,620. On the other hand, resistance level is at 2,660, among others. The futures contract extends its short-term consolidation along the level of 2,650 this morning, as we can see on the 15-minute chart:
Nasdaq Back at 6,700 Mark
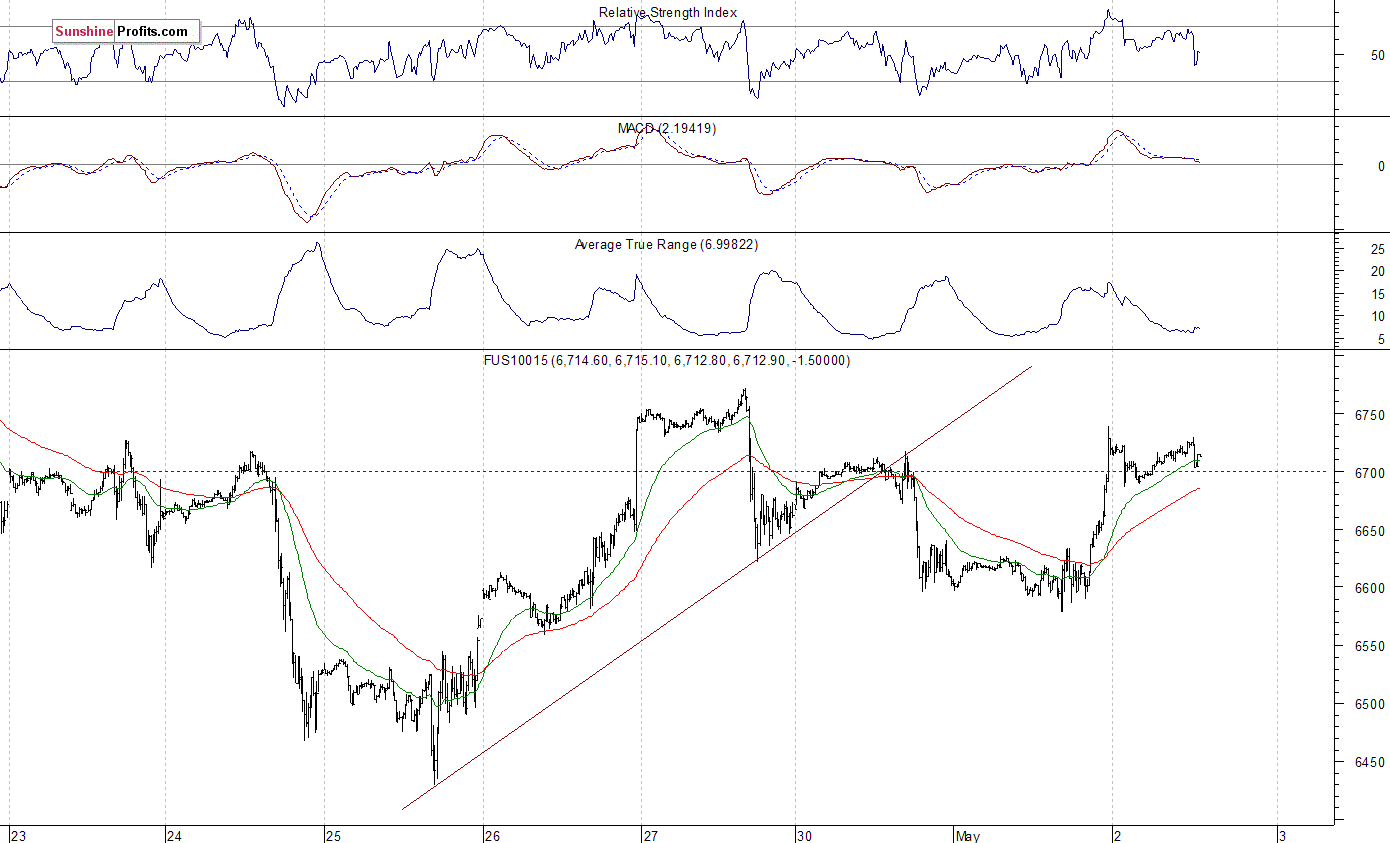
The technology Nasdaq 100 futures contract follows a similar path, as it trades within an intraday consolidation after yesterday's move up. It broke above the level of 6,700, as investors reacted to yesterday's after-hours' quarterly earnings release from Apple. The nearest important level of resistance is at around 6,730-6,750, marked by local highs. On the other hand, support level is now at 6,680, and the next level of support is at 6,630-6,650, marked by recent fluctuations. The Nasdaq futures contract trades closer to recent local highs, as the 15-minute chart shows:
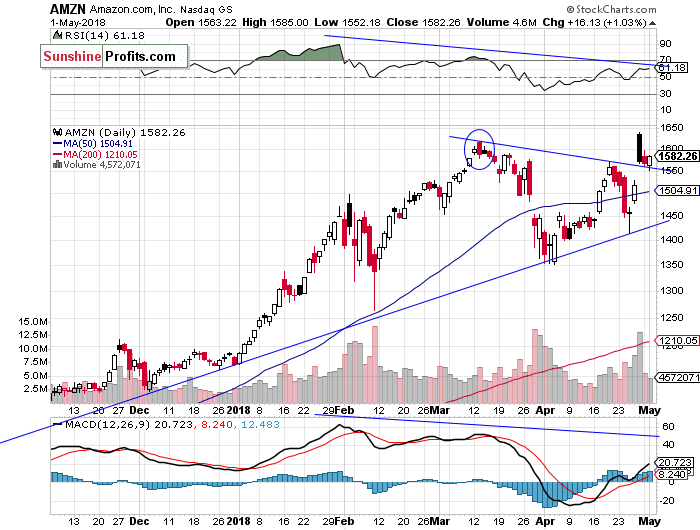
Apple Rallies After Earnings Release, Amazon at Juncture
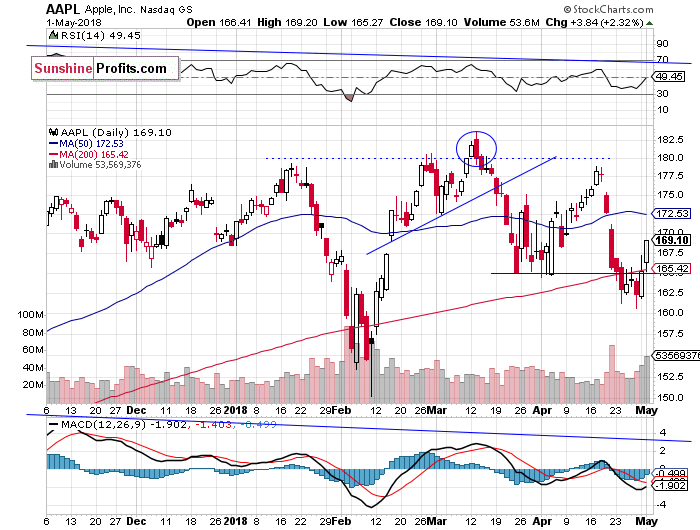
Let's take a look at Apple, Inc. stock (AAPL) daily chart (chart courtesy of http://stockcharts.com). It was gaining ahead of yesterday's quarterly earnings releases. The stock is expected to open higher today, gaping above the level of $170. Is this an upward reversal or just correction following April move down? Yesterday we wrote, that "we will likely see a more clear reaction. Probably to the upside, as there seems to be some "sell the rumor, buy the fact" action going on". And we were right! Potential level of resistance is now at around $175-180:
Now let's take a look at Amazon.com, Inc. stock (AMZN) daily chart. The price reached new record high on Friday morning, as investors reacted to better-than-expected quarterly earnings release. Then it sold off below $1,600. Is this a downward reversal or just correction following breakout higher? If the price breaks below support level of around $1,550, we could see more selling pressure. It still looks like a downward correction:
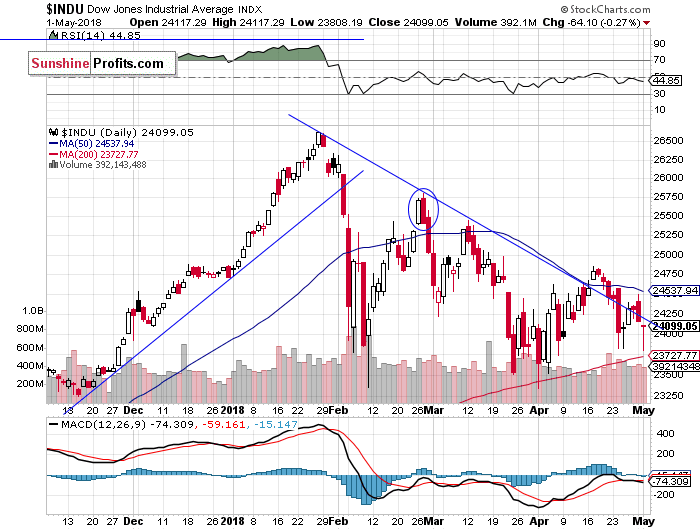
Dow Jones Continues Sideways
The Dow Jones Industrial Average broke below its medium-term downward trend line again, as it fell towards its recent local low. Then the blue-chip index bounced again. It continues to trade below resistance level of around 24,800-25,000. Will it resume its uptrend after a downward correction? The support level remains at around 23,800-24,000. The blue-chip index extends its medium-term fluctuations:
The broad stock market extends its medium-term consolidation following the early February sell-off. Just like we wrote in our several Stocks Trading Alerts, the early February sell-off set the negative tone for weeks or months to come. Stocks rallied on better-than-expected big cap tech companies' earnings releases recently, but will medium-term sentiment improve? It's hard to say. For now, it looks like a flat correction within a medium-term downtrend.
Concluding, the S&P 500 index will probably open slightly higher after yesterday's quarterly earnings release from Apple. There will be some important economic data announcements, including the FOMC Statement release, so we may see an increased intraday volatility. Overall, investors' sentiment seems to be quite neutral at this moment.
Currently, we prefer to be out of the market, avoiding low risk/reward ratio medium-term trades. We will let you know when we think it is safe to get back in the market.
To summarize: no medium-term positions are justified from the risk/reward perspective at this moment.
Intraday trade:
No intraday position is justified from the risk/reward perspective today.
No medium-term position is justified from the risk/reward perspective at this moment.
Thank you.
Paul Rejczak
Stock Trading Strategist
Stock Trading Alerts

