

Briefly:
Intraday trade: The S&P 500 index lost 2.4% after opening 1.4% lower. The broad stock market will likely open higher today. For now, it looks like an upward correction following yesterday's sell-off.
Trading position (short-term; our opinion): no positions are justified from the risk/reward perspective.
Our short-term outlook is neutral, and our medium-term outlook is neutral:
Short-term outlook (next 1-2 weeks): neutral
Medium-term outlook (next 1-3 months): neutral
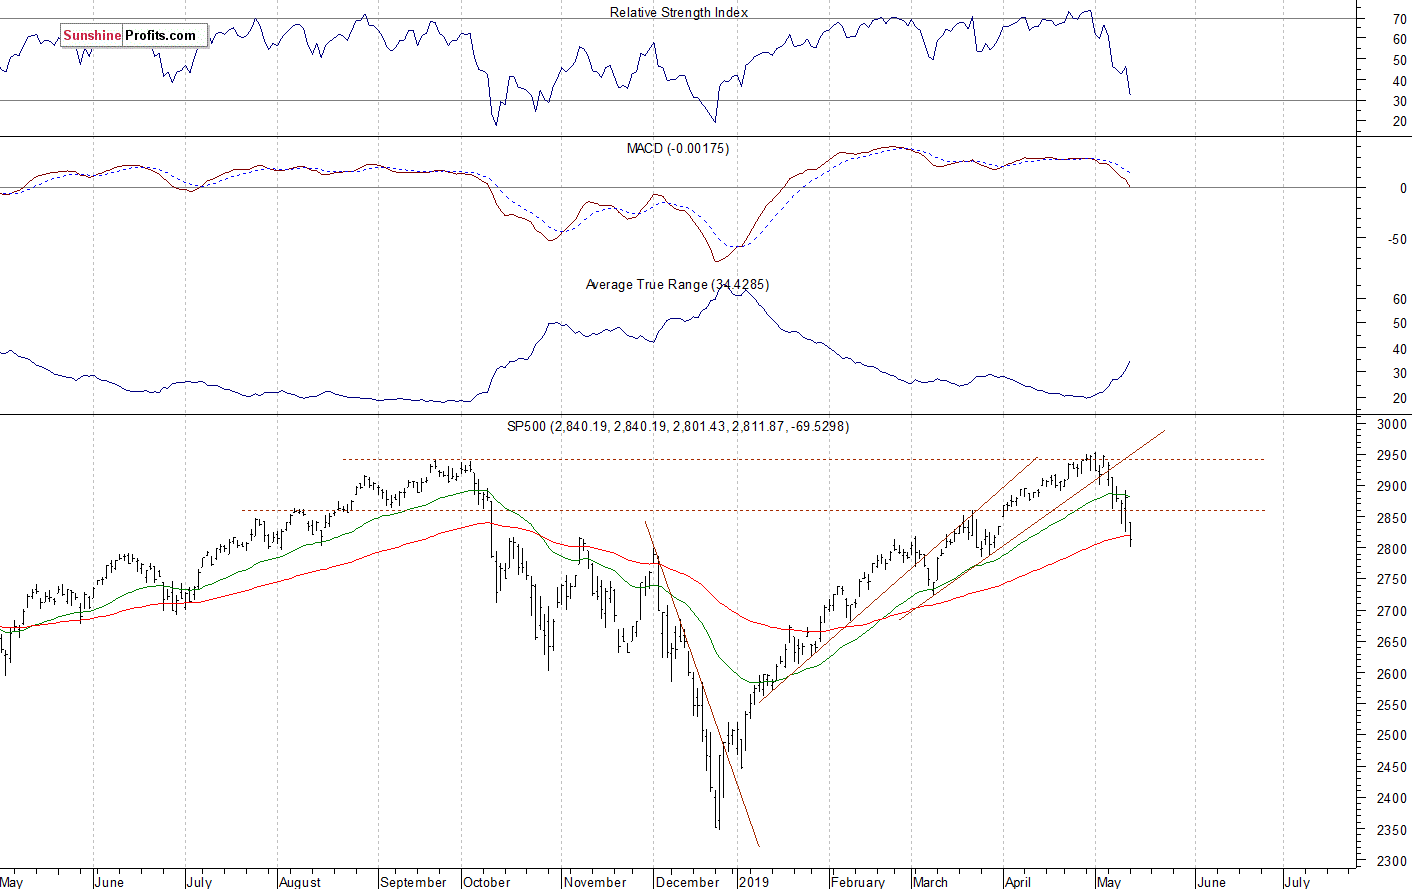
The U.S. stock market indexes lost 2.4-3.4% on Monday, accelerating their short-term downtrend, as investors reacted to the new trade war developments. The S&P 500 index fell the lowest since late March, and it got very close to the 2,800 mark (daily low at 2,801.43). It currently trades 4.8% below its May the 1st record high of 2,954.13. The Dow Jones Industrial Average lost 2.4% and the Nasdaq Composite lost 3.4% on Monday.
The nearest important resistance level of the S&P 500 index is now at 2,825-2,840, marked by Friday's daily low and yesterday's daily high. The resistance level is also at 2,850-2,860. On the other hand, the support level is at 2,800-2,810. The support level is also at around 2,785, marked by some previous local lows.
The broad stock market retraced all of its December sell-off and it broke above the last year's high recently. But then the index broke below the short-term consolidation and it retraced all of the April's advance. The market also broke below its two-month-long upward trend line, as we can see on the daily chart:
Upward Reversal or Just Bounce?
Expectations before the opening of today's trading session are positive, because the index futures contracts trade 0.6-1.0% above their Monday's closing prices. The European stock market indexes have gained 0.5-1.0% so far. There will be no new important economic data releases today.
The broad stock market will likely retrace some of its yesterday's decline. The index bounced off a 2,800 support level yesterday. But will the downtrend reverse here? For now, it looks like another upward correction. However, we can see some short-term technical oversold conditions.
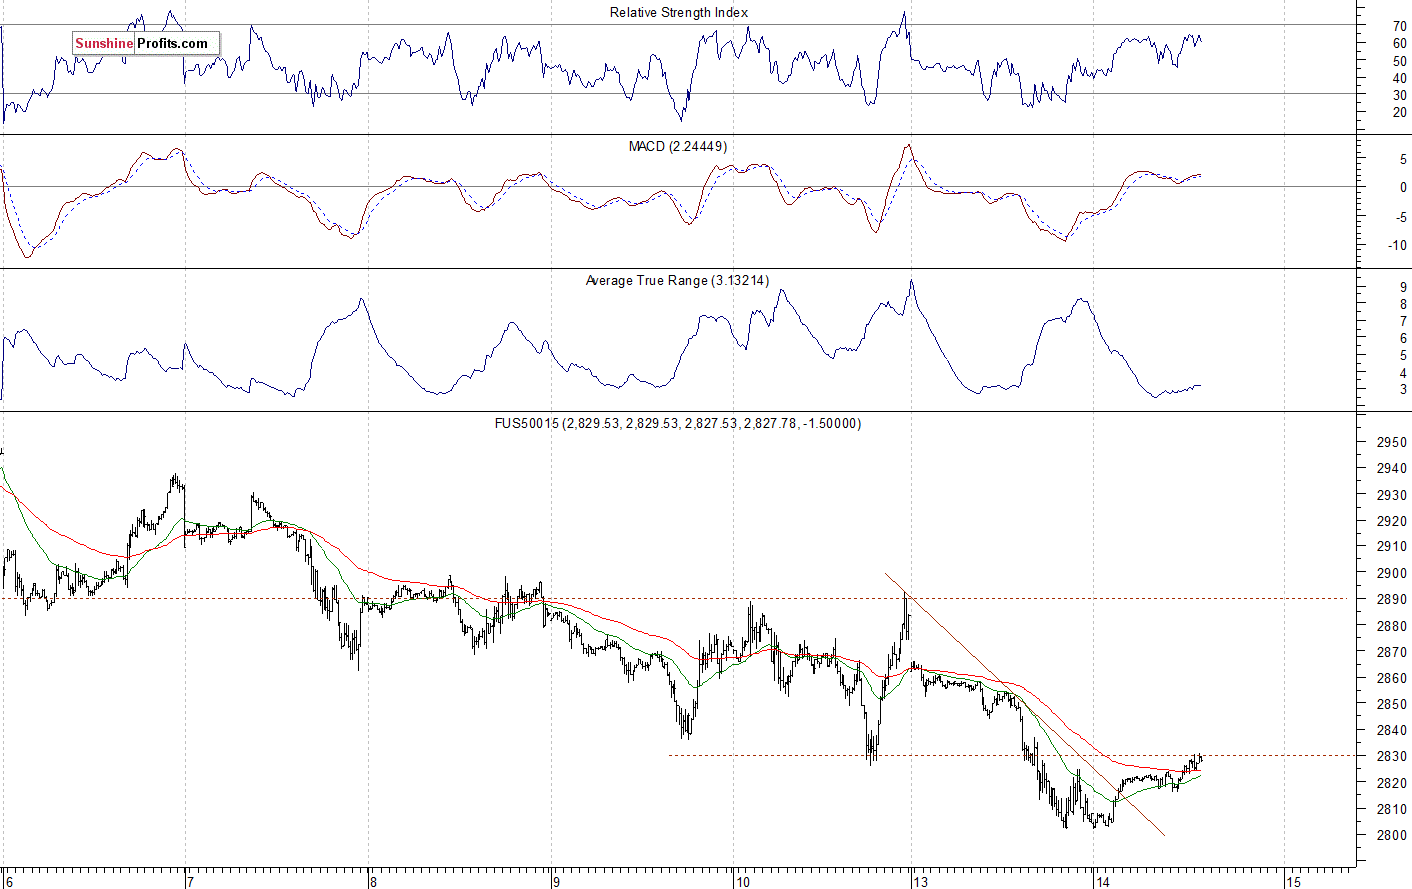
The S&P 500 futures contract trades within an intraday uptrend, as it retraces some of its yesterday's sell-off. The nearest important level of resistance is at around 2,830-2,850. On the other hand, the support level is at 2,795-2,800, marked by the local low. The futures contract remains above its yesterday's downward trend line today, as the 15-minute chart shows:
Nasdaq Also Higher This Morning
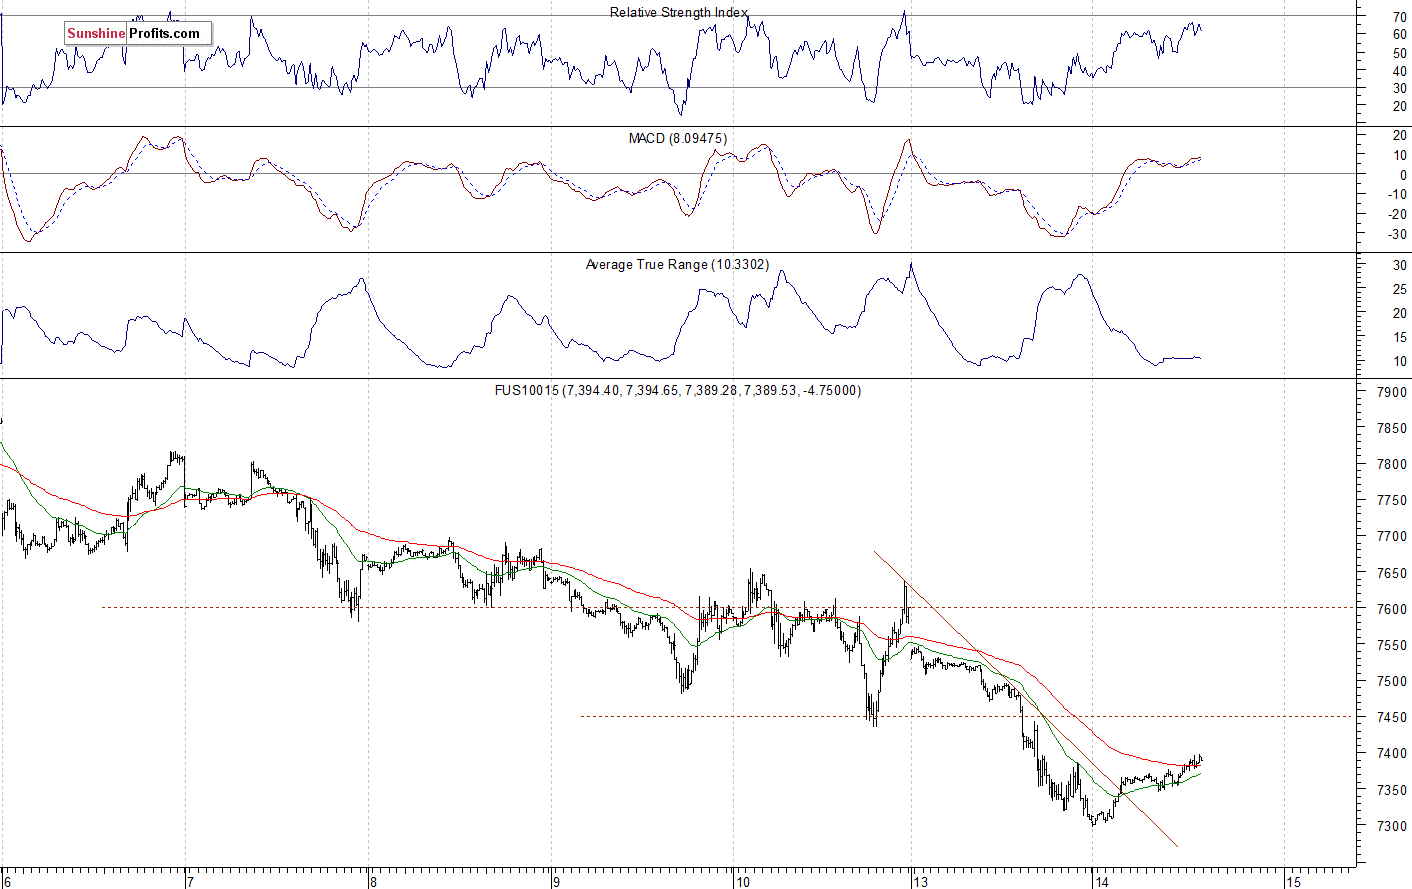
The technology Nasdaq 100 futures contract follows a similar path, as it retraces some of its yesterday's sell-off. The market fell almost 600 points from its late April record high of around 7,880. The nearest important resistance level is now at 7,400. On the other hand, the support level is at around 7,250-7,300. The Nasdaq futures contract remains below its recent local lows, as we can see on the 15-minute chart:
Big Cap Tech Stocks Selling Off
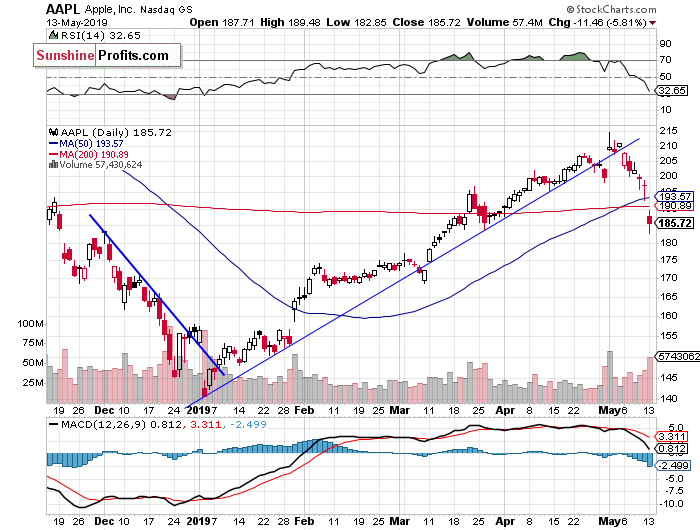
Let's take a look at the Apple, Inc. stock (AAPL) daily chart (chart courtesy of http://stockcharts.com). The stock extended its rally on May the 1st following the quarterly earnings release. Then the price reversed its upward course and broke below its medium-term upward trend line. Yesterday, it accelerated the downtrend as it broke below the support level of $190-195:
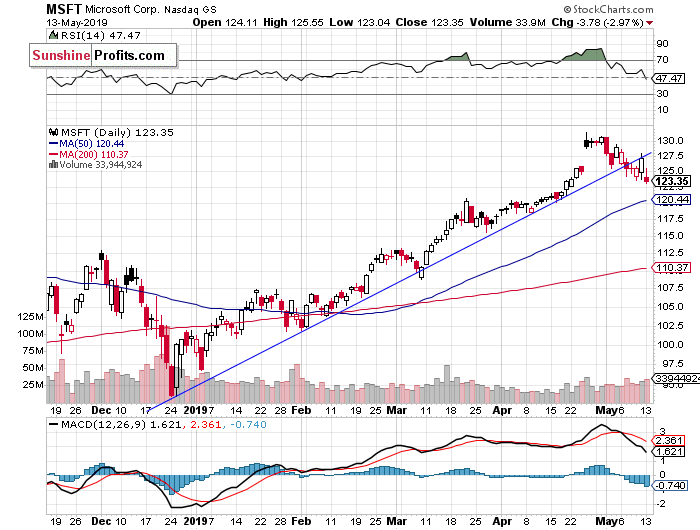
Now let's take a look at the daily chart of Microsoft Corp. (MSFT). The stock accelerated its uptrend in the late April, as it reached the new record high of $131.37. Investors reacted to a better-than-expected quarterly earnings release. But it looked like a blow-off topping pattern. And we wrote about some clear technical overbought conditions. Since then, the market is trading within a downward correction. It remains above the support level of $120-125:
Dow Jones - New Downtrend?
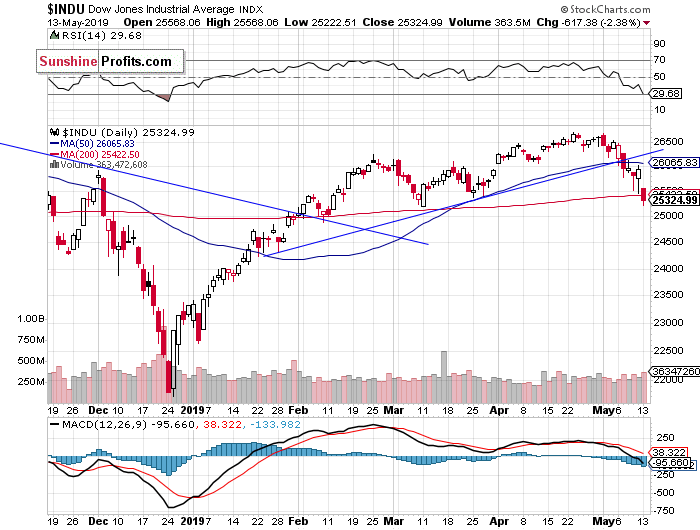
The Dow Jones Industrial Average has been relatively weaker than the broad stock market since February. The resistance level remained at around 26,800-27,000, marked by the last year's topping pattern and the record high of 26,951.8. Yesterday the blue-chip stocks' gauge followed the broad stock market, as it accelerated the downtrend. The market is now closer to the 25,000 mark, and at its important 200-day moving average:
The S&P 500 index has reached the new record high on May the 1st. The broad stock market extended its medium-term uptrend, as investors' sentiment remained very bullish following economic data, quarterly corporate earnings releases. However, then it quickly retraced its April's advance following the renewed trade war fears. On Thursday and on Friday it sold off below the 2,850 mark, before reversing higher and closing above that support level. But yesterday it fell to around 2,800.
Concluding, the S&P 500 index will likely open higher today. For now, it looks like an upward correction within a downtrend. There have been no confirmed positive signals so far.
Trading position (short-term; our opinion): no positions are justified from the risk/reward perspective.
Thank you.
Paul Rejczak
Stock Trading Strategist
Sunshine Profits - Effective Investments through Diligence and Care

