

Briefly:
Intraday trade: Our Tuesday's intraday outlook was neutral. The S&P 500 index lost 0.3% after opening 0.2% higher. The stock market is expected to open lower today, as investors' sentiment worsens following Asian stock markets' move down. We prefer to be out of the market, avoiding low risk/reward ratio trades.
Medium-term trade: In our opinion, no medium-term positions are justified.
Our intraday outlook is neutral. Our short-term outlook is neutral, and our medium-term outlook is neutral:
Intraday outlook (next 24 hours): neutral
Short-term outlook (next 1-2 weeks): neutral
Medium-term outlook (next 1-3 months): neutral
The U.S. stock market indexes lost 0.2-0.7% on Tuesday, after opening higher, as investors took profits off the table. The S&P 500 index bounced off its last week's Monday's local high and it currently trades 5.4% below January 26 record high of 2,872.87. The Dow Jones Industrial Average lost 0.7%, as it was relatively weaker than the broad stock market. The technology Nasdaq Composite lost 0.2% yesterday.
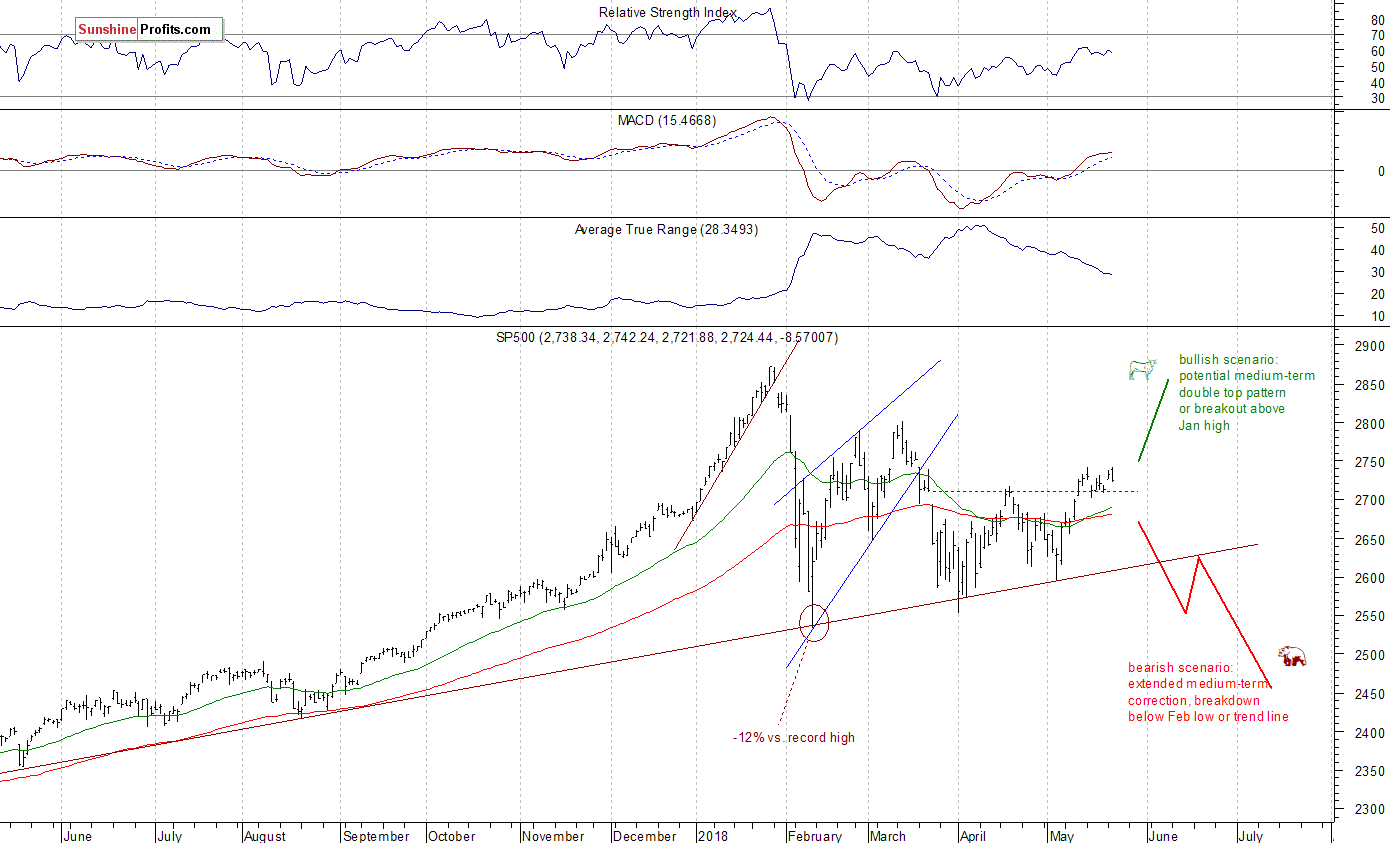
The nearest important level of resistance of the S&P 500 index remains at around 2,740-2,750, marked by recent local highs along with mid-March local high. On the other hand, support level is at around 2,720, marked by Monday's daily gap up of 2,719.50-2,725.70. The support level is also at 2,700-2,710, marked by previous daily gap up of 2,701.27-2,704.54 and some recent daily lows.
The broad stock market extended its short-term uptrend in the beginning of the month, as the S&P 500 index broke above the level of 2,700. Stocks lost some ground on a week ago, but it didn't look like new downtrend. Since then, the market traded within consolidation. So, will the run-up continue towards 2,800? There are still two possible medium-term scenarios - bearish that will lead us below February low following trend line breakdown, and the bullish one in a form of medium-term double top pattern or breakout towards 3,000 mark. There is also a chance that the market will just go sideways for some time, and that would be positive for bulls in the long run (some kind of an extended flat correction):
Negative Expectations, New Downtrend?
The index futures trade 0.6-0.9% below their yesterday's closing prices, so expectations before the opening of today's trading session are negative. The main European stock market indexes have lost 0.7-1.5% so far. Investors will wait for series of economic data announcements this morning: Flash Manufacturing PMI, Flash Services PMI at 9:45 a.m., Consumer Confidence, New Home Sales number at 10:00 a.m., Crude Oil Inventories at 10:30 a.m., FOMC Minutes at 2:00 p.m. The broad stock market will probably continue to fluctuate within its short-term consolidation today. However, it is closer to breaking below its recent local low. If the index break below 2,700 mark, then we may see more selling pressure.
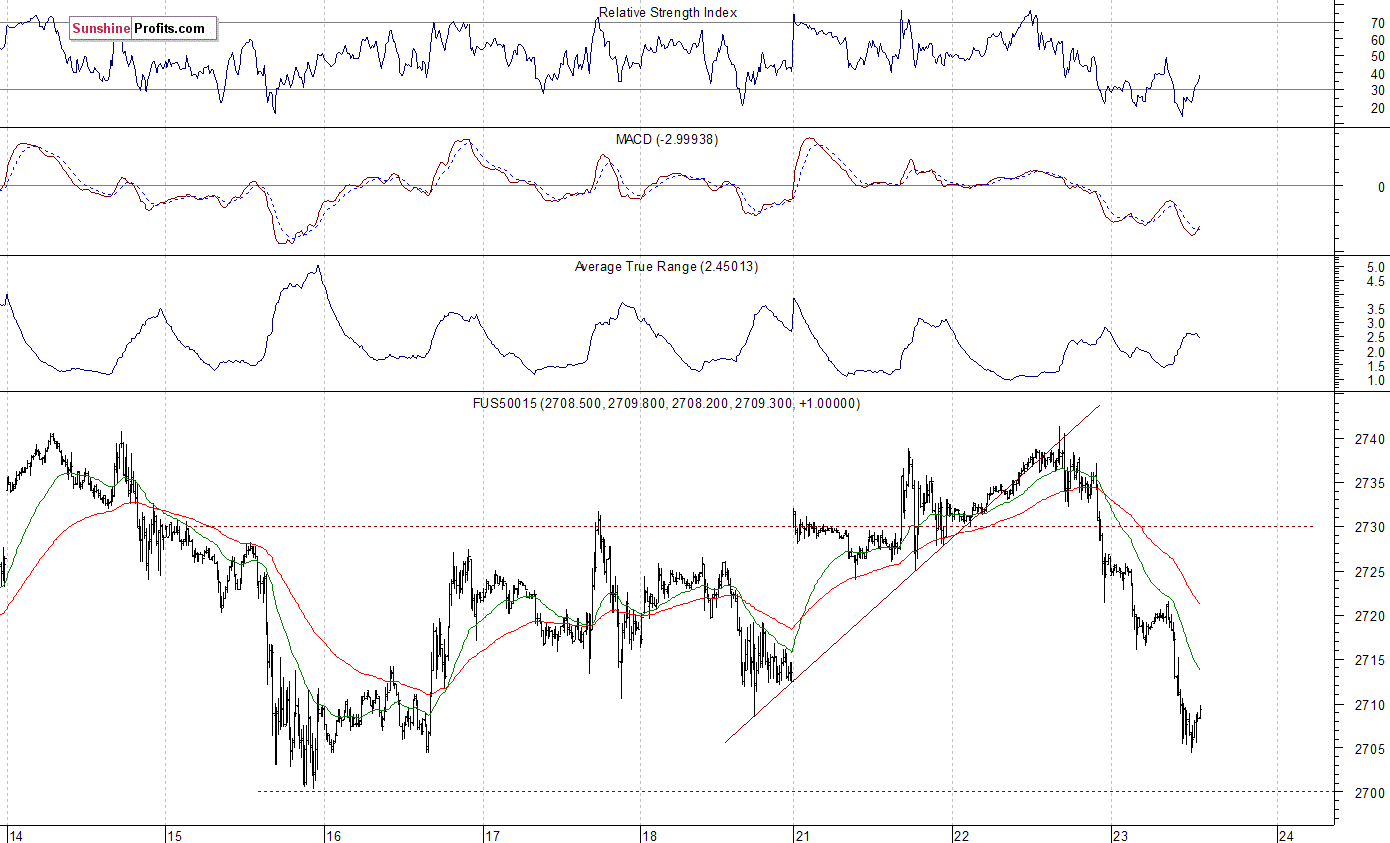
The S&P 500 futures contract trades within an intraday downtrend, as it extends its yesterday's move down. The nearest important level of resistance is at around 2,715-2,720, marked by previous support level. The resistance level is also at 2,730-2,740. On the other hand, support level is at 2,700. Potential level of support is also at around 2,680-2,685, marked by previous local highs. The futures contract trades closer to 2,700 mark, as we can see on the 15-minute chart:
Nasdaq Also Lower
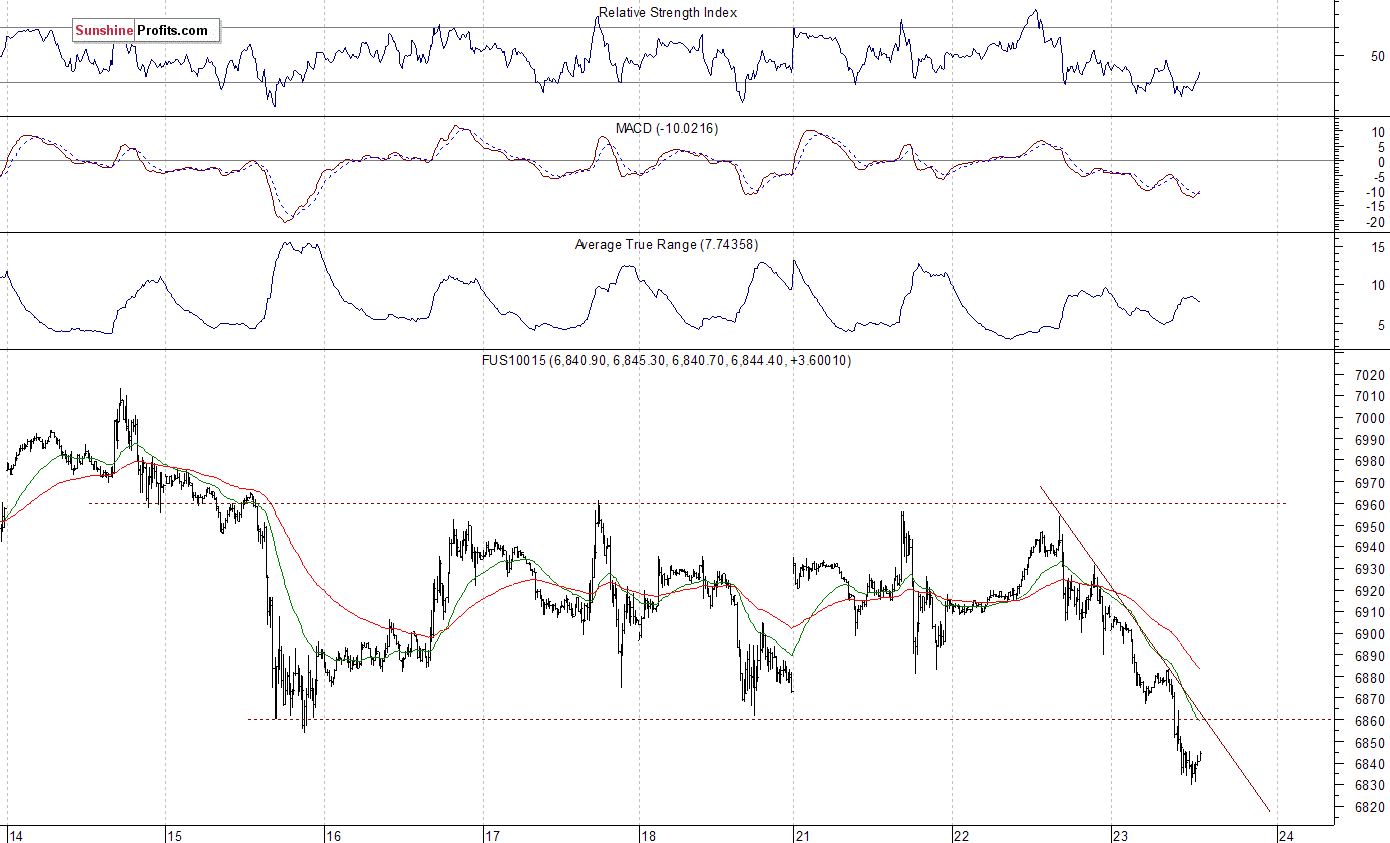
The technology Nasdaq 100 futures contract follows a similar path, as it trades within an intraday downtrend. The market bounced off 6,950 mark yesterday and it continued below the level of 6,900 this morning. Is this a new downtrend? It's still hard to say. Tech stocks retraced some more of their early May advance. The nearest important level of support is at around 6,770-6,800, marked by previous short-term consolidation. The next support level is at 6,700-6,750, among others. On the other hand, level of resistance is at 6,850-6,870, marked by recent local lows. The Nasdaq futures contract broke below its short-term consolidation, as the 15-minute chart shows:
Apple, Amazon - Big Cap Tech Stocks Still Inconclusive
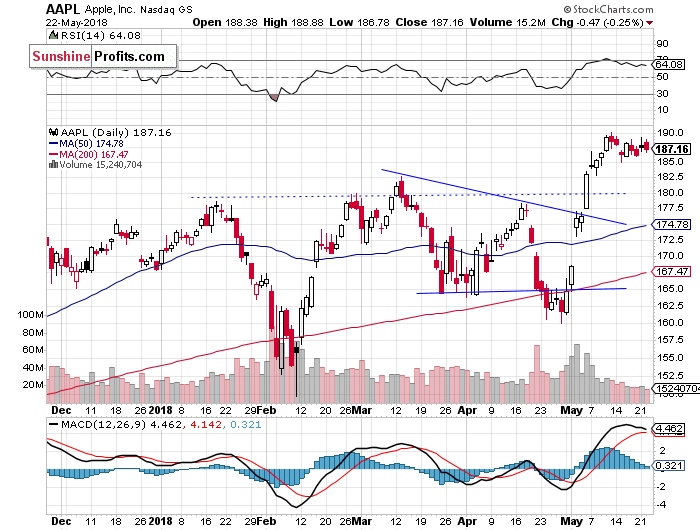
Let's take a look at Apple, Inc. stock (AAPL) daily chart (chart courtesy of http://stockcharts.com). It reached new record high more than a week ago on Friday, as it extended its short-term uptrend. The price bounced off resistance level of around $190-200 and since then it trades within a consolidation. Is this a topping pattern? There have been no confirmed negative signals so far:
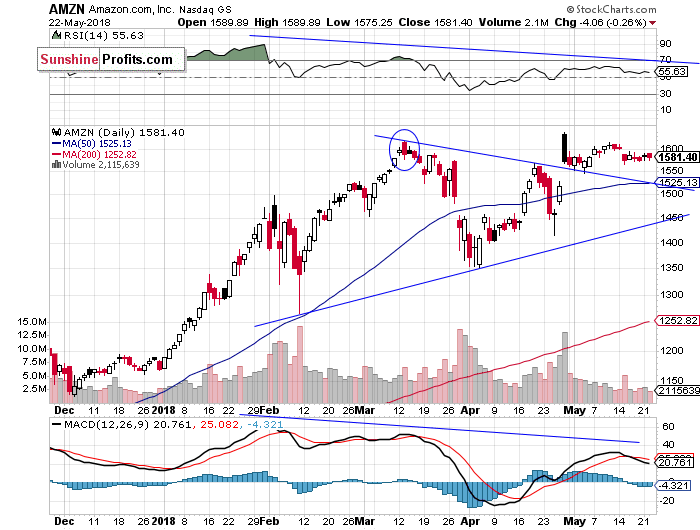
Now let's take a look at Amazon.com, Inc. stock (AMZN) daily chart. The price reached new record high in late April, as investors reacted to better-than-expected quarterly earnings release. Then, on the same trading day it sold off below $1,600. Was this a downward reversal or just correction following breakout higher? The recent price action looked pretty bullish, as price got back closer to all-time high level. However, the stock retraced some of its recent advance last week. We may see some more short-term uncertainty following late April rally:
Dow Jones - Bearish Engulfing Pattern?
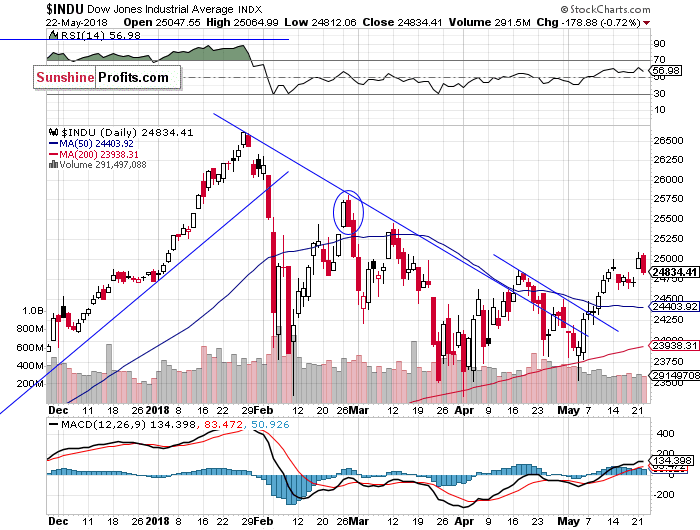
The Dow Jones Industrial Average broke above its medium-term downward trend line recently. Then it continued higher above a few-week-long downward trend line. The blue-chip index bounced off resistance level of 25,000 a week ago, and then it retraced its recent advance. Monday's trading session was bullish as Dow Jones broke above its recent local high and closed at 25,000 mark, but it failed to continue higher and got back lower yesterday. We can see a negative bearish engulfing candlestick pattern. Will this pattern be confirmed today? It looks like a probable scenario:
The broad stock market failed to continue its Monday's move up yesterday, as the S&P 500 index bounced off resistance level at around 2,740. However, it still continues to trade above 2,700 mark, following recent breakout above that resistance level. Is this a new uptrend? Or some topping pattern before downward reversal? There have been no confirmed negative signals so far. Just like we wrote in our several Stocks Trading Alerts, the early February sell-off set the negative tone for weeks or months to come.
Concluding, the S&P 500 index will probably open lower today, as investors' sentiment worsened following global stock markets move down. The broad stock market bounced off resistance level yesterday, and it is closer to breaking below its short-term consolidation. If the index continues below 2,700, we could see more selling pressure.
Currently, we prefer to be out of the market, avoiding low risk/reward ratio medium-term trades. We will let you know when we think it is safe to get back in the market.
To summarize: no medium-term positions are justified from the risk/reward perspective at this moment.
Intraday trade:
No intraday position is justified from the risk/reward perspective today.
No medium-term position is justified from the risk/reward perspective at this moment.
Thank you.
Paul Rejczak
Stock Trading Strategist
Stock Trading Alerts

