

Today’s CPI release is in focus as inflation doubles expectations. Tech is leading in morning trade today in New York.
Bank earnings were strong this morning; with JP Morgan Chase (JPM) and Goldman Sachs (GS) having big beats versus analyst expectations. These strong earnings results are being overshadowed mid-session with yet another giant print in CPI data.
Giant CPI Data Print
This morning, the market consensus was for a CPI print of 0.5%, but yet again, we got a huge number at 0.9%. This level is the highest since 2008 and has seemed to put a cloud over today’s trade in New York. The S&P 500 is essentially flat so far today, after dipping 20 handles on the 8:30 AM data release and recuperating all of the CPI news release losses by 10:00 AM. It is one of those kinds of trading sessions so far, but we still have several hours to go today. Tech continues to be strong today, with many individual names lighting up green on the screen. Is the tech trade getting somewhat crowded at these levels?
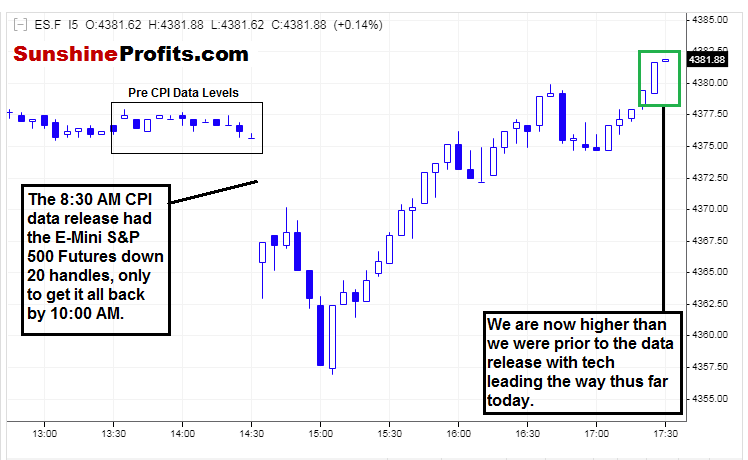
Figure 1 - E-Mini S&P 500 Futures (September Contract) July 12, 2021 - July 136, 2021, 5 Minute Candles Source stooq.com
Cash traders wouldn’t even know the movement took place.
As today progresses, it feels like the market is digesting the monster CPI print and where capital will be allocated going forward. Interest rates initially fell hard off the data release; but have since been climbing back intraday, as the $SPX has been gaining a little bit of some steam.
There is no question that the S&P 500 is in full resilience mode here. Shaking off the large CPI prints without hesitancy and resuming the upside tells us a story. What the end result of that story is going to be is still up for interpretation. As more time passes and more digestion occurs, the picture will become clearer.
At times like this, I like to allow the data to be digested before making new decisions. This reflection period allows time to manage perspective and outlook on existing opinions/positions.
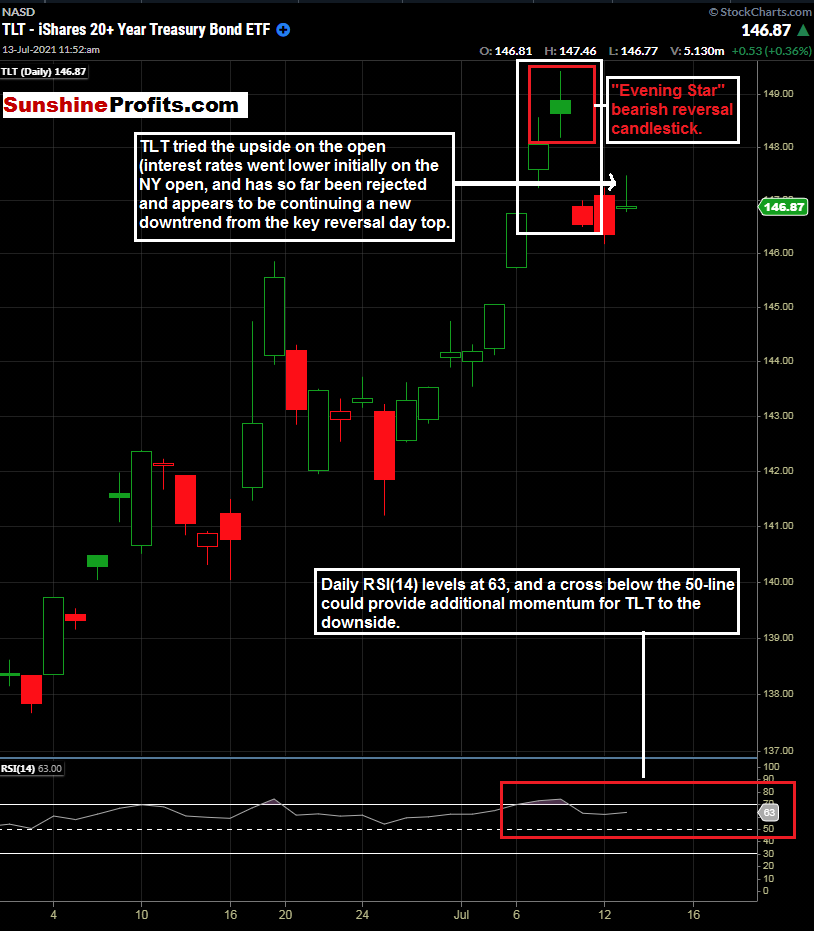
Figure 2 - TLT iShares 20+ Year Bond ETF June 1, 2021 - July 13, 2021, Daily Candles Source stockcharts.com
It is starting to look more and more that we have experienced a key reversal day in TLT and interest rates. The candle formation July 7th - 9th resembles an “Evening Star” formation, and the uppermost candle on July 8th looks like it marks a short-term top.
An evening star formation is a bearish reversal pattern that continues an uptrend with a long green (up)body day followed by a gapped up small body day, then a down close with the close below the midpoint of the first day.
If you are looking to beef up your candlestick knowledge, I highly suggest checking out ChartSchool on Stockcharts. It has been a valuable resource for 20 years and continues to be an excellent reference and knowledge resource.
Right now, let’s see how the remainder of the session plays out given the big bank earnings results so far; and the large CPI data print.
I still like the idea of staying long the banks and short bonds (higher interest rates) at this time.
To sum up the current viewpoint and opinion:
I have BUY opinions for:
- SPDR S&P Bank ETF (KBE) between $48.11 - $49.39/$50.00. Update 07/13: Consider getting long on the pullback in financials. CPI did not help financials today, and there are more bank earnings due out this week.
- Defiance Quantum ETF (QTUM) between $44.00 - $49.50. Update 07/13: This one is in the green today with the last trade at $49.31 (last time I checked). One of these days we will wake up to a breakout above the recent range and clear $50.47 IMO. This is a play in automation, robotics, and AI. Once this range is broken to the upside, I think we could see $55 - $60 rather quickly. Always use a stop loss level that caters to your individual risk tolerance.
- Amplify Transformational Data Sharing ETF (BLOK) between the 200-day moving average and $40.00 200-Day Moving Average is currently $41.56 Update 07/13: I’ve kept this one on the board, so I can keep monitoring it. It is getting closer and closer to the 200-day moving average. Crypto has consolidated for a long time now, and there could be another downside try. Wait for the pullback. Always use a stop loss level that caters to your individual risk tolerance.
- Invesco MSCI Sustainable Future ETF (ERTH) between $65 and $66. Update 07/13: Consider getting long on pullbacks to $66 or less. When looking at the chart, keep in mind there was an unusually large dividend paid on June 21st ($9.95 per share). So, the price had to adjust for it. Another way to look at it is by adding $9.95 to the current price to see the pre-dividend stock price. This has been good to us. This is a good play with the current administration and has been good to us so far. Always use a stop loss level that caters to your individual risk tolerance.
- Invesco Exchange-Traded Fund Trust - S&P SmallCap 600 Pure Value ETF (RZV) on pullbacks. Update 07/13: Small-caps have been a bit thorny since the Russell 2000 Reconstitution. This is below our initial long opinion level of $93.88. I do think small-caps will find love once again. Targeting $100 here. Always use a stop loss level that caters to your individual risk tolerance.
- iShares Global Timber & Forestry ETF (WOOD) Update 7/13: Trading near $89.00 today and continuing to monitor. This has been good to us. Premium Subscribers were notified in the June 16th publication to consider the first tranche of buying between $86.50 and $87.50. Look to add the 2nd tranche between $81.62 (200-day SMA) and $80.00. We are trading at $89.39 (last time I checked). Always use a stop loss level that caters to your individual risk tolerance.
- Invesco Solar ETF (TAN) Update 07/13: Up again, but do not chase if not already long. Wait for pullbacks. We have the 200-day SMA at $87.90 and the 50-day SMA @80.11. TAN has been very good to us. If not on board, wait for a pullback; this one can move erratically in both directions. Targeting $100 - $125. Always use a stop loss level that caters to your individual risk tolerance.
I have SELL opinions for:
- iShares 20 Plus Year Treasury Bond ETF (TLT) when $TNX trades 1.291% or at the 200-day moving average of TLT ($148.47) / $147.75 - $148.47. Update 07/13: Stay short as we target $139.50 - $141.25 as potential take profit levels. A suggested risk to this trade is to a 2nd daily close above $153.16. Always use a stop loss level that caters to your individual risk tolerance. These levels can fluctuate, so please stay tunedAlways use a stop loss level that caters to your individual risk tolerance.
I have a HOLD opinion for:
- First Trust NASDAQ Clean Edge Smart Grid Infrastructure Index Fund (GRID). Update 07/13: Continue to hold. This has been a favorite. I have moved it to hold, as I do not suggest chasing it here. This has been a buy opinion from the May 6th publication between $86.91 - $88.17 Hold longs. I have liked this one for a longer-term-swing trade or longer-term holding, and am looking for signs to ring the register. Today, we are trading $94.41 the last time I checked, and I think it has a little more gas in the tank. Stay tuned. Always use a stop loss level that caters to your individual risk tolerance.
Thanks for reading today’s Stock Trading Alert. Let’s let the market digest the CPI and see where the money flows go. Your readership is valued and appreciated. Have a great day!
Thank you,
Rafael Zorabedian
Stock Trading Strategist

