

I hope this message finds you coming back to business after a relaxing weekend. We needed one! Last week was a volatile one across most US equities, but in the big picture, it was just a mild pullback.
After last week's enormous CPI print, US markets will have a quieter economic data schedule this week. There is Housing Starts on Tuesday, Philly Fed Manufacturing Index, and Unemployment Claims (not the big Non-Farm Payroll number) on Thursday, along with Flash manufacturing PMI on Friday. The upcoming week is a light data week, and these metrics do not usually move the markets all that much.
First, let’s take a look at the S&P 500 and recap how it closed out the week along with the key levels that we have been monitoring.
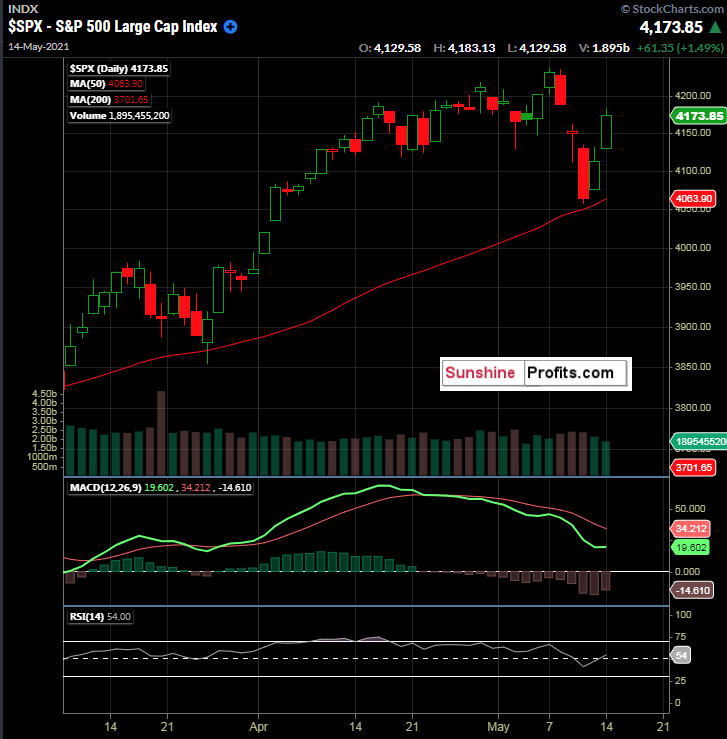
Figure 1 -S&P 500 Index Daily Candles ($SPX) March 9, 2021 - May 14, 2021. Source stockcharts.com
Here, we see how the $SPX traded lower midweek and bounced Thursday (May 13) and Friday (May 14). As we were looking for a test of the 50-day moving average, it just didn’t quite make it to the exact level before bouncing, at least not in the cash market. In the futures market, however, the June E-Mini S&P 500 Futures contract did indeed briefly break its 50-day moving average.
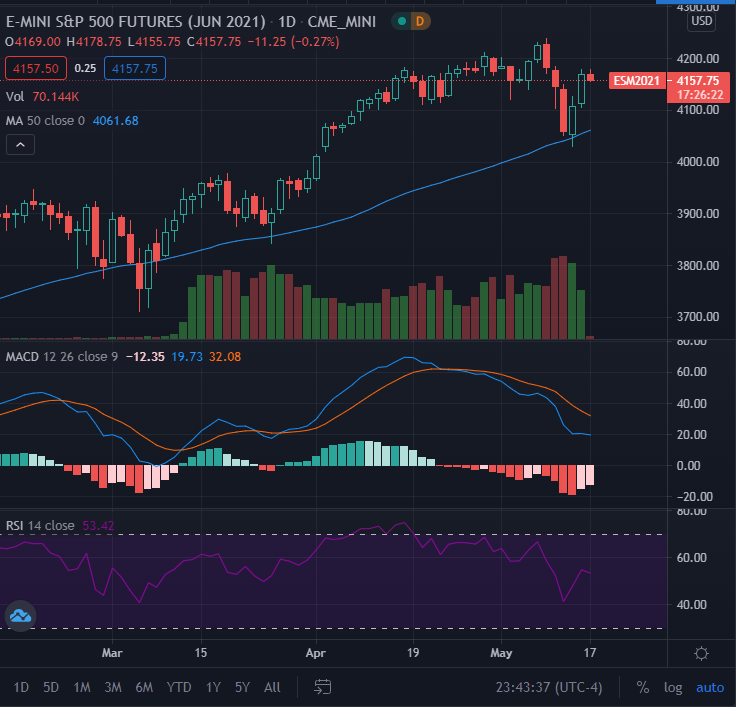
Figure 2 - E-Mini S&P 500 Futures (June 2021) Daily Candles February 9, 2021 - May 10, 2021. Source tradingview.com
This is how it goes sometimes. If you are an active trader in the index, things can happen overnight that trading in the equity product just won't provide price exposure to; and this can be a good or bad thing. The 50-day moving average was breached and then held between 4 AM - 5 AM (Eastern Time) on Thursday, May 13th, 2021. Some “early bird catch the worm” type traders may have caught this and used it.
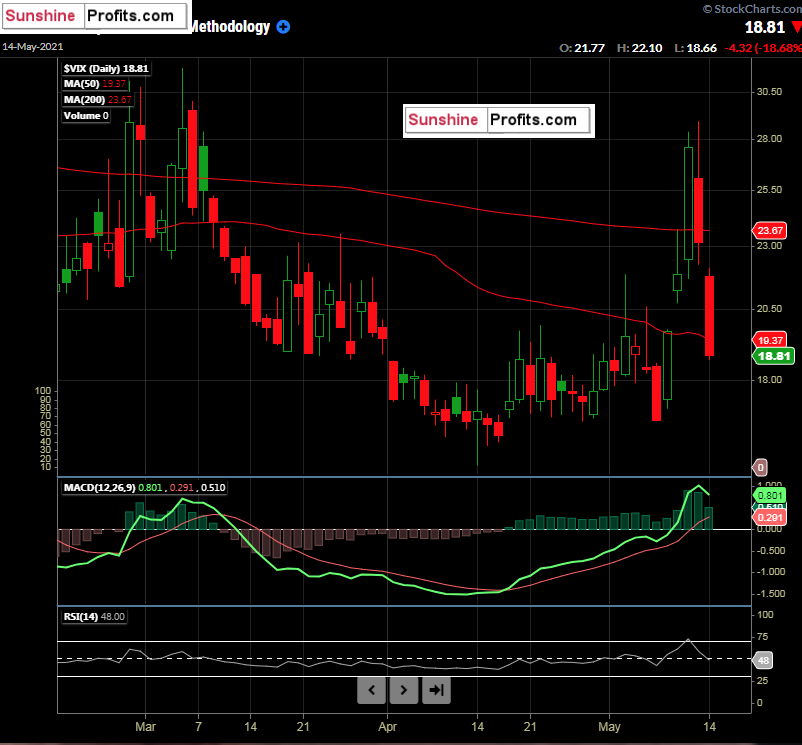
Figure 3 - $VIX Volatility Index Daily Candles February 16, 2021 - May 10, 2021. Source stockcharts.com
As the S&P 500 bounced from near its 50-day moving average on Thursday and Friday, we saw the $VIX get hammered, as traders sold volatility, sucking the vol right out of the S&P 500 options.
So, where do we go from here in the S&P 500? I will still be watching for an actual test of the 50-day moving average in the cash index. However, it feels like the market wants to trade sideways to higher in the short term. Let’s wait and see what clues develop this week.
Some futures traders may have caught the reversal in the large-cap index, and hats off if you are one of them. Since we have bounced so hard on Thursday and Friday, I turn my attention to finding other names that could be at interesting levels. Amplify Transformational Data Sharing ETF (BLOK) has been on the radar.
The BLOK ETF, which contains Paypal Holdings, MicroStrategy, Square, Voyager Digital, and Galaxy Holdings Ltd. as its Top 5 holdings, invests in blockchain businesses and the technology behind it.
As more and more companies are adopting bitcoin or other cryptocurrencies in some form in recent days, plus the pullback that bitcoin has been experiencing (down over 34% from its all-time highs), today is a good day to take a look at BLOK.
First, BLOK has a very interesting correlation to the price direction of Bitcoin. Take a look:
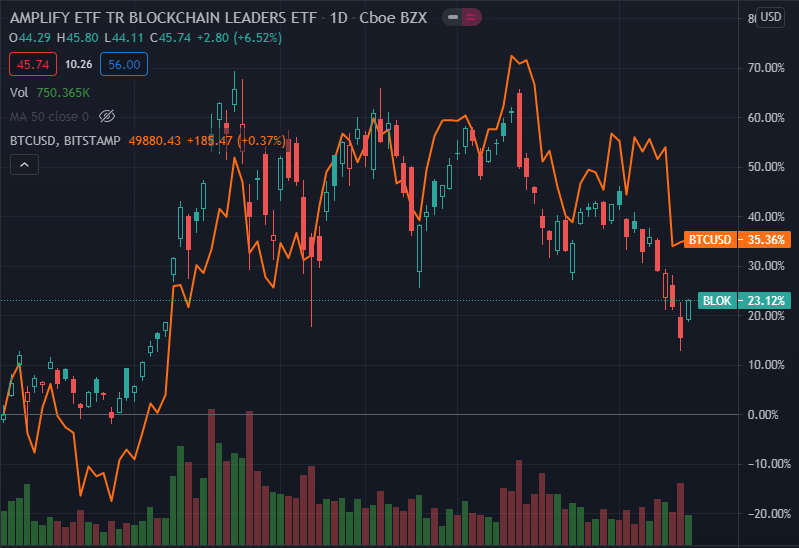
Figure 4 - BLOK Amplify Transformational Data Sharing ETF Daily Candles with Bitcoin Price Comparison Line Chart BTCUSD Bitstamp January 6, 2021 - May 17, 2021. Source tradingview.com
I find it very interesting that the BLOK ETF correlates so well to the price of Bitcoin, given that the product invests in companies involved with blockchain technology, and given its Top 5 holdings as mentioned above. The candlesticks are BLOK, and the red line is the price of Bitcoin.
Next, as I write this around 12:30 AM (Eastern Time) on Monday (May 17) the price of Bitcoin is getting crushed pretty hard. This is in part due to some Elon Musk tweets yesterday about whether Tesla dumped their BTC holdings last quarter. Taking the Musk drama out (he seems to be able to influence several crypto markets), let’s look at the BLOK technicals, knowing that there has been a steady correlation to the price of Bitcoin in recent months.
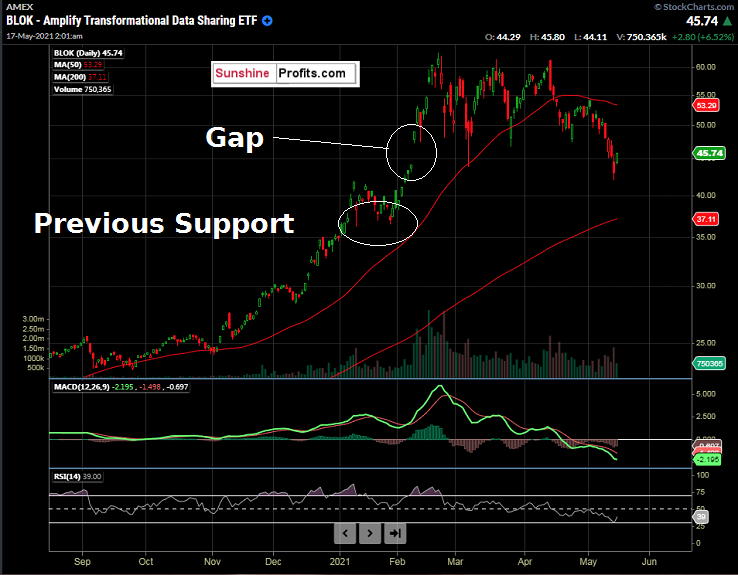
Figure 5- BLOK Amplify Transformational Data Sharing ETF Daily Candles August 14, 2020- May 14, 2021. Source stockcharts.com
Above, we can see some previous support around 36.50 - 37.00. BLOK is trading below its 50-day moving average, and the 200-day moving average sits at $37.11 as of the time of this writing (it will change daily). Also, notice the previous gap, which was just filled again last week.
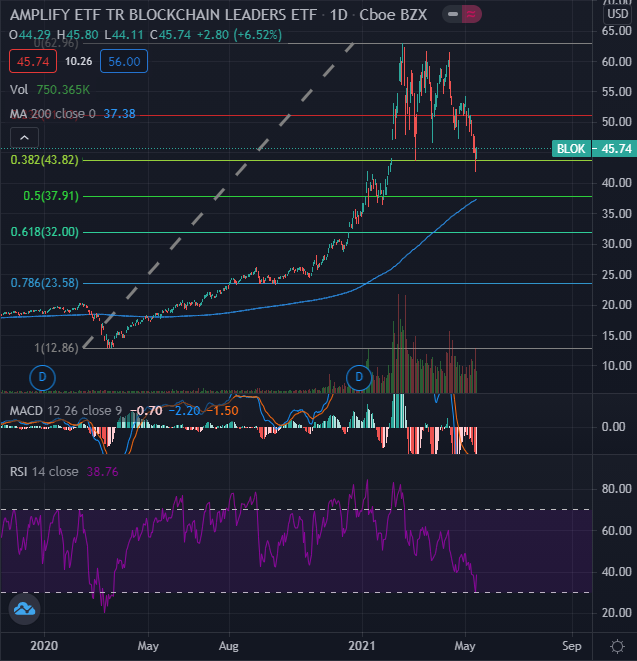
Figure 5 - BLOK Amplify Transformational Data Sharing ETF Daily Candles December 6, 2019 - May 14, 2021. Source tradingview.com
Zooming out further in time, we can see the Fibonacci retracement levels, beginning with the March 2020 lows through the recent highs made in early 2021. Notice that the 50% retracement ($37.91) is very close to the 200-day moving average of $37.11.
Since Bitcoin is down over 9% as of now, since Friday’s US market closes (BTC trades 24x7), there could be a dip lower in BLOK that might create an opportunity, given the correlation between the two, as detailed above.
The 200-day moving average, 50% retracement, and previous support levels are interesting to me. Could it get there? If it does, $36.50 - $37.91 should correlate to a deeply oversold RSI(14). These are the levels to watch, in my opinion.
To sum up the current viewpoint and opinion:
I have BUY opinions for:
- Amplify Transformational Data Sharing ETF (BLOK) between $36.50 - $37.91. BLOK has a history of high volatility, so proceed with caution. Always use a stop loss level that caters to your individual risk tolerance.
- Invesco MSCI Sustainable Future ETF (ERTH) between $67.76 - $68.74. Always use a stop loss level that caters to your individual risk tolerance.
Given the bounce-back late last week, I am in wait and see mode for $SPX.
- S&P 500 ($SPX): but ONLY on a pullback to; or below the 50-day moving average (currently 4049.94), making the suggested idea range for entry 3990 - 4049.94. For traders using SPY, the current 50-day moving average is 403.69, so a range of approximately 398 - 403.69 would line up rather well. Always use a stop loss level that caters to your individual risk tolerance.
I have SELL opinions for:
NONE
I have a HOLD opinion for:
- First Trust NASDAQ Clean Edge Smart Grid Infrastructure Index Fund (GRID). GRID has traded through our idea range of between $86.91 and $88.17. It is not suggested to chase it, if not already long, in my opinion.
- Update 05/17 (pre-open): GRID traded through our buy idea range last week and has traded similarly to the $SPX over the last few sessions. Short-term traders can look at the 52-week high of $90.96 and high $90.00’s to the psychological $100.00 level as take profit level ideas. Always use a stop loss level that caters to your individual risk tolerance.
Have a great week!
Thank you,
Rafael Zorabedian
Stock Trading Strategist

