

Briefly:
Intraday trade: Our Tuesday's intraday outlook was neutral. It proved accurate, because the S&P 500 index was virtually flat yesterday, after opening 0.2% higher. Today, the stock market will probably extend its short-term uptrend slightly. However, we can see some close resistance levels ahead. Therefore, we prefer to be out of the market, avoiding low risk/reward ratio trades.
Medium-term trade: In our opinion, no medium-term positions are justified.
Our intraday outlook is neutral. Our short-term outlook is neutral, and our medium-term outlook is neutral:
Intraday outlook (next 24 hours): neutral
Short-term outlook (next 1-2 weeks): neutral
Medium-term outlook (next 1-3 months): neutral
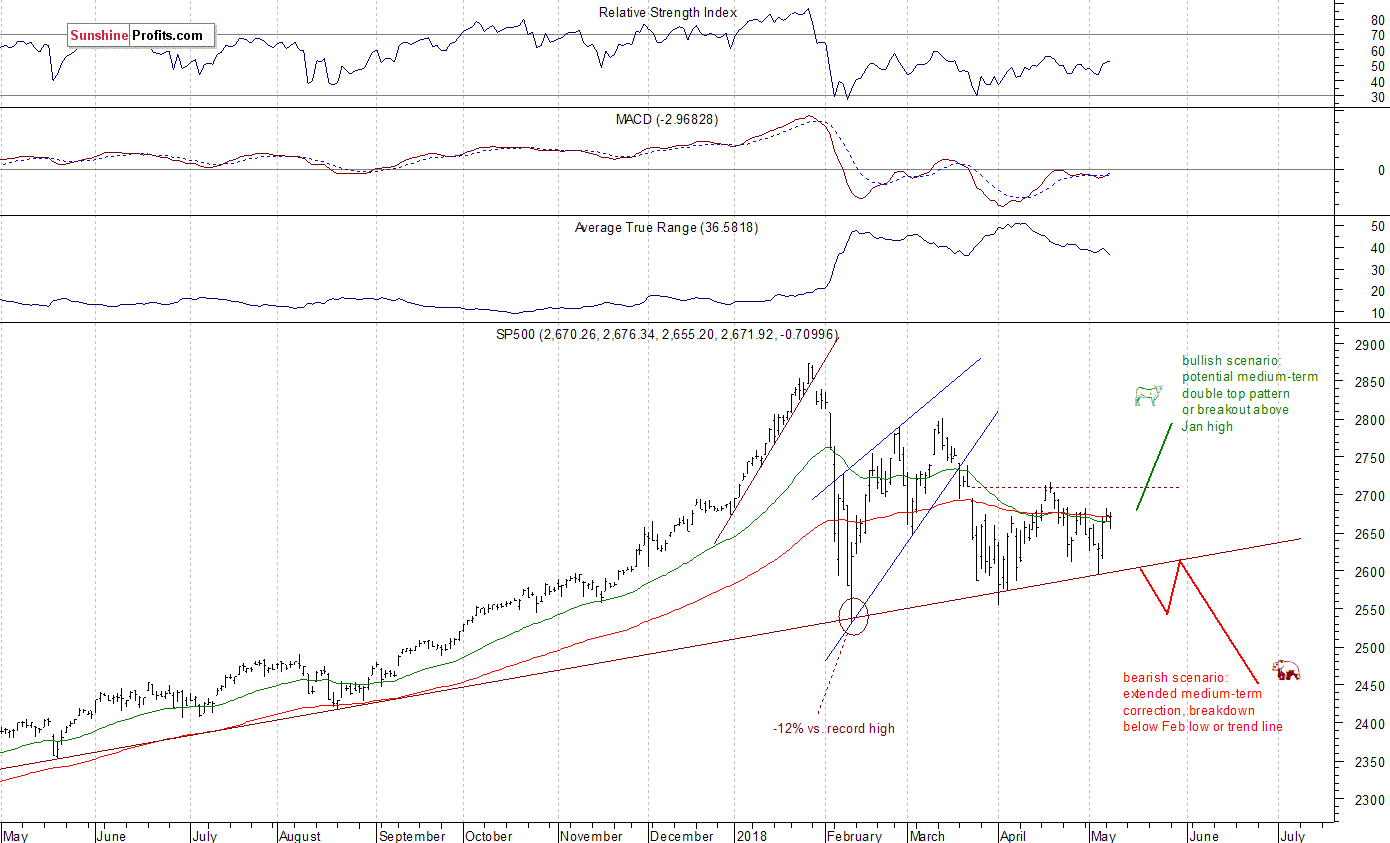
The main U.S. stock market indexes were virtually flat on Tuesday, as investors hesitated following recent move up. The S&P 500 index continues to trade close to its short-term local highs. It is currently 6.9% below January 26 record high of 2,872.87. Both Dow Jones Industrial Average and the technology Nasdaq Composite were unchanged yesterday.
The nearest important level of resistance of the S&P 500 index remains at around 2,685, marked by previous local high. The next resistance level is at 2,695-2,710, marked by March 22 daily gap down of 2,695.68-2,709.79. On the other hand, support level is at 2,660-2,665, and the next level of support is at 2,635-2,640, among others.
The broad stock market continues its medium-term consolidation following late January - early February sell-off. There are still two possible medium-term scenarios - bearish that will lead us below February low following trend line breakdown, and the bullish one in a form of medium-term double top pattern or breakout towards 3,000 mark. There is also a chance that the market will just go sideways for some time, and that would be positive for bulls in the long run (some kind of an extended flat correction):
Positive Expectations, Will Uptrend Continue?
Expectations before the opening of today's trading session are positive, because the index futures contracts trade 0.3-0.5% higher vs. their Tuesday's closing prices. The European stock market indexes have been mixed so far. Investors will wait for some economic data announcements: Producer Price Index, Building Permits at 8:30 a.m., Wholesale Inventories at 10:00 a.m., Crude Oil Inventories at 10:30 a.m. The broad stock market may extend its short-term uptrend today, following yesterday's profit-taking action. However, if the S&P 500 index gets closer to relatively important resistance level of around 2,700, we may see some selling pressure.
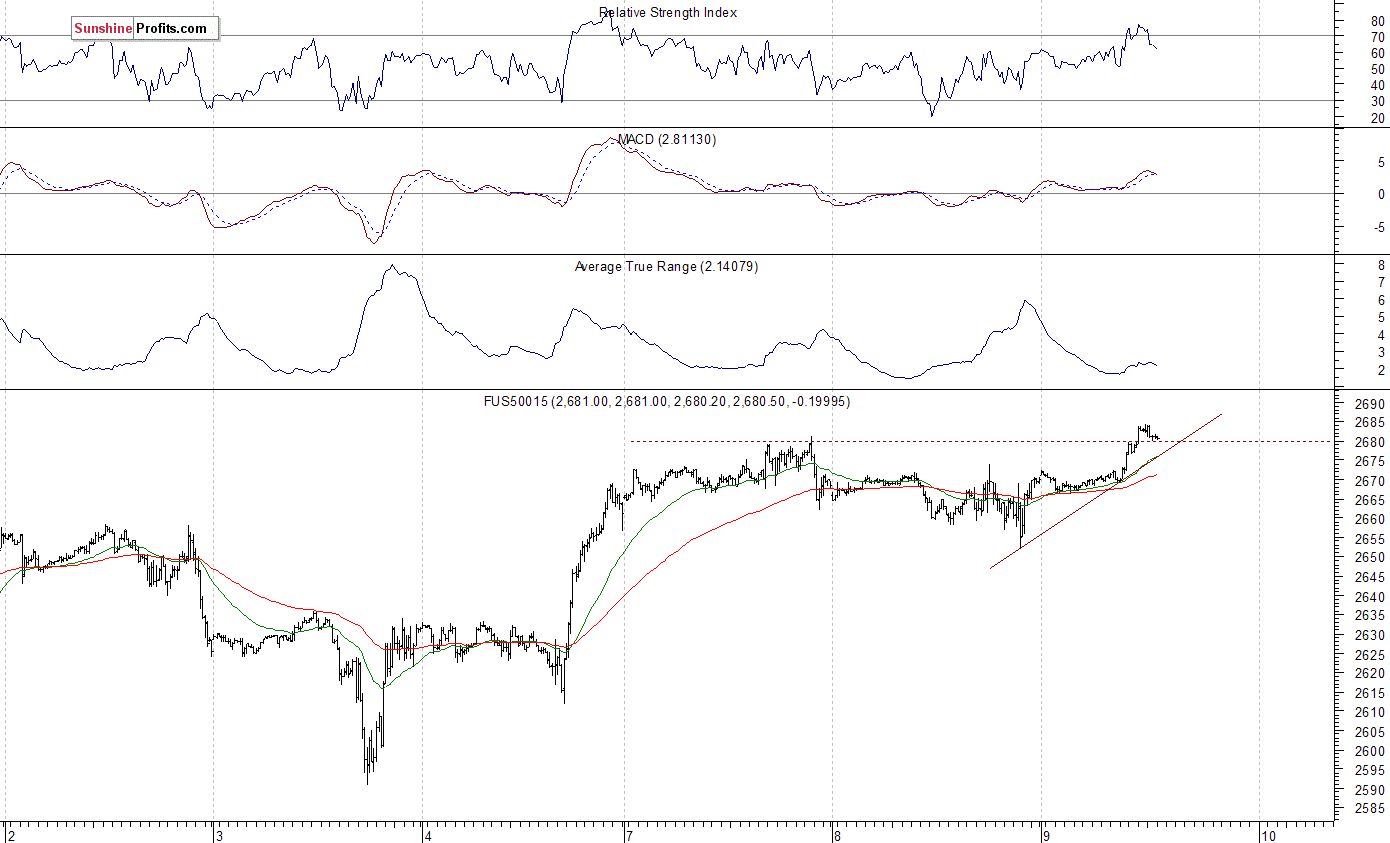
The S&P 500 futures contract trades within an intraday uptrend, as it breaks above its Monday's local high. Potential resistance level is at around 2,700-2,720, marked by previous local highs. On the other hand, support level is now at 2,670-2,675, marked by recent resistance level. The support level is also at 2,650-2,660. The futures contract trades above its short-term upward trend line, as we can see on the 15-minute chart:
Nasdaq Also Higher
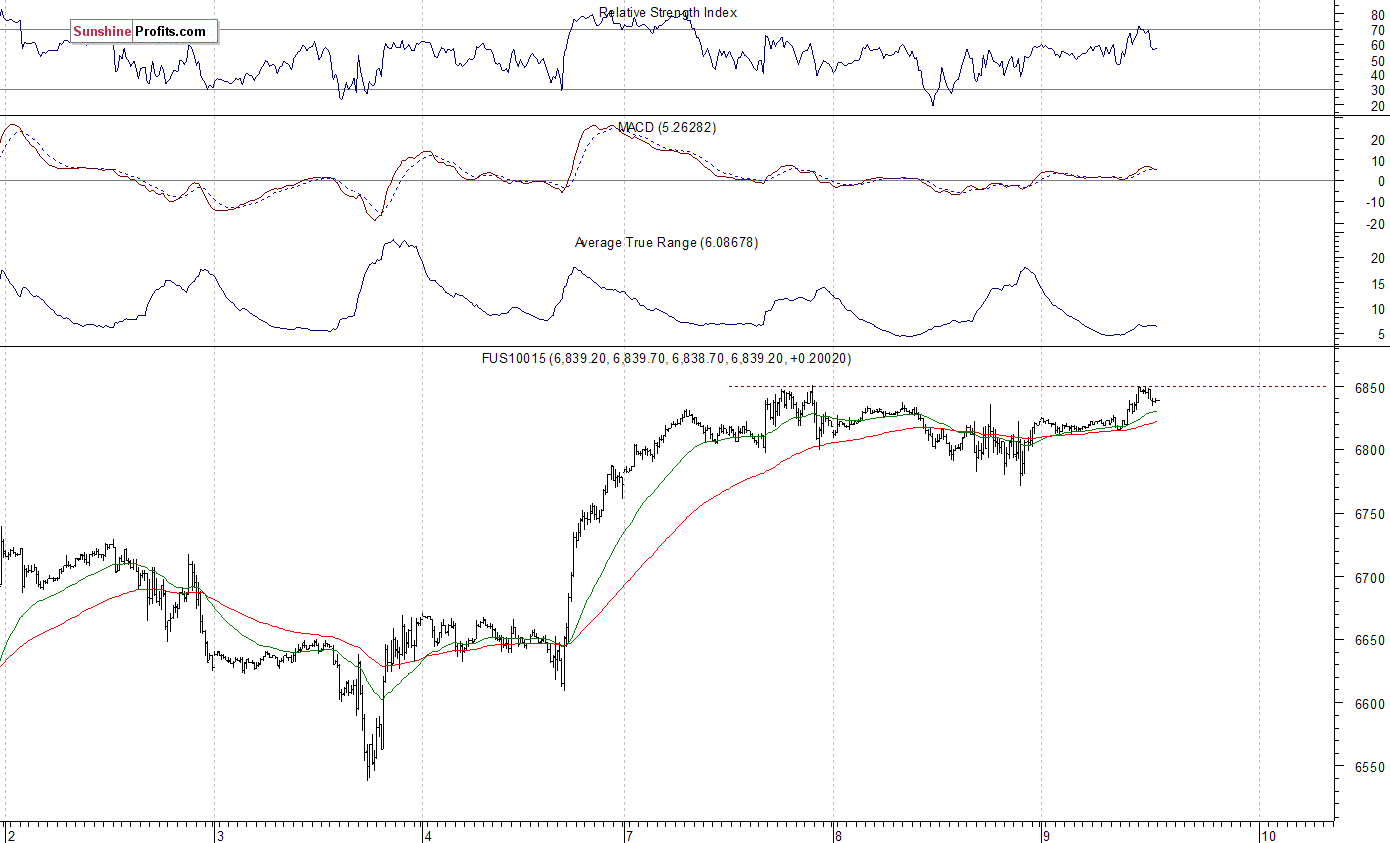
The technology Nasdaq 100 futures contract follows a similar path, as it trades within an intraday uptrend. The market fell closer to 6,500 mark on Thursday, but it quickly came back above the level of 6,600 and then it continued much higher on Friday. It got closer to 6,850 mark yesterday. The next resistance level is at 6,870-6,900. On the other hand, support level is at 6,800-6,820, among others. The Nasdaq futures contract gets closer to resistance level of around 6,850, as the 15-minute chart shows:
Big Cap Tech Stocks Pausing
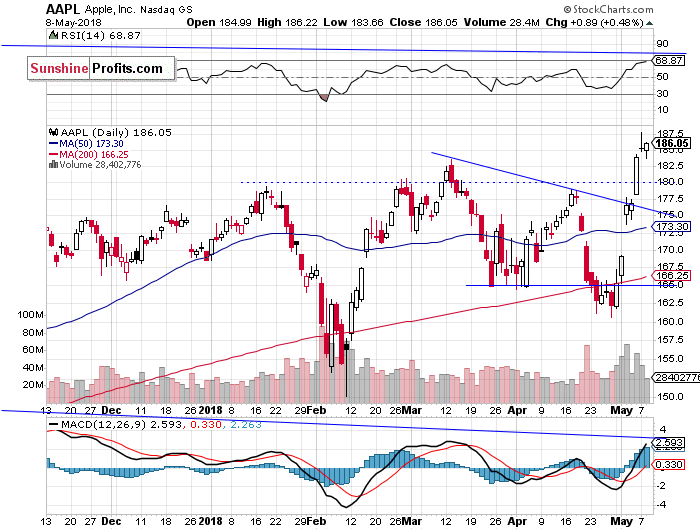
Let's take a look at Apple, Inc. stock (AAPL) daily chart (chart courtesy of http://stockcharts.com). It reached new record high on Monday, and we saw some profit-taking action yesterday. There have been no confirmed negative signals so far. But will it continue even higher? Potential resistance level is at $190-200. On the other hand, support level is at $180-185, marked by previous high:
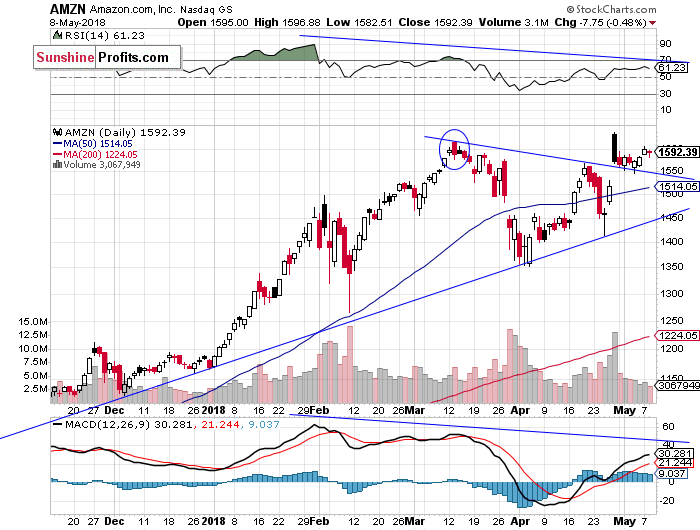
Now let's take a look at Amazon.com, Inc. stock (AMZN) daily chart. The price reached new record high more than a week ago on Friday, as investors reacted to better-than-expected quarterly earnings release. Then, on the same day it sold off below $1,600. Is this a downward reversal or just correction following breakout higher? For now, the price remains above positive medium-term triangle continuation pattern:
Dow Jones Continues Sideways
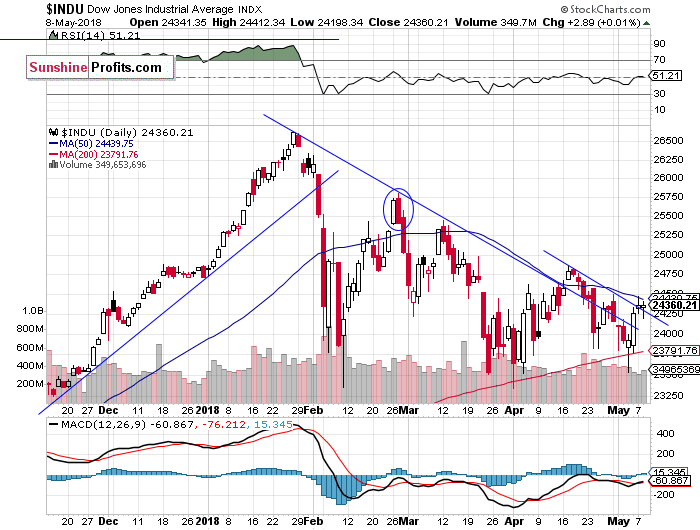
The Dow Jones Industrial Average broke above its medium-term downward trend line recently. It extends the consolidation below resistance level of around 24,800-25,000. Will the blue-chip index resume its uptrend after a downward correction? The support level remains at around 23,800-24,000. We can see a few-week-long downward trend line. The index broke higher, so it may continue towards the above-mentioned 25,000 mark:
The broad stock market extends its medium-term consolidation following the early February sell-off. Just like we wrote in our several Stocks Trading Alerts, the early February sell-off set the negative tone for weeks or months to come. Stocks rallied on better-than-expected big cap tech companies' earnings releases recently, but they came back lower after Wednesday's FOMC Statement release. They resumed their uptrend on Friday, following monthly jobs data release, Apple's stock price rally. The market continued higher on Monday, and it is likely to extend the uptrend today. It still looks like a flat correction within a medium-term downtrend.
Concluding, the S&P 500 index will probably extend its short-term uptrend today. Will it break above the resistance level of around 2,700? Probably not. We may see some fluctuations after opening higher. There have been no confirmed negative signals so far.
Currently, we prefer to be out of the market, avoiding low risk/reward ratio medium-term trades. We will let you know when we think it is safe to get back in the market.
To summarize: no medium-term positions are justified from the risk/reward perspective at this moment.
Intraday trade:
No intraday position is justified from the risk/reward perspective today.
No medium-term position is justified from the risk/reward perspective at this moment.
Thank you.
Paul Rejczak
Stock Trading Strategist
Stock Trading Alerts

