

Briefly:
Intraday trade: The S&P 500 gained 1.2% on Monday, after opening 0.5% higher. The market will probably open virtually flat today. It may extend the short-term uptrend. However, we may see a profit-taking action at some point.
Trading position (short-term; our opinion): no positions are justified from the risk/reward perspective.
Our short-term outlook is neutral, and our medium-term outlook is neutral:
Short-term outlook (next 1-2 weeks): neutral
Medium-term outlook (next 1-3 months): neutral
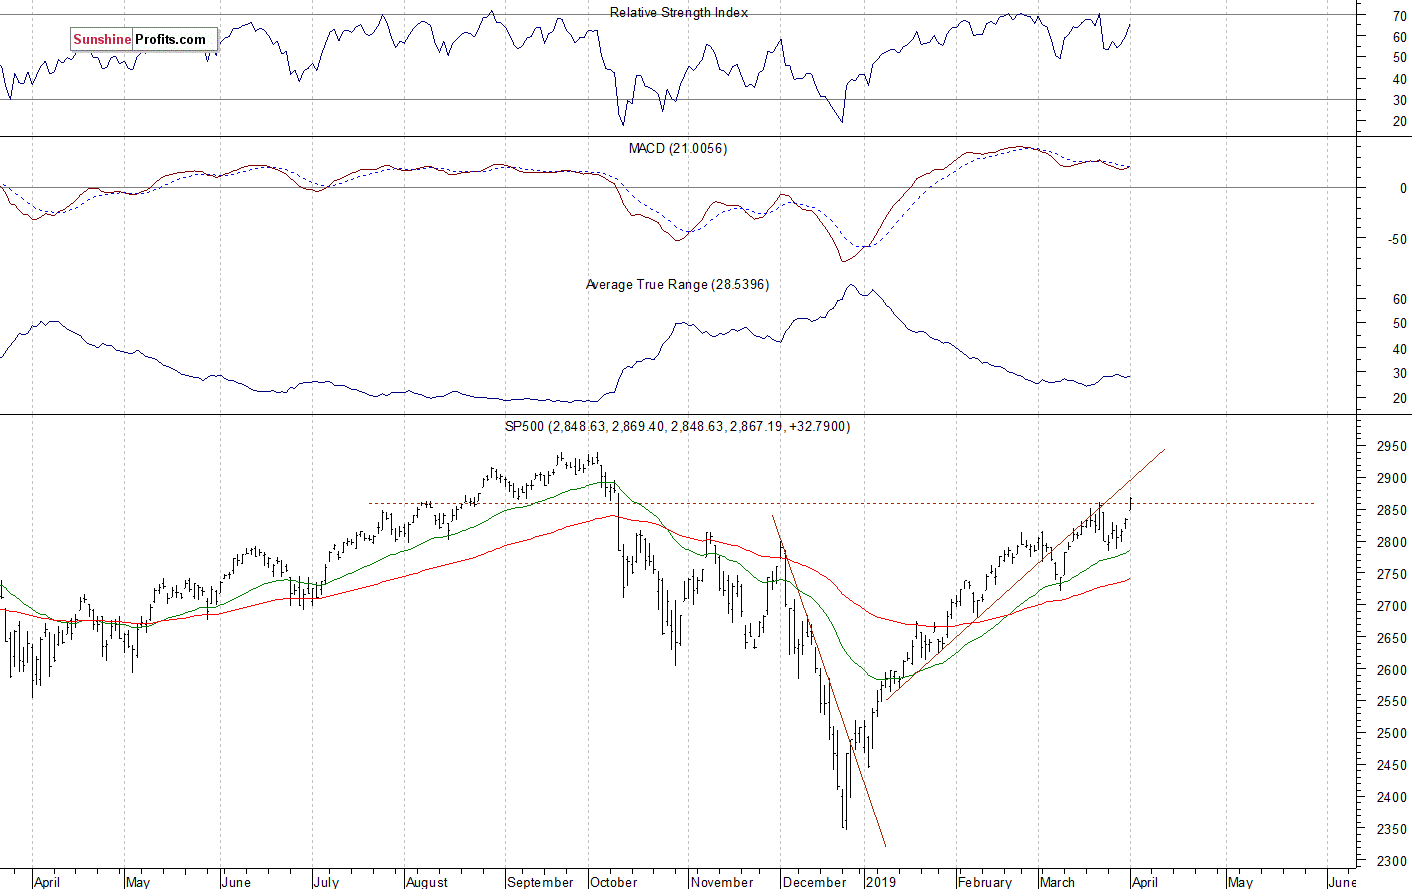
The U.S. stock market indexes gained 1.2-1.3% on Monday, extending their short-term uptrend, as investors’ sentiment remained bullish following better-than-expected economic data releases. The S&P 500 index retraced more of its October-December downward correction of 20.2%. The broad stock market's gauge is now just 2.5% below September the 21st record high of 2,940.91. Both the Dow Jones Industrial Average and the Nasdaq Composite gained 1.3% on Monday.
The nearest important resistance level of the S&P 500 index is now at 2,890-2,900, marked by some early October local highs. The next resistance level is at 2,920-2,940, marked by the mentioned record high, among others. On the other hand, the support level is now at 2,835-2,845, marked by the yesterday’s daily gap up of 2,836.03-2,848.63. The support level is also at around 2,820, marked by Friday’s daily low.
The broad stock market retraced all of its December sell-off and it broke above the medium-term resistance level of around 2,800-2,820, marked by the October-November local highs recently. So is it still just a correction or a new medium-term uptrend? The market broke above the 61.8% Fibonacci retracement of the 20% decline. And we may see an attempt at getting back to the record highs. There have been no confirmed negative medium-term signals so far. The index gets closer to its last October all-time high, as we can see on the daily chart:
Mixed Expectations Following Yesterday’s Rally
Expectations before the opening of today's trading session are virtually flat, because the index futures contracts trade along their Monday's closing prices. The European stock market indexes have gained 0.3-0.7% so far. Investors will wait for the Durable Goods Orders number release at 8:30 a.m. The broad stock market will likely trade within a short-term consolidation today. We can see some short-term technical overbought conditions. However, there have been no confirmed negative signals so far.
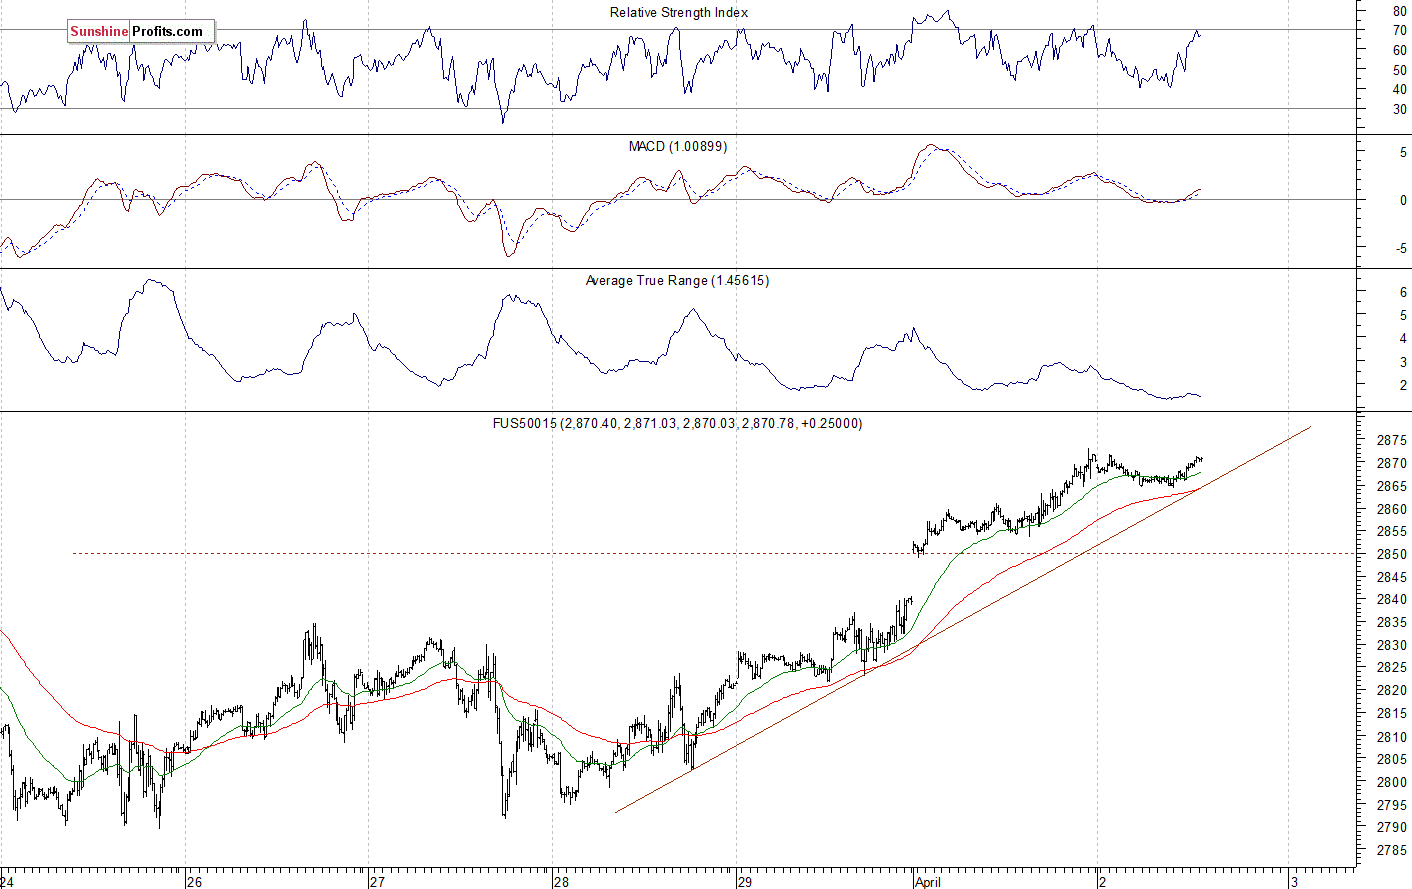
The S&P 500 futures contract trades within an intraday uptrend, as it gets closer to an overnight local high. The nearest important resistance level is at around 2,870-2,875. On the other hand, the support level is at 2,850-2,860, among others. The futures contract remains above the four-day-long upward trend line, as the 15-minute chart shows:
Nasdaq Still Close to 7,500
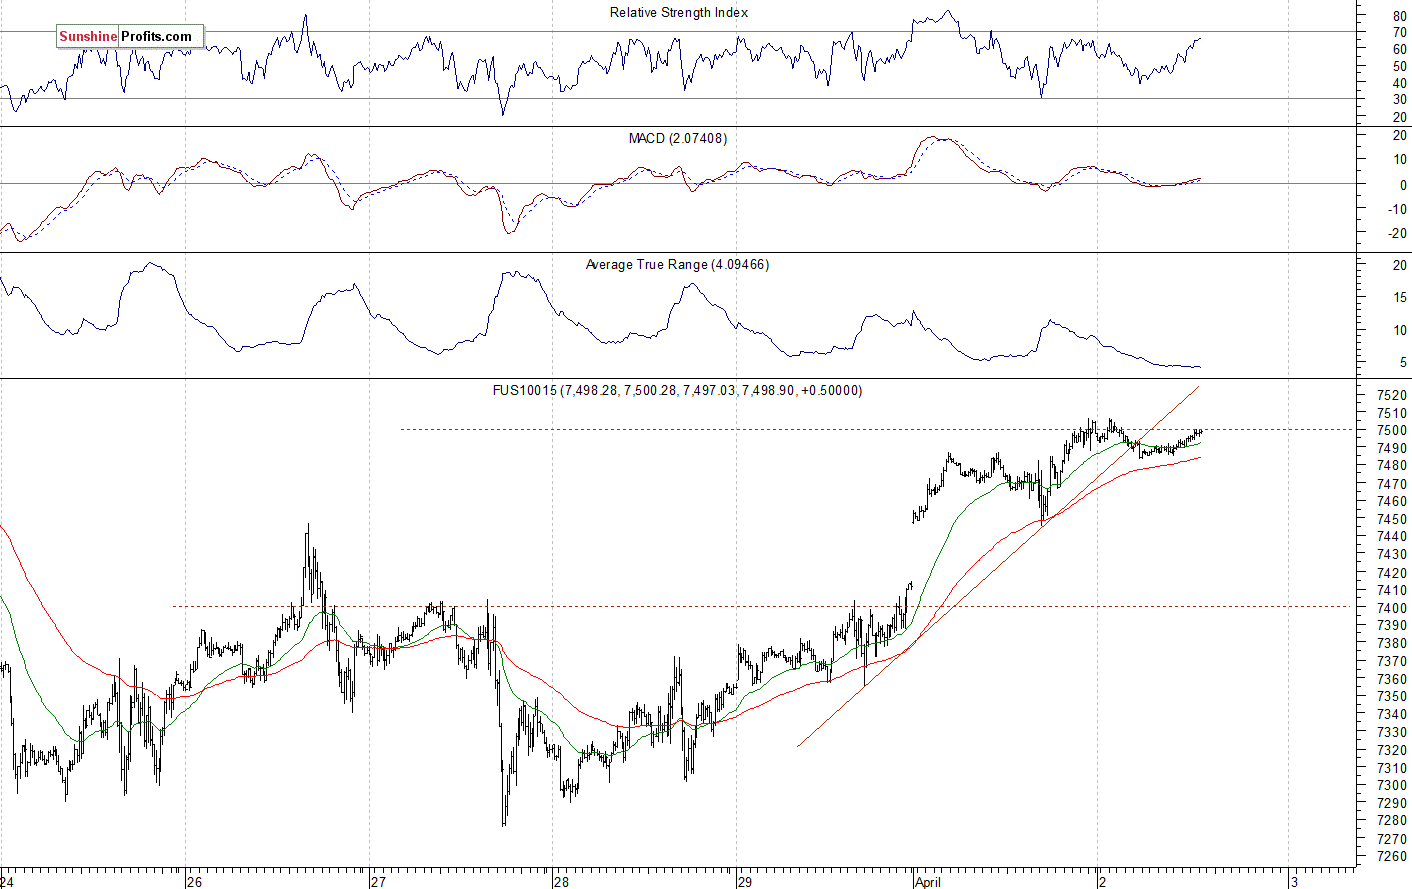
The technology Nasdaq 100 futures contract follows a similar path, as it trades within an intraday uptrend. The market rallied more than 1,700 points from December the 26th local low of around 5,820. But then it fell more than 250 points from the local high of around 7,540. It continues to trade below the recent local high, so it is relatively weaker than the broad stock market. The nearest important resistance level is at 7,500-7,550. On the other hand, the support level is at 7,400-7,450. The Nasdaq futures contract remains close to the 7,500 mark this morning, as we can see on the 15-minute chart:
Apple, Amazon – Quite Bullish
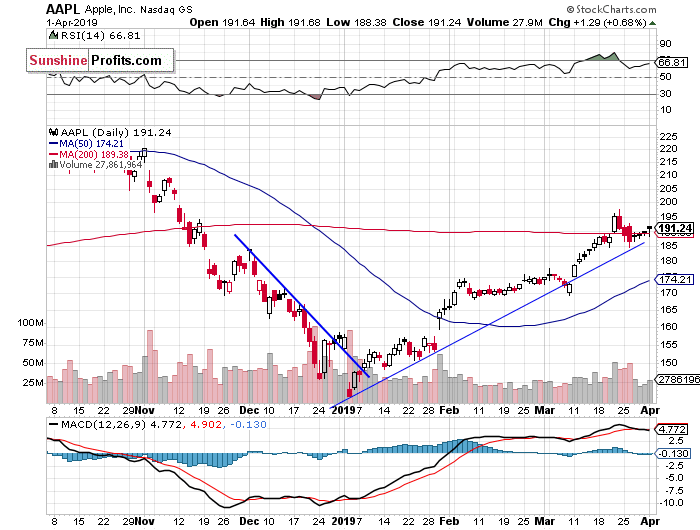
Let's take a look at the Apple, Inc. stock (AAPL) daily chart (chart courtesy of http://stockcharts.com). The market broke above its recent local highs more than a week ago and then it continued above the $180 level. The stock accelerated the uptrend and it traded within a resistance level of $190-200. But then it reversed its upward course. For now, it looks like a correction following the recent advances:
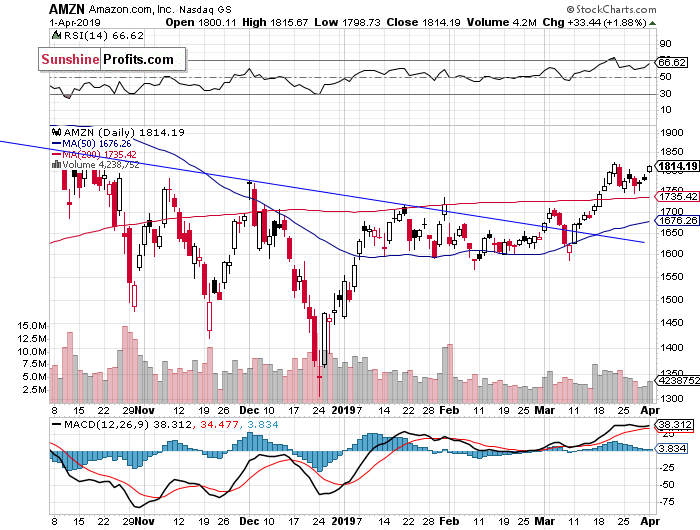
Now let's take a look at the daily chart of Amazon.com, Inc. (AMZN). The price broke above the $1,800 level recently. However, then it fluctuated slightly lower. Yesterday, the price got back above $1,800. If it breaks above the recent local high, we could see more buying pressure:
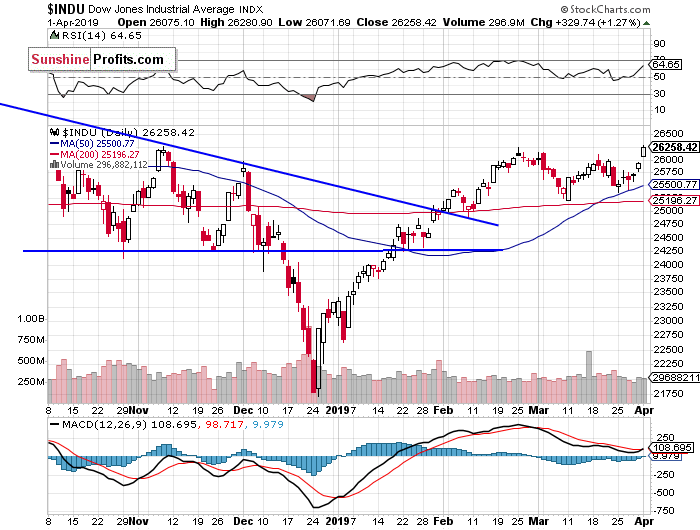
Dow Jones Also Breaking Higher
The Dow Jones Industrial Average traded at its February local high yesterday, as it broke above the 26,000 mark. The blue-chips stocks’ gauge is resuming its medium-term uptrend. The next resistance level is at around 26,800-27,000, marked by the last year’s topping pattern and the record high of 26,951.8:
The S&P 500 index extended its short-term uptrend yesterday, as it got the highest since the early October. We wrote that the recent consolidation looked like a relatively flat correction within a three-month-long uptrend. And we were right. But will the market reach its last year’s record high? There may be some uncertainty, as the S&P 500 gets closer to the 2,900 resistance level.
Concluding, the S&P 500 index will likely open virtually flat today. The market may fluctuate following Friday’s and Monday’s rally. However, there have been no confirmed negative signals so far.
Trading position (short-term; our opinion): no positions are justified from the risk/reward perspective.
Thank you.
Paul Rejczak
Stock Trading Strategist
Sunshine Profits - Effective Investments through Diligence and Care

