

Briefly:
Intraday trade: The S&P 500 index gained 0.8% after opening 0.4% higher on Thursday. The broad stock market will likely open slightly lower today. We may see some more short-term uncertainty. We prefer to be out of the market, avoiding low risk/reward ratio trades.
Trading position (short-term; our opinion): short positions in the S&P 500 Index (opened at the level of 2,810 on July the 30th) with a stop-loss order at 2,875 and the initial downside target at 2,768 are justified from the risk/reward perspective.
Our intraday outlook is neutral. Our short-term outlook is bearish, and our medium-term outlook is neutral:
Intraday outlook (next 24 hours): neutral
Short-term outlook (next 1-2 weeks): bearish
Medium-term outlook (next 1-3 months): neutral
The U.S. stock market indexes gained 0.4-1.6% on Thursday, retracing some of their recent decline, as the Turkey crisis fears diminished. The S&P 500 index got back closer to 2,850 mark. It currently trades 1.1% below the January's 26th record high of 2,872.87. The Dow Jones Industrial Average gained 1.6% and the technology Nasdaq Composite gained just 0.4% yesterday.
The nearest important level of support of the S&P 500 index is now at around 2,825-2,830, marked by yesterday's daily gap up of 2,827.95-2,831.44. The next support level remains at 2,800-2,805, marked by the recent local lows. On the other hand, the level of resistance is at 2,845-2,850, marked by last Friday's daily gap down of 2,842.20-2,851.98. The resistance level is also at 2,860-2,865, marked by the early August local highs.
The broad stock market got close to its January's record high recently, as investors' sentiment improved following quarterly corporate earnings, economic data releases. The S&P 500 index traded within a relatively narrow trading range in the middle of the last week. Then it broke lower on Friday. Was it some medium-term downward reversal or just downward correction before another leg up? There are still two possible medium-term scenarios - bearish that will lead us towards the February low again, and the bullish one - breakout higher towards 3,000 mark. The latter one got very real recently:
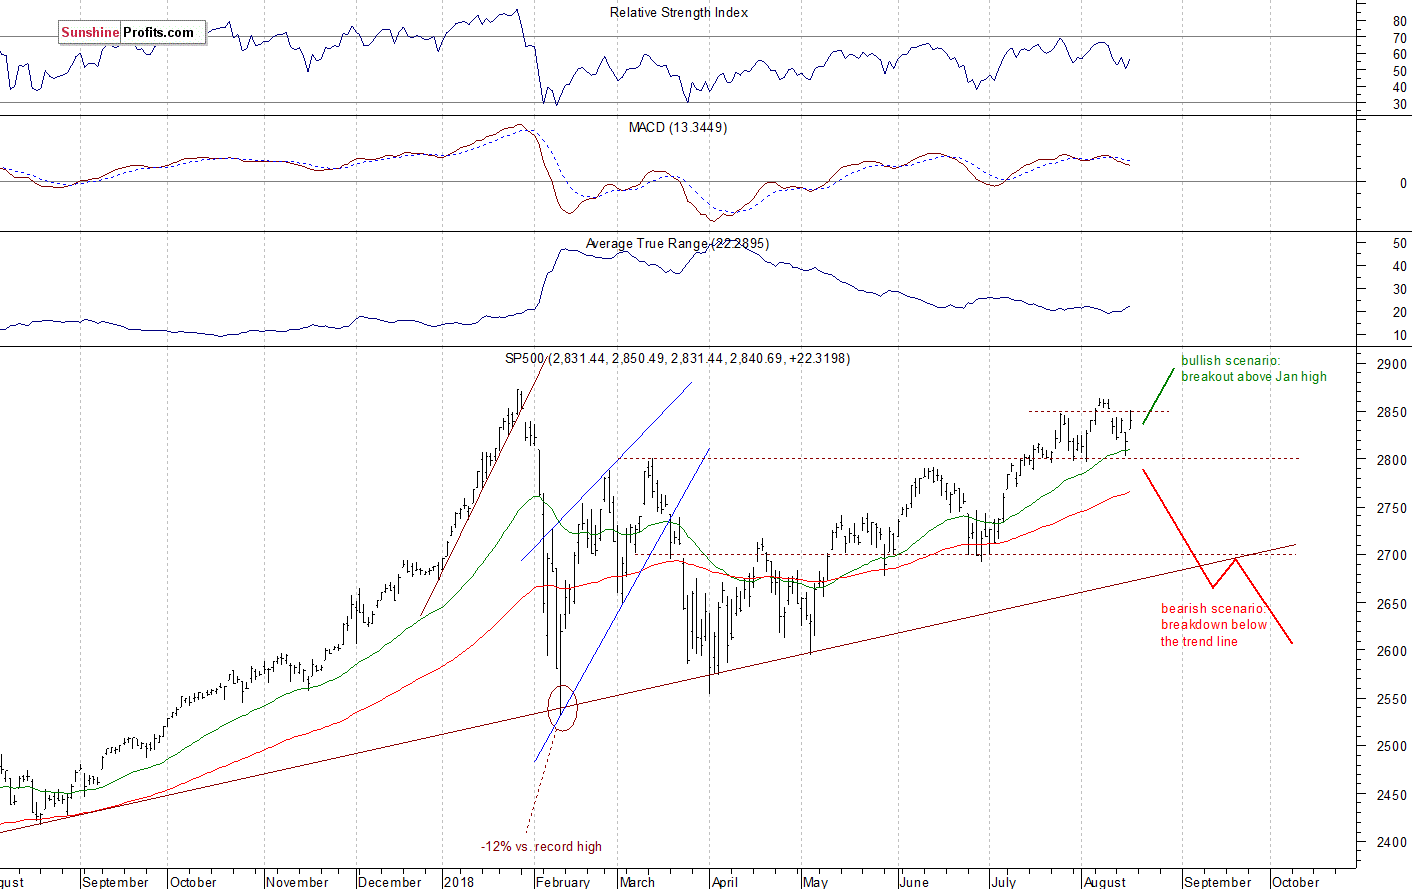
New Uptrend or Just Consolidation?
Expectations before the opening of today's trading session are slightly negative, because the index futures contracts trade 0.1-0.2% lower vs. their Thursday's closing prices. The European stock market indexes have been mixed so far. Investors will wait for some economic data announcements today: Michigan Sentiment number, Leading Indicators at 10:00 a.m. The broad stock market will probably open slightly lower or virtually flat. Then we may see some more short-term fluctuations along the mentioned resistance level of around 2,850.
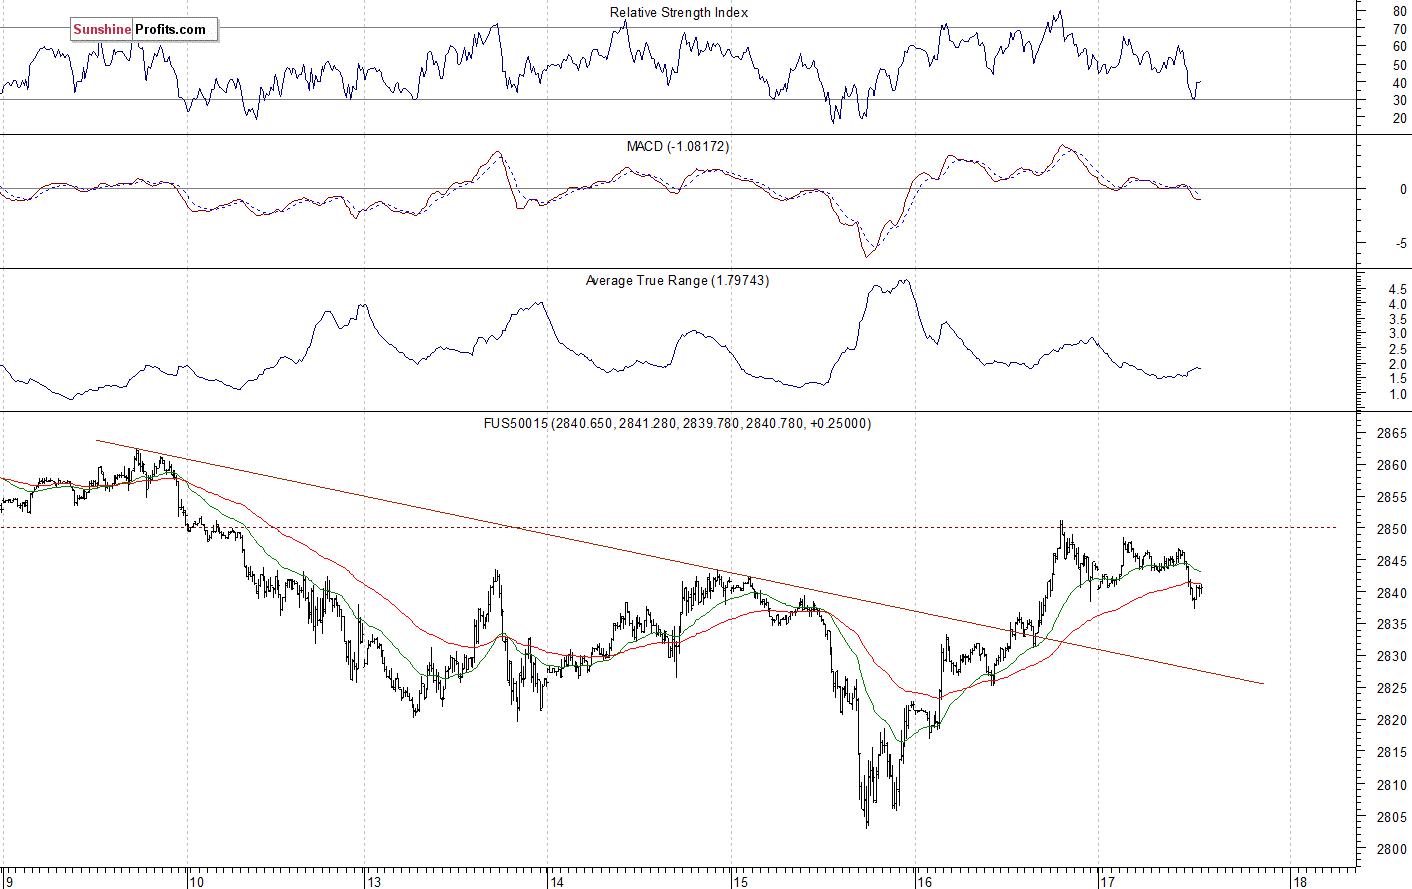
The S&P 500 futures contract trades within an intraday consolidation, as it fluctuates after its yesterday's advance. The nearest important level of resistance is at 2,850, marked by the short-term local highs, among others. On the other hand, the support level is at 2,825-2,830, marked by some recent fluctuations. The futures contract trades close to the short-term resistance level, as we can see on the 15-minute chart:
Nasdaq Relatively Weaker
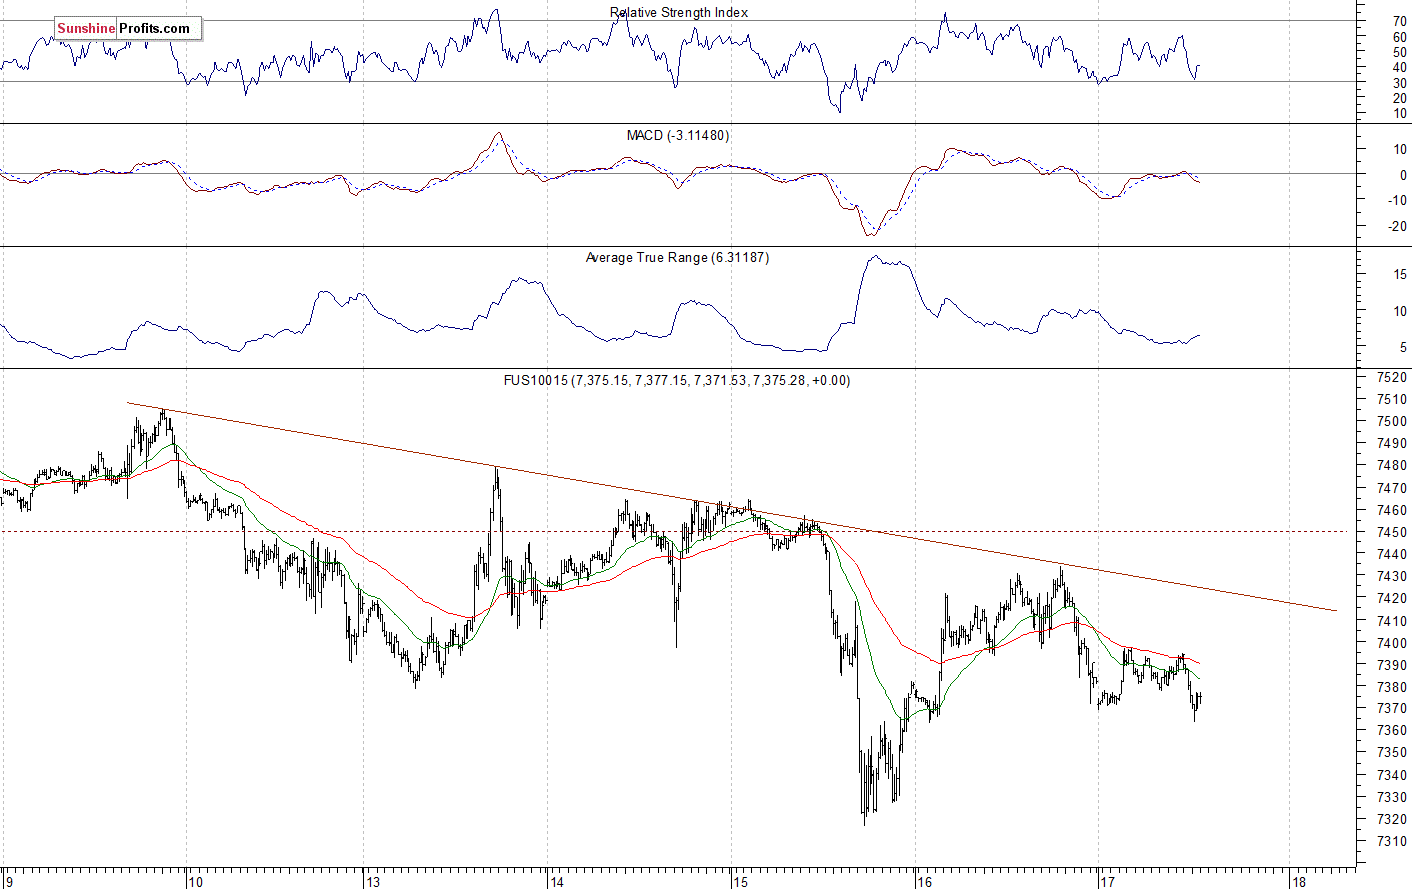
The technology Nasdaq 100 futures contract is relatively weaker than the broad stock market, as it trades below its yesterday's local highs. However, it remains relatively close to the late July record high of around 7,530. The nearest important level of resistance is now at around 7,400-7,430, marked by the recent local highs. The next resistance level is at 7,450-7,470, among others. The Nasdaq futures contract trades below its short-term downward trend line, as the 15-minute chart shows:
Apple, Amazon - Big Cap Tech Stocks' Mixed Picture Again
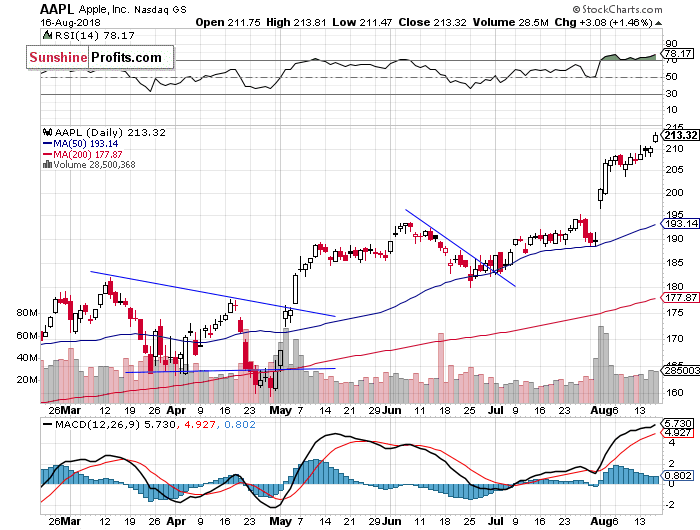
Let's take a look at Apple, Inc. stock (AAPL) daily chart (chart courtesy of http://stockcharts.com). Despite the recent broad stock market weakness, it reached the new record high at the level of $213.81 yesterday. There have been no confirmed negative signals so far. However, we may see a downward correction at some point. The nearest important level of support is now at $205-210, marked by the recent consolidation:
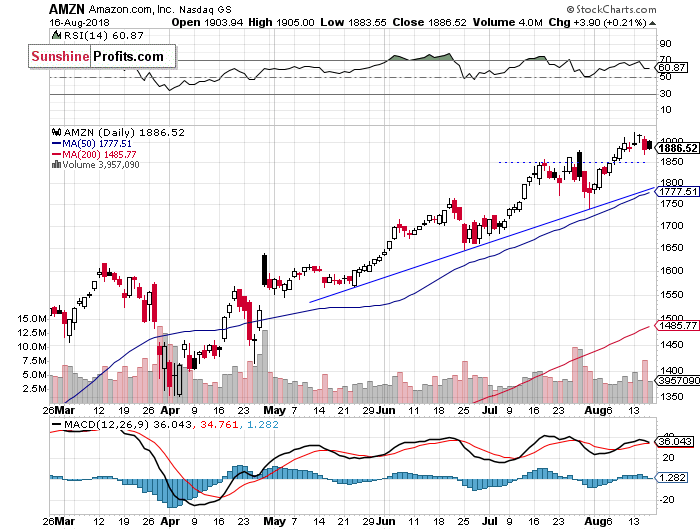
Now let's take a look at Amazon.com, Inc. stock (AMZN) daily chart. It has reached the new record high on Monday at the level of $1,925.00. Since then it traded within a short-term consolidation. The nearest important level of resistance remains at around $1,925. On the other hand, support level is at 1,850. The stock continues to trade above its medium-term upward trend line, as we can see on the daily chart:
Dow Jones Rallies
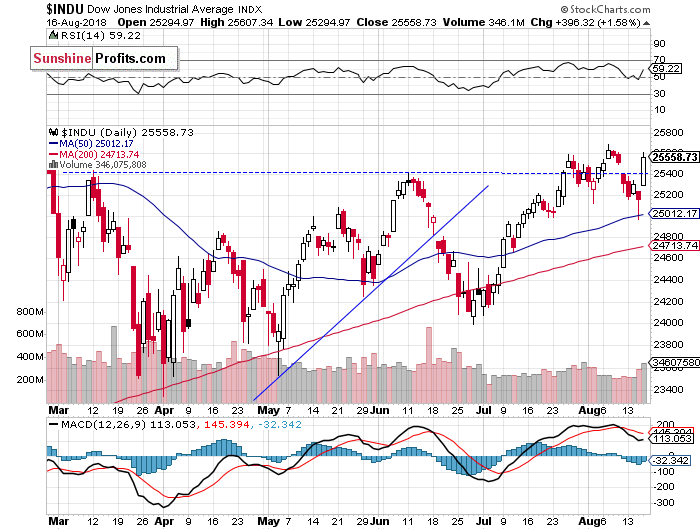
The Dow Jones Industrial Average retraced most of its recent decline yesterday following bouncing off support level of 25,000 on Wednesday. Is this a new uptrend or just short-term consolidation? If the blue-chip stocks' gauge breaks above the resistance level of around 25,600 marked by the recent local high, we could see more buying pressure:
The S&P 500 index bounced off support level of around 2,800 on Wednesday. It was a short-term upward reversal, because the market continued higher yesterday. We may see some more short-term uncertainty, as the index reaches the resistance level of around 2,850.
Concluding, the broad stock market will likely open slightly lower today. We may see a short-term consolidation along the resistance level of around 2,850. For now, it looks like an almost month-long consolidation following the July rally. There are some close resistance levels ahead.
Intraday trade:
No intraday position is justified from the risk/reward perspective today.
Trading position (short-term; our opinion): short positions in the S&P 500 Index (opened at the level of 2,810 on July the 30th) with a stop-loss order at 2,875 and the initial downside target at 2,768 are justified from the risk/reward perspective.
Thank you.
Paul Rejczak
Stock Trading Strategist
Stock Trading Alerts

