

Briefly:
Intraday trade: The S&P 500 index lost 0.4% on Thursday, after opening 0.2% lower. The broad stock market may open slightly lower today, as there seems to be more uncertainty following the earnings releases, trade tariffs announcements. We prefer to be out of the market, avoiding low risk/reward ratio trades.
Medium-term trade: In our opinion, no medium-term positions are justified.
Our intraday outlook is neutral. Our short-term outlook is neutral, and our medium-term outlook is neutral:
Intraday outlook (next 24 hours): neutral
Short-term outlook (next 1-2 weeks): neutral
Medium-term outlook (next 1-3 months): neutral
The U.S. stock market indexes lost 0.4-0.5% on Thursday, as investors took short-term profits off the table following the recent advance. The S&P 500 index index remains close to the level of 2,800 and it continues to trade along its previous months' local highs. The broad stock market index is 2.4% below the January's 26th record high of 2,872.87. The Dow Jones Industrial Average lost 0.5% and the technology Nasdaq Composite lost 0.4% on Thursday.
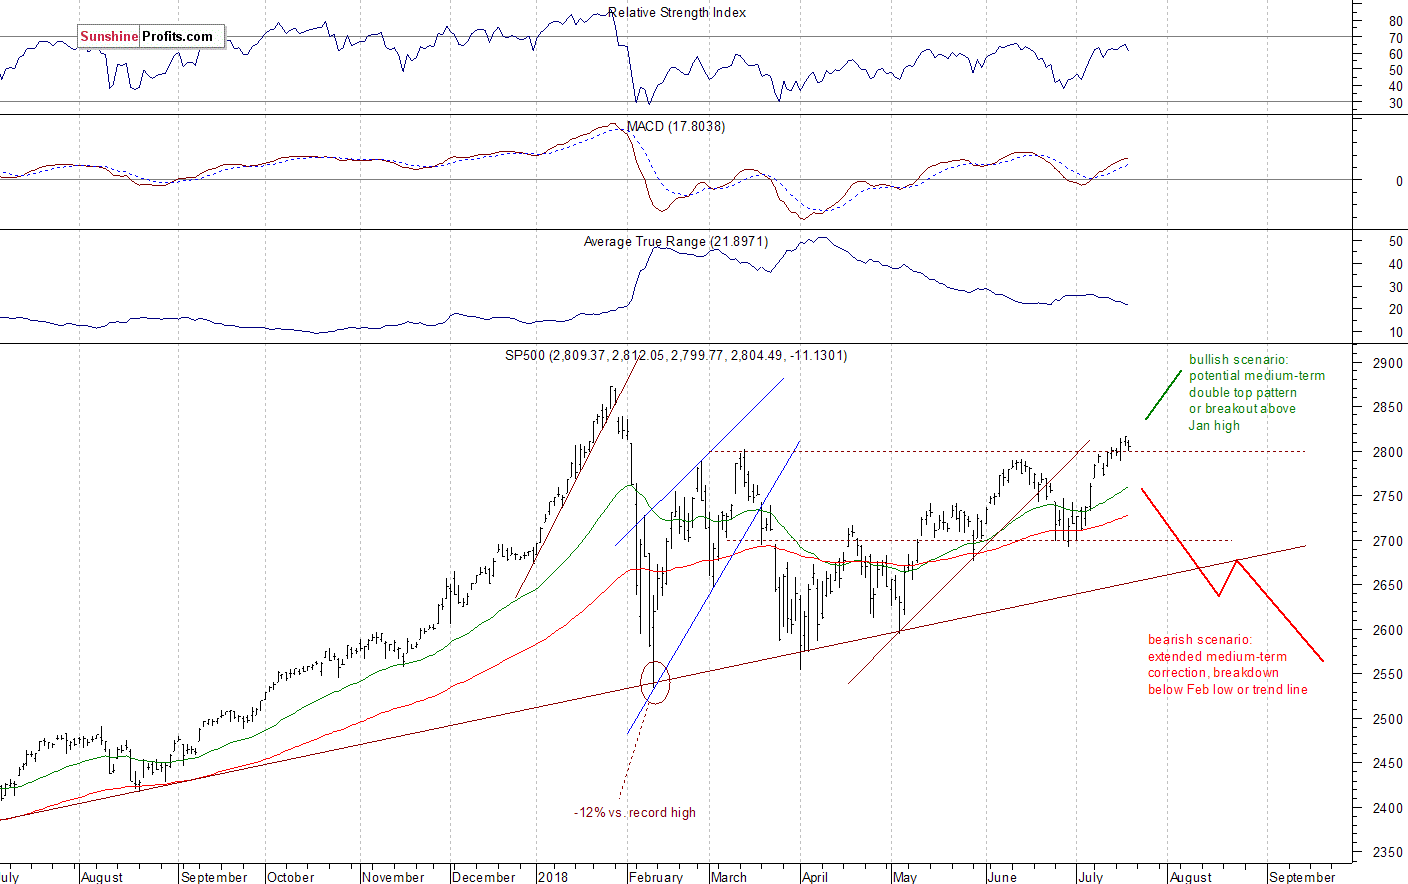
The nearest important level of support of the S&P 500 index remains at around 2,790-2,800, marked by the previous resistance level. The next level of support is at 2,780-2,785, marked by the recent local lows. The support level is also at 2,765-2,770, marked by last week's Wednesday's local low along with last week's Monday's daily gap up of 2,764.41-2,768.51. On the other hand, the resistance level is now at 2,815-2,820, marked by the local high. The resistance level is also at 2,835-2,850, marked by January the 30th daily gap down of 2,837.75-2,851.48.
The broad stock market extended its short-term uptrend this week, as the S&P 500 index reached the new local high above the level of 2,815. It got closer to the January topping pattern of around 2,840-2,870. Will it continue towards new record highs? There are still two possible medium-term scenarios - bearish that will lead us below the February low following trend line breakdown, and the bullish one in a form of medium-term double top pattern or a breakout towards 3,000 mark. The latter one is getting more and more real. The S&P 500 index seems to be "climbing a wall of worries" here:
Long-term Picture
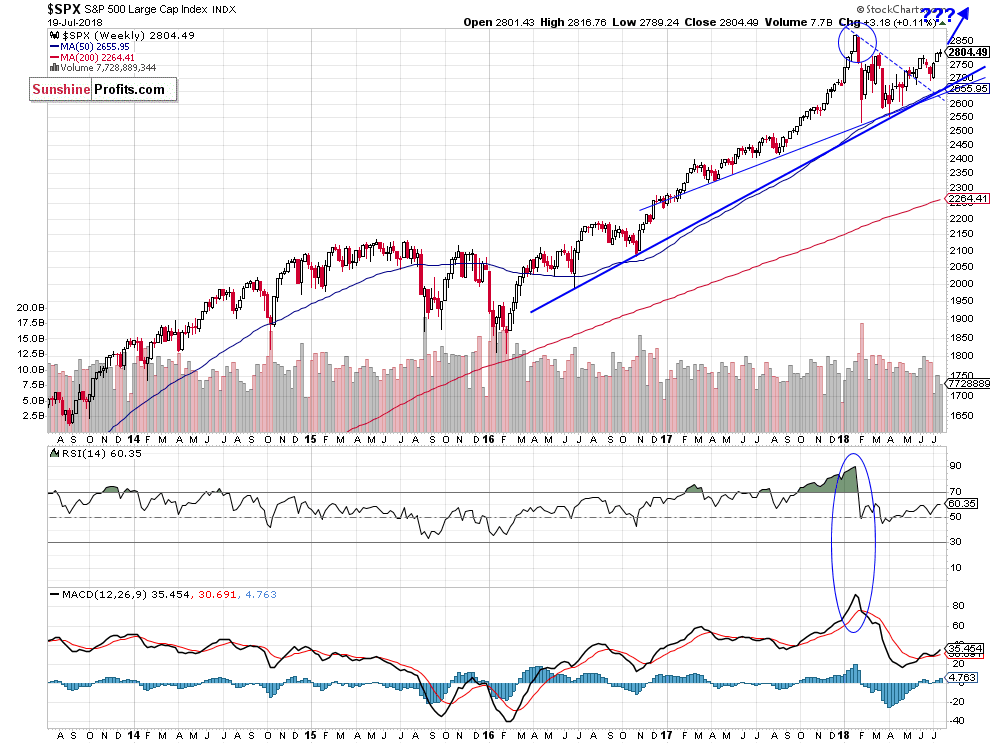
Let's take a look at the weekly chart of the S&P 500 index. We can see the market bouncing off its upward trend lines and the moving average in the first half of the year. So was this half-year-long consolidation just a correction within a long-term uptrend? The broad stock market may continue upwards, but it could be the last leg within the bull market, because it would likely lead to some very negative technical divergences following the January's euphoria-run:
Uncertainty Along 2,800
Expectations before the opening of today's trading session are negative, because the index futures contracts trade between -0.1% and -0.4% vs. their yesterday's closing prices. The European stock market indexes have lost 0.3-0.7% so far. There will be no new important economic data announcements today. Investors will wait for more quarterly earnings releases. The S&P 500 index will probably continue to fluctuate along the level of 2,800. There have been no confirmed negative signals so far. It looks like some relatively flat correction within an uptrend. However, if the index breaks below 2,800 mark again, we could see more short-term selling pressure.
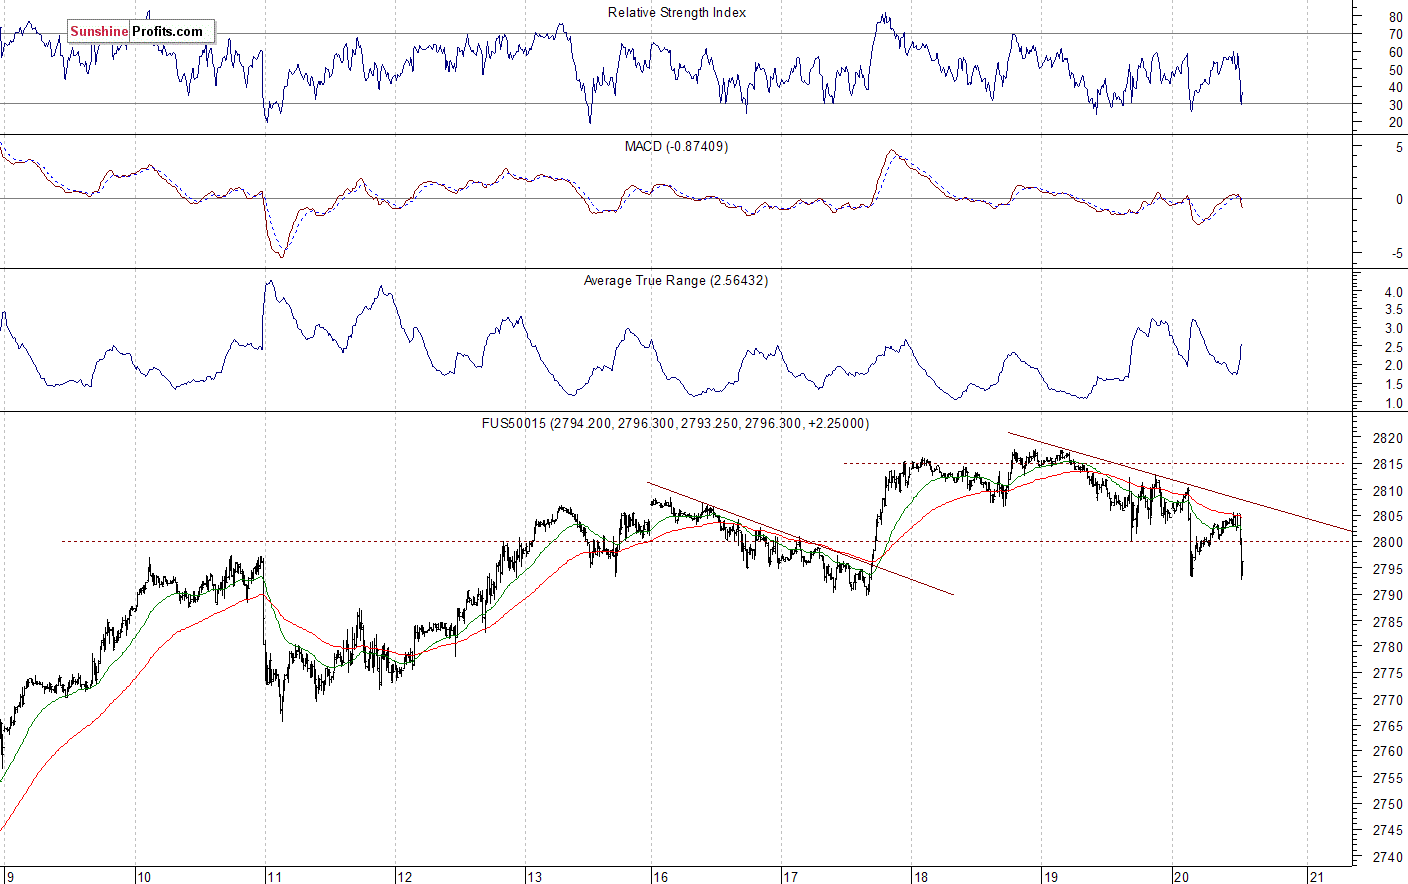
The S&P 500 futures contract trades within an intraday downtrend, as it retraces its short-term bounce. It trades below the level of 2,800. Is this a quick downward correction or a new downtrend? The nearest important level of resistance is at around 2,810, marked by some local highs. On the other hand, support level is at 2,790-2,795, among others. The futures contract extends its short-term consolidation, as we can see on the 15-minute chart:
Nasdaq Still Close to Record High
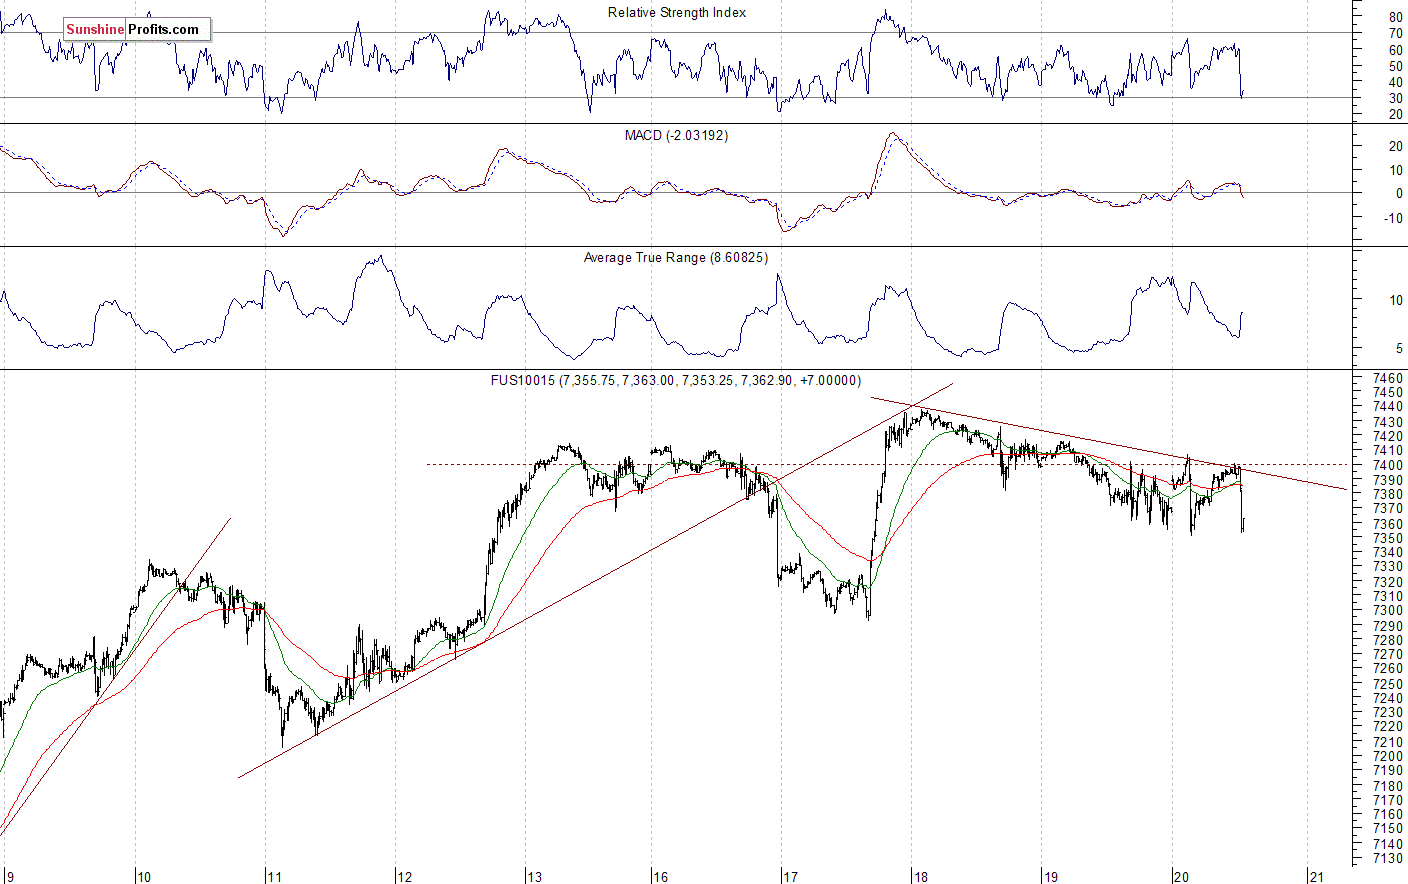
The technology Nasdaq 100 futures contract follows a similar path, as it bounces off 7,400 mark. It is currently closer to support level of 7,300-7,350. The market remains relatively close to its Wednesday's record high. The nearest important level of resistance is at 7,400-7,440. The Nasdaq futures contract trades below its over two-day-long downward trend line this morning:
Big Cap Tech Stocks - Mixed Picture Again
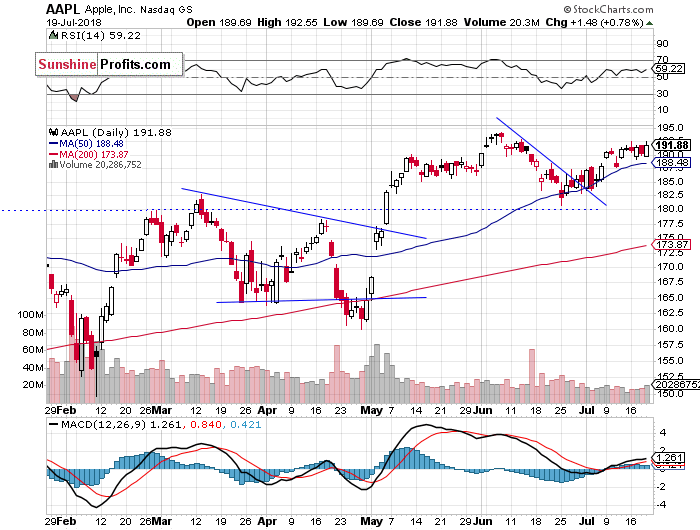
Let's take a look at Apple, Inc. stock (AAPL) daily chart (chart courtesy of http://stockcharts.com). The stock slightly extended its advance recently, but it continues to trade at the resistance level of around $190-195. On the other hand, support level remains at around $185, marked by the previous level of resistance:
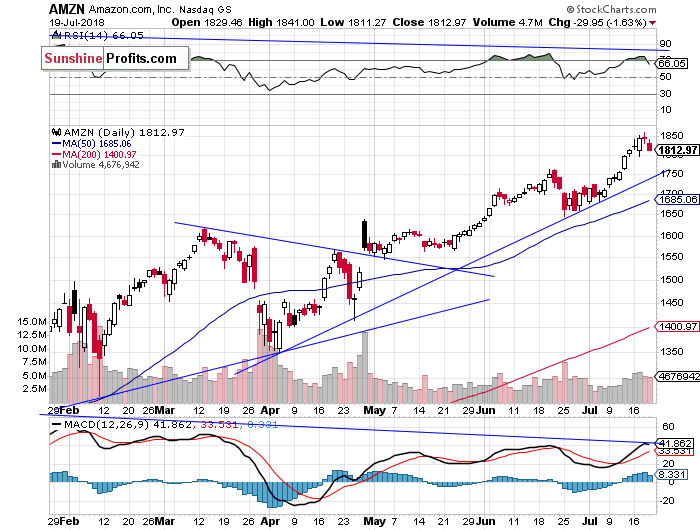
Now let's take a look at Amazon.com, Inc. stock (AMZN) daily chart. It reached the new record high of $1,858.88 on Wednesday, but then it retraced some of its recent advance. We still can see negative medium-term technical divergences. Will they lead to a downward reversal? There is an upward trend line at around $1,750. If the stock breaks below that line, then it would likely retrace more of the medium-term rally:
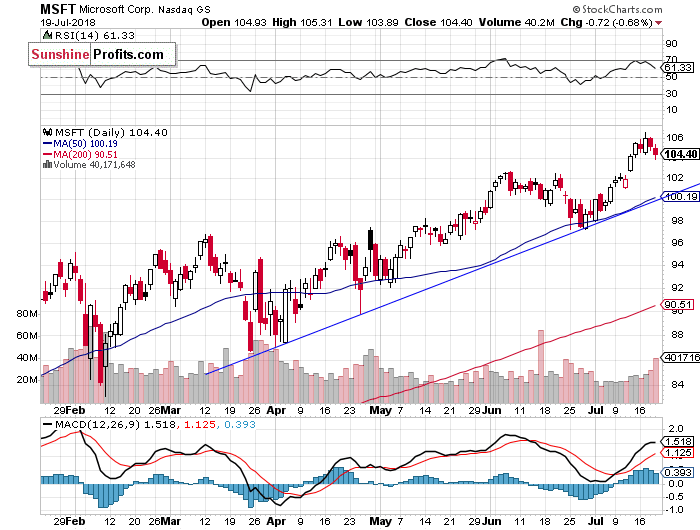
Microsoft Corp. stock (MSFT) is likely to reach the new record high at the opening of today's trading session following yesterday's quarterly earnings release. However, we can see some medium- and long-term technical overbought conditions. Will the bull run continue? The nearest important level of support is at the price of $100:
Dow Jones Still Below Its June High
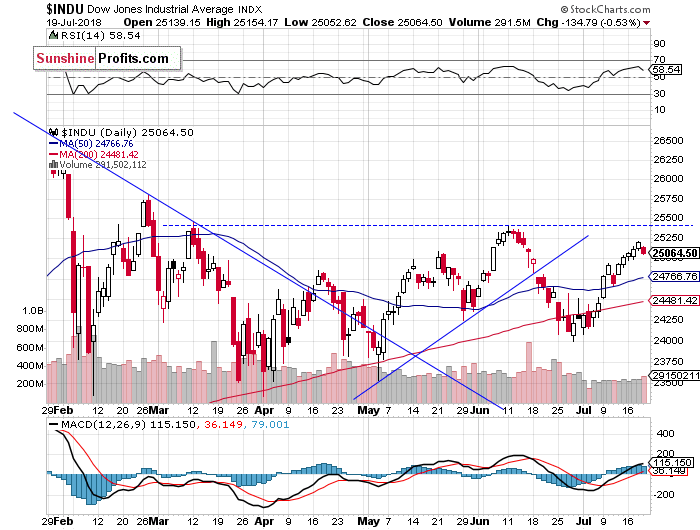
The Dow Jones Industrial Average retraced some of its recent advance yesterday, but it continued to trade above the level of 25,000. The blue-chip stocks' gauge remains below its June local high, so it is still relatively weaker than the broad stock market. There have been no confirmed negative signals so far. But will the index break higher at some point? It's hard to say. For now, it looks like a medium-term consolidation:
The S&P 500 index continued to trade along the level of 2,800 on Thursday, as it retraced some of its recent advance. For now, it looks like a correction within an uptrend. There have been no confirmed negative signals so far. But will stocks continue higher? There will be more big cap companies' quarterly earnings releases next week and they may drive stock prices higher. Unless there are more negative trade tariffs' news releases..
Concluding, the broad stock market will likely open virtually flat today. We may see some more short-term uncertainty along the level of 2,800. It will be all about the quarterly earnings releases next week. But there are also the ongoing trade war worries.
Currently, we prefer to be out of the market, avoiding low risk/reward ratio medium-term trades. We will let you know when we think it is safe to get back in the market.
To summarize: no medium-term positions are justified from the risk/reward perspective at this moment.
Intraday trade:
No intraday position is justified from the risk/reward perspective today.
No medium-term position is justified from the risk/reward perspective at this moment.
Due to a holiday break, beginning from Monday, July the 23rd until Friday, August the 3rd, there will be no Stock Trading Alerts. We apologize for inconvenience.
Thank you.
Paul Rejczak
Stock Trading Strategist
Stock Trading Alerts

