

“Other than my Cincinnati Bengals breaking my heart, few things are more consistent than stocks higher in April.”
As a stock nerd and NFL fan, I love this quote from Ryan Detrick, the chief market strategist at LPL Financial.
Historically in April, the S&P 500 has seen gains in 14 of the past 15 years. April has also been the strongest month for stocks over the past 20 years.
April 2021 has been no exception. Although March, and Q1, for that matter, ended with more questions than answers, this month has been nothing but white-hot.
The month kicked off with a blowout jobs report. It then continued with two consecutive weeks of jobless claims crushing estimates, retail sales coming in almost ⅓ higher than projected, and bank earnings blowing past forecasts. The Dow Jones and S&P 500 seemingly hit fresh record-highs every other day, and despite complications with JnJ’s one-dose vaccine, all signs point towards our life returning to normal by this summer.
While optimism is high right now, I implore you to remain cautious. I’m really not sure how much higher the Dow and S&P can go without pulling back somewhat. Not to mention, it still has not been smooth sailing for Cathie Wood stocks or SPACs for the last two months either. This rotation into recovery names is very real.
Remember that every month in 2021 thus far has started off hot and saw a pullback and volatility occur by the second half of the month.
We are now officially in the latter half of April. Although, as I said, April is historically a strong performing month, think about this. By the second half of January, we had Reddit trades spooking investors. In February and March, we had surging bond yields, inflation fears, or Jay Powell comments that rubbed people the wrong way. These concerns won’t just disappear because we want them to. If we could make things magically disappear, COVID would’ve been over yesterday.
According to Binky Chadha, Deutsche Bank’s chief U.S. equity strategist, we could see a significant pullback between 6% and 10% over the next three months because of potentially full valuations and inflation fears. Even if this $2 trillion infrastructure plan doesn’t pass in full, do we really need to spend any more trillions with an economy starting to turn red hot?
Plus, how do you think this will be paid for? Hiking taxes- namely corporate taxes. Those gains that high growth stocks saw after Trump cut corporate taxes in 2017 could very well go away. While President Biden has indicated a willingness to negotiate his 28% corporate tax proposal, it’s still a tax hike.
My goal for these updates is to educate you, give you ideas, and help you manage money like I did when I was pressing the buy and sell buttons for $600+ million in assets. I left that career to pursue one to help people who needed help instead of the ultra-high net worth.
With that said, to sum it up:
We’re hot right now.
However, we could see more volatility and more muted gains than what we’ve come to know over the last year.
April is historically strong, but please monitor overvaluation, inflation, bond yields, and potential tax hikes. Be optimistic but realistic. A decline above ~20%, leading to a bear market, appears unlikely. Yet, we could eventually see a minor pullback by the summer, as Deutsche Bank said.
Hopefully, you find my insights enlightening. I welcome your thoughts and questions and wish you the best of luck.
Russell 2000- Still Buyable?
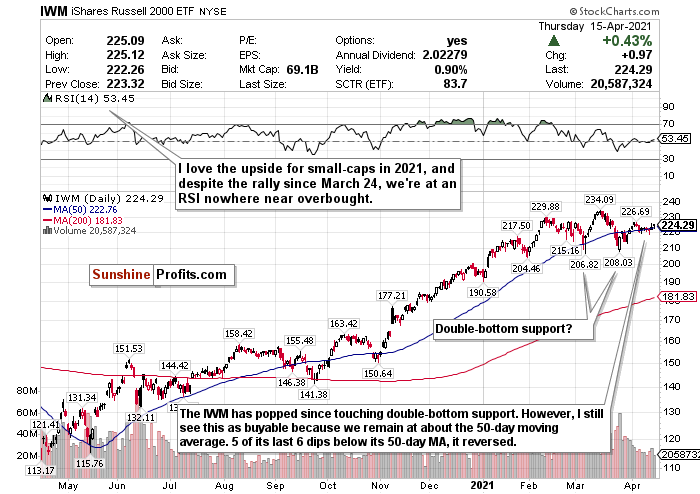
Figure 1- iShares Russell 2000 ETF (IWM)
Although the iShares Russell 2000 ETF (IWM) has outperformed all the other index-tracking ETFs in 2021 to the tune of 16.13%, it has been a relative laggard in April. My thoughts? Good.
I proudly switched my call on the iShares Russell 2000 ETF (IWM) to a BUY on March 24, and since then, we’ve risen over 5%.
I still feel like we’re very buyable at this level. Aggressive stimulus, friendly policies, and a reopening world bode well for small-caps in 2021. I think this is something you have to consider for the Russell 2000 and maybe overpay for.
The RSI is still hovering around 53. I also checked out the chart and noticed that almost every time the IWM touched or minorly declined below its 50-day moving average, it reversed.
Excluding the recovery last April from the great coronavirus crash, 5 out of the previous 6 times the Russell did this with its 50-day, it saw a sharp reversal. The only time it didn’t was in October 2020, when the distance between its 50-day and its 200-day moving average was a lot more narrow.
Fast forward to now. The Russell 2000, despite its gains since tanking on March 23, remains right at about its 50-day moving average. Until it moves significantly above this level, in my eyes, it’s buyable.
Based on the chart and macro-level tailwinds, I feel that you can still BUY this index. In fact, I think that it’s the most buyable of them all.
Nasdaq- What a Comeback
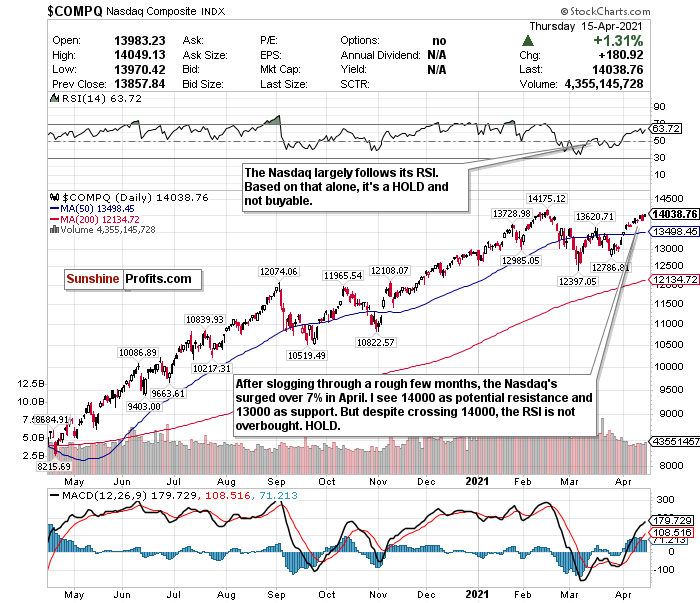
Figure 2- Nasdaq Composite Index $COMP
Has all that fear about tech stocks been overblown?
I still have concerns about high-flying growth stocks, and it’s been an up-and-down 2 months for many Cathie Wood-like disruptors and tech-focused SPACs.
However, I proudly bought the Nasdaq dip when I switched my call to a BUY on February 24. While I don’t feel that we’re anywhere near a buy-level any longer for the Nasdaq, the Nasdaq-tracking Invesco QQQ ETF (QQQ) is up over 5.5% since February 24. It has also been the top-performing index-tracking ETF in April and is up over 7% since March 31.
Needless to say, if you bought tech’s dip, it worked out very well for you.
But, out of all the indices, the Nasdaq concerns me the most. I use the RSI as my primary Nasdaq guide, 13000 as my support level, and 14000 as a potential resistance level. We have crossed the 14000-level for the first time since February; however, the RSI is still not relatively high enough for me to consider it overbought.
Taking these technical factors into consideration, the Nasdaq is a firm HOLD right now. But we may be nearing SELL territory. I remain concerned about not only inflation and bond yields but the prospects of corporate tax hikes.
If any more tech stocks, namely SPACs, go public, I may lose my mind too. A different IPO or SPAC enters the market on what seems to be an almost weekly basis now. It’s comparable to the dot-com bust, and I don’t like it one bit. If this trend continues, we could see oversupply in the market and a shortage in demand. That is terrible news for growth stocks.
I remain bullish on tech sectors like cloud computing, e-commerce, and fintech. While this rally has been fun, I’m actually more concerned now than I was several weeks ago when the Nasdaq lagged.
So is the curse of being somewhat contrarian.
HOLD, and see what happens over the next few weeks. Monitor the infrastructure bill, tax hikes, and IPO/SPAC market. Research emerging tech sectors and high-quality companies.
Can the S&P Touch 4500 by the End of the Month?
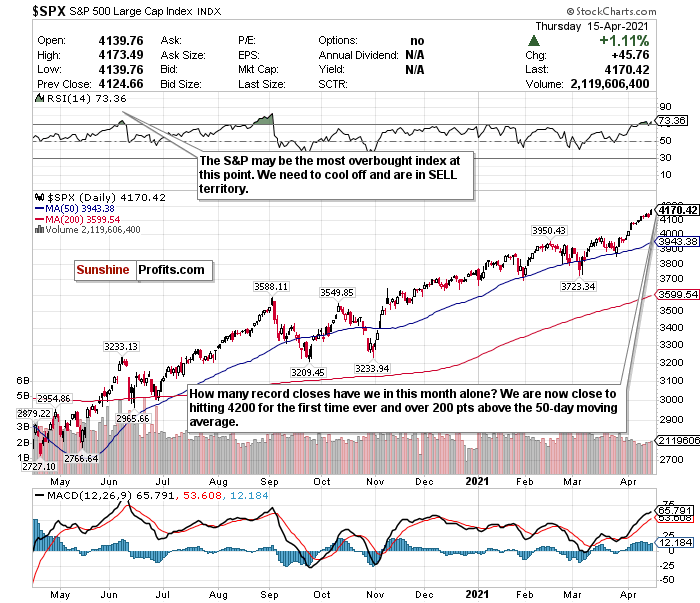
Figure 3- S&P 500 Large Cap Index $SPX
On the one hand, according to Sanford C. Bernstein strategists, the S&P 500 index could double by the end of the decade and reach 8,000.
Historically, we could really be at a strong entry point for the long-term too. Over two weeks ago, we marked the first anniversary of this bull market. Historically, S&P 500 bull markets since 1957 on average resulted in price gains of 179% and lasted an average of 5.8 years.
Because the S&P has risen just about 86.4% since March 23, 2020, if history tells us anything, we may just be getting started.
It’s also April, historically the strongest month for stocks.
On the other hand, the S&P 500 continues shattering its record highs and is approaching 4200 for the first time in its history. It’s also potentially historically overvalued.
I don’t see this as a buyable index at the moment. In fact, I see it as a sellable index. I’d prefer a dip below the 50-day moving average before even thinking about buying, and even that level is still overvalued.
The RSI is also above 73, which may make it the most overbought index of the bunch right now.
All of the ingredients are in place for the S&P to potentially touch 4500 by the end of the month; I won’t deny that. Earnings season is off to a strong start. However, I’m more worried about valuations than I am excited about earnings.
SELL. The S&P has skyrocketed to unprecedented levels and valuations. For an ETF that attempts to directly correlate with the performance of the S&P 500, the S&P 500 SPDR ETF (SPY) is a great option.
Beware of Inflation
Ugh. That’s all I have to say about this.
I’m not trying to scare anyone, but being realistic. We’re already experiencing inflation.
I filled up gas the other day and almost broke my side-view mirror out of anger. Gas prices have surged by nearly 25% from this point last year, and it will undoubtedly get worse.
Global food prices also rose for the 10th straight month and are at their highest levels since 2014. The cost of vegetable oil also reached its highest level in almost a decade.
Commodity prices are also surging, and the cost of toilet paper, diapers, and more are set to surge by June.
If and when President Biden’s infrastructure spending bill passes, watch out.
Bond yields and inflation fears have replaced the virus as the most significant market mover by far. In fact, according to MarketWatch, this could be the “biggest inflation scare in 40 years.”
While consumer price data came in tamer than expected, it still rose at its fastest pace in 9-years in March.
“The rich world has come to take low inflation for granted. Perhaps it shouldn’t.” -The Economist.
As hedges against inflation, consider rereading my REIT special from March 26.
Consider also BUYING the SPDR TIPS ETF (SPIP), the Invesco Optimum Yield Diversified Commodity Strategy No K-1 ETF (PDBC), and the iShares Cohen & Steers REIT ETF (ICF).
Mid-Term/Long-Term
Add Emerging Market Exposure- Period
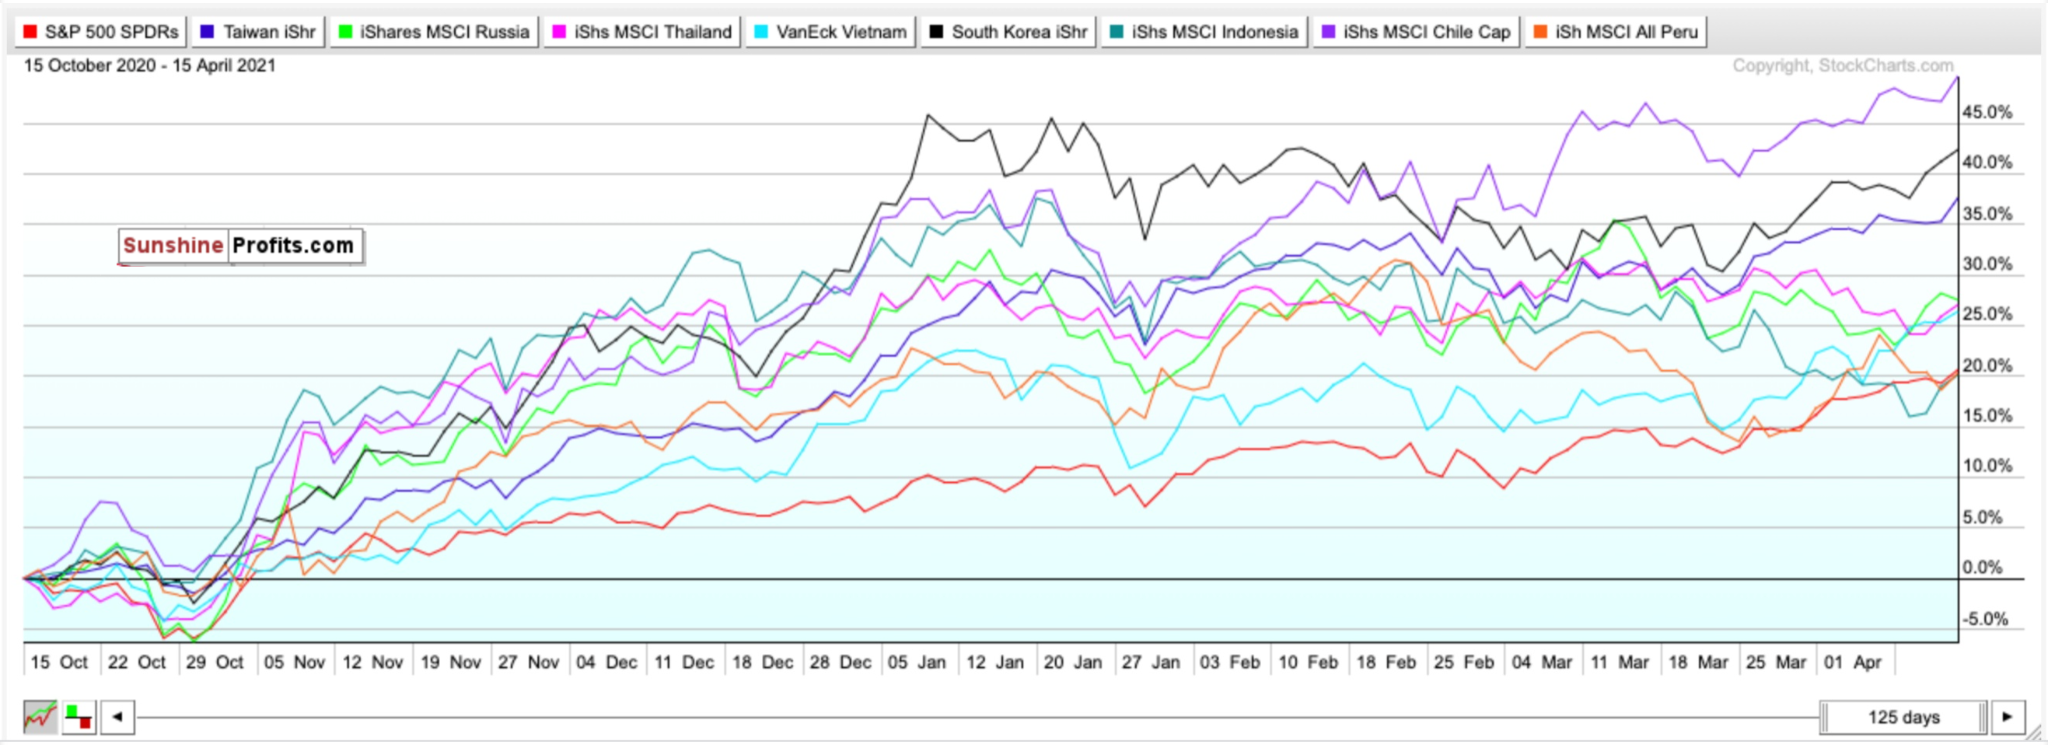
Figure 5- SPY, EWT, ERUS, THD, VNM, EWY, EIDO, ECH, EPU comparison chart- Oct. 15, 2020-Present
Since October 15, 2020, the SPDR S&P 500 ETF (SPY) has gained around 20%.
Mind you, this is quite strong. The S&P 500 is almost at 4200 and at an all-time high. Yet, almost all of my top emerging market picks for 2021 have outperformed the SPY in that same timeframe. Only Indonesia (EIDO) and Peru (EPU) have performed comparably to the SPY.
Consider this too.
With inflation on the horizon, a surge in commodity prices combined with shifting demographics could send other emerging markets upwards long-term. Plus, with birth rates plummeting during the pandemic in developed markets, it could mean long-term upside for emerging markets.
PWC echoes this sentiment and believes that emerging markets (E7) could grow around twice as fast as advanced economies (G7) on average in the coming decades.
For 2021, the following are my BUYs for emerging markets and why:
iShares MSCI Taiwan ETF (EWT)- Developing country, with stable fundamentals, diverse and modern hi-tech economy, regional upside without China’s same geopolitical risks.
iShares MSCI Thailand ETF (THD)- Bloomberg’s top emerging market pick for 2021 thanks to abundant reserves and a high potential for portfolio inflows. Undervalued compared to other ETFs.
iShares MSCI Russia Capped ETF (ERUS)- Bloomberg’s second choice for the top emerging market in 2021 thanks to robust external accounts, a robust fiscal profile, and an undervalued currency. Red-hot commodity market, growing hi-tech and software market, increasing personal incomes. Russian equities may also have potential upside north of 35%.
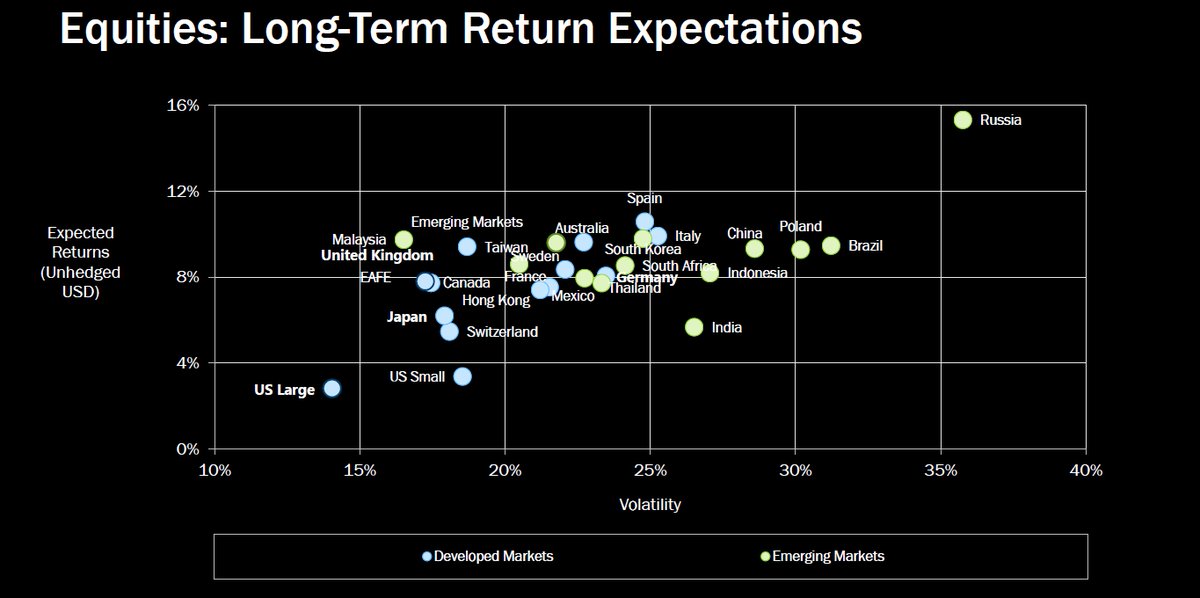
Figure 6- Equities: Long-Term Return Expectations Developed Markets/Emerging Markets
VanEck Vectors Vietnam ETF Vietnam (VNM)-Turned itself into an economy with a stable credit rating, strong exports, and modest public debt relative to growth rates. PWC believes Vietnam could also be the fastest-growing economy globally. It could be a Top 20 economy by 2050.
iShares MSCI South Korea ETF (EWY)- South Korea has a booming economy, robust exports, and stable yet high growth potential. The ETF has been the top-performing emerging market ETF since March 23.
iShares MSCI Indonesia ETF (EIDO)- Largest economy in Southeast Asia with young demographics. The fourth most populous country in the world. It could be less risky than other emerging markets while simultaneously growing fast. It could also be a Top 5 economy by 2050.
iShares MSCI Chile ETF (ECH)- One of South America’s largest and most prosperous economies. An abundance of natural resources and minerals. World’s largest exporter of copper. Could boom thanks to electric vehicles and batteries because of lithium demand. It is the world’s largest lithium exporter and could have 25% of the world’s reserves.
iShares MSCI Peru ETF (EPU)- A smaller developing economy but has robust gold and copper reserves and rich mineral resources.
Let’s see how my emerging market picks have performed in April thus far.
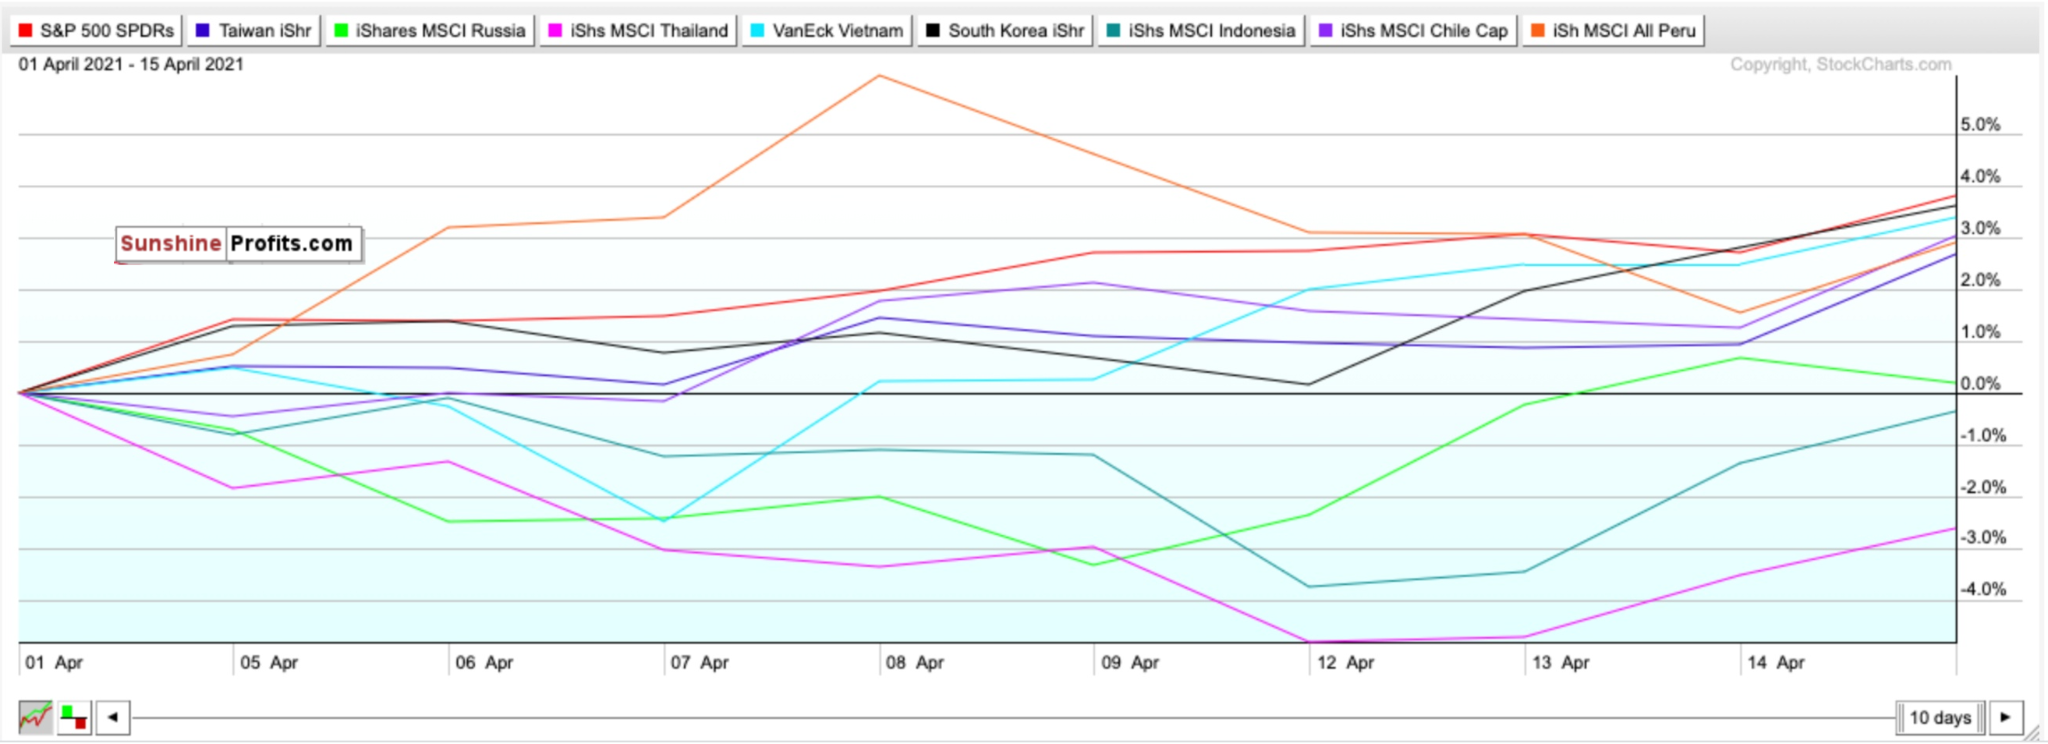
Figure 7- SPY, EWT, ERUS, THD, VNM, EWY, EIDO, ECH, EPU comparison chart- April 1-Present
Get this- the SPY has actually outperformed my picks for this month! This is the first time this has happened this year. April truly is something special for U.S. equities.
But, out of all my emerging market picks, South Korea and Vietnam have been the top performers, while Thailand has lagged.
I think this makes sense. South Korea, after being the top performer in 2020, slowed down in 2021. But now, it is making a furious comeback, and for a good reason. U.S./China relations remain icy, and South Korea should be one of the biggest beneficiaries of this. Monitor this ETF, too, as President Biden and South Korea’s President Moon are set to meet at the White House in May.
Vietnam is also a rapidly growing economy that should benefit from China's tensions. According to Bloomberg economics, the heating up U.S. economy should greatly benefit exporters in Asia, such as Vietnam. The Wall Street Journal ran a similar feature about two weeks ago titled “The Vietnamese Recovery Is Made in America.”
Meanwhile, Thailand is lagging this month. Much of that can be due to tensions in neighboring Myanmar and COVID numbers that have reached their highest numbers on record.
Outside of the aforementioned country-specific ETFs, you can also BUY the iShares MSCI Emerging Index Fund (EEM) for broad exposure to Emerging Markets.
Summary
While I don’t foresee the same gains that we saw since March 23, 2020, 2021 should still be a solid year for stocks despite some choppy waters. Although April is historically strong for stocks, and the overall backdrop right now remains favorable, I, unfortunately, think we may be approaching peak levels. Specifically the Dow and S&P.
Outside of the Russell 2000, I don’t really think we’re buyable right now.
If we see volatility, and we very likely will if Deutsche Bank’s calls come true, it's a mistake to fearfully sit out or run for the hills. Over a year out from the market’s bottom, let’s see the returns you’d see if you bought ANY of these index-tracking ETFs on March 23, 2020, when it appeared the world was ending: Russell 2000 (IWM) up 128.14%. Nasdaq (QQQ) up 101.66%. S&P 500 (SPY) up 89.52%. Dow Jones (DIA) up 86.12%.
Nobody knows “where” the actual bottom is for stocks. However, in the long-term, markets always move higher and focus on the future rather than the present.
To sum up my calls:
I have BUY call for:
- The iShares Russell 2000 ETF (IWM)
I have a HOLD call for:
- The Invesco QQQ ETF (QQQ)
I have a SELL call for:
- The SPDR S&P ETF (SPY), and
- the SPDR Dow Jones ETF (DIA)
I also recommend selling or hedging the US Dollar and gaining exposure into emerging markets for the mid-term and long-term.
I have BUY calls on:
- The iShares MSCI Emerging Index Fund (EEM),
- the iShares MSCI Taiwan ETF (EWT),
- the iShares MSCI Thailand ETF (THD),
- the iShares MSCI Russia ETF (ERUS),
- the VanEck Vectors Vietnam ETF (VNM),
- the iShares MSCI South Korea ETF (EWY),
- the iShares MSCI Indonesia ETF (EIDO),
- the iShares MSCI Chile ETF (ECH),
- and the iShares MSCI Peru ETF (EPU)
Additionally, because inflation shows signs of returning, and I foresee it potentially worsening as early as Q3 or Q4 2021...
I have BUY calls on:
- The SPDR TIPS ETF (SPIP),
- the Invesco Optimum Yield Diversified Commodity Strategy No K-1 ETF (PDBC), and
- the iShares Cohen & Steers REIT ETF (ICF)
Thank you.
Matthew Levy, CFA
Stock Trading Strategist

