

Briefly:
Intraday trade: Our Tuesday's intraday outlook was neutral. The S&P 500 index lost 1.3% after opening 0.4% higher. Stocks will probably fluctuate following recent sell-off. Therefore, we prefer to be out of the market, avoiding low risk/reward ratio trades.
Medium-term trade: In our opinion, no medium-term positions are justified.
Our intraday outlook is neutral. Our short-term outlook is neutral, and our medium-term outlook is neutral:
Intraday outlook (next 24 hours): neutral
Short-term outlook (next 1-2 weeks): neutral
Medium-term outlook (next 1-3 months): neutral
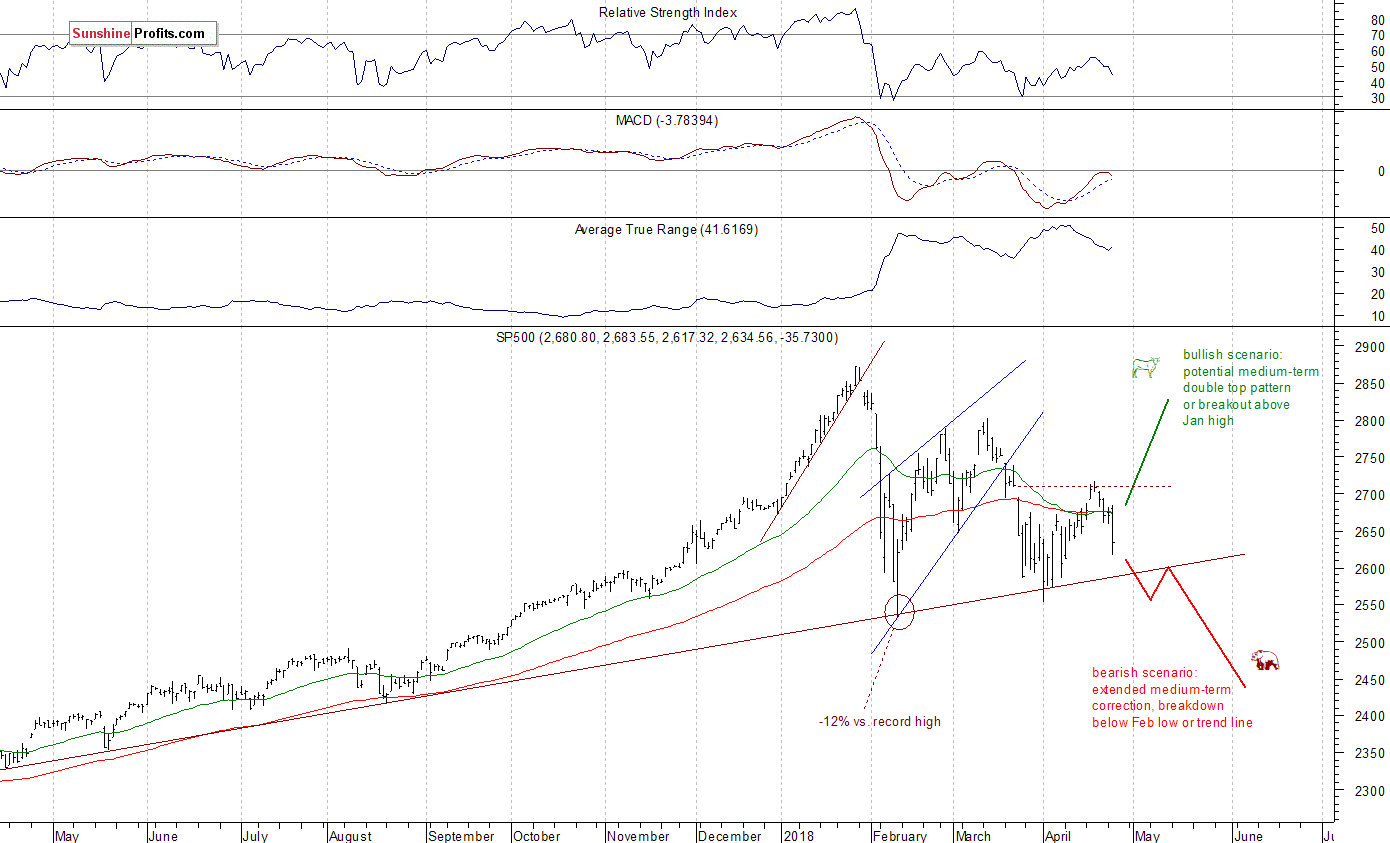
The U.S. stock market indexes lost 1.3-1.7% on Tuesday, extending their short-term downtrend, as investors reacted to rising bond yields. The S&P 500 index got closer to the level of 2,600 and its over year-long upward trend line. It currently trades 8.3% below its January 26 record high of 2,872.87. Both the Dow Jones Industrial Average and the technology Nasdaq Composite lost 1.7% yesterday.
The nearest important level of resistance of the S&P 500 index is now at 2,650-2,655, marked by recent local lows. The next resistance level is at 2,680-2,700, among others. On the other hand, support level is at 2,615-2,620, marked by yesterday's daily low. The next level of support is at 2,590-2,600, marked by upward trend line. The support level is also at 2,530-2,550, marked by previous local lows.
The broad stock market gets closer to its medium-term upward trend line again. Stocks bounced off this line in the early April. Will they bounce again? If the index breaks lower, it could quickly continue towards the February 9 low of 2,532.69. However, stocks remain within their over two-month-long consolidation following early February sell-off. Is this a bottoming pattern before another leg higher within the long-term bull market? Or just pause before another wave of selling? So, there are still two possible future scenarios - bearish that will lead us below February low following trend line breakdown, and the bullish one in a form of medium-term double top pattern or breakout towards 3,000 mark. Stocks bounced off the resistance level in the middle of last week, and they accelerated lower yesterday:
Negative Expectations Again
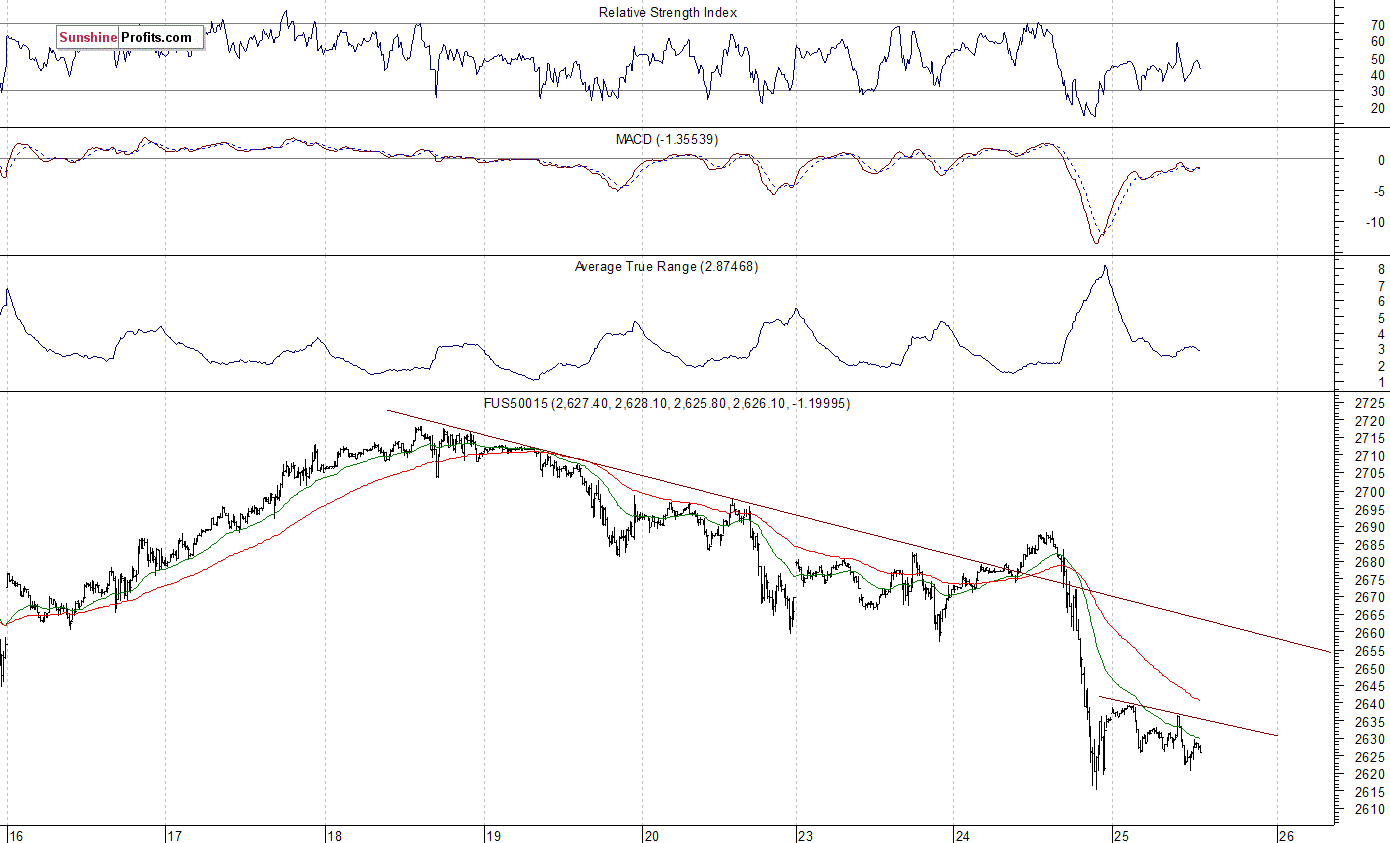
Expectations before the opening of today's trading session are negative, because the index futures contracts trade 0.4-0.5% lower vs. their Tuesday's closing prices. The main European stock market indexes have lost 0.7-1.6% so far. Investors will wait for the Crude Oil Inventories number release at 10:30 a.m. Investors will also wait for more quarterly earnings releases. Will the market continue its short-term downtrend today? We may see some more downward action, however, the S&P 500 index could bounce off support level at 2,600 and the above-mentioned upward trend line.
The S&P 500 futures contract trades within an intraday consolidation, as it fluctuates following yesterday's move down. The nearest important level of resistance is at around 2,640, marked by local highs. The next resistance level is at 2,650-2,660. On the other hand, support level is at 2,615-2,620, marked by yesterday's daily low. The support level is also at 2,590-2,600. The futures contract is now closer to 2,600 mark, as the 15-minute chart shows:
Volatility is Back
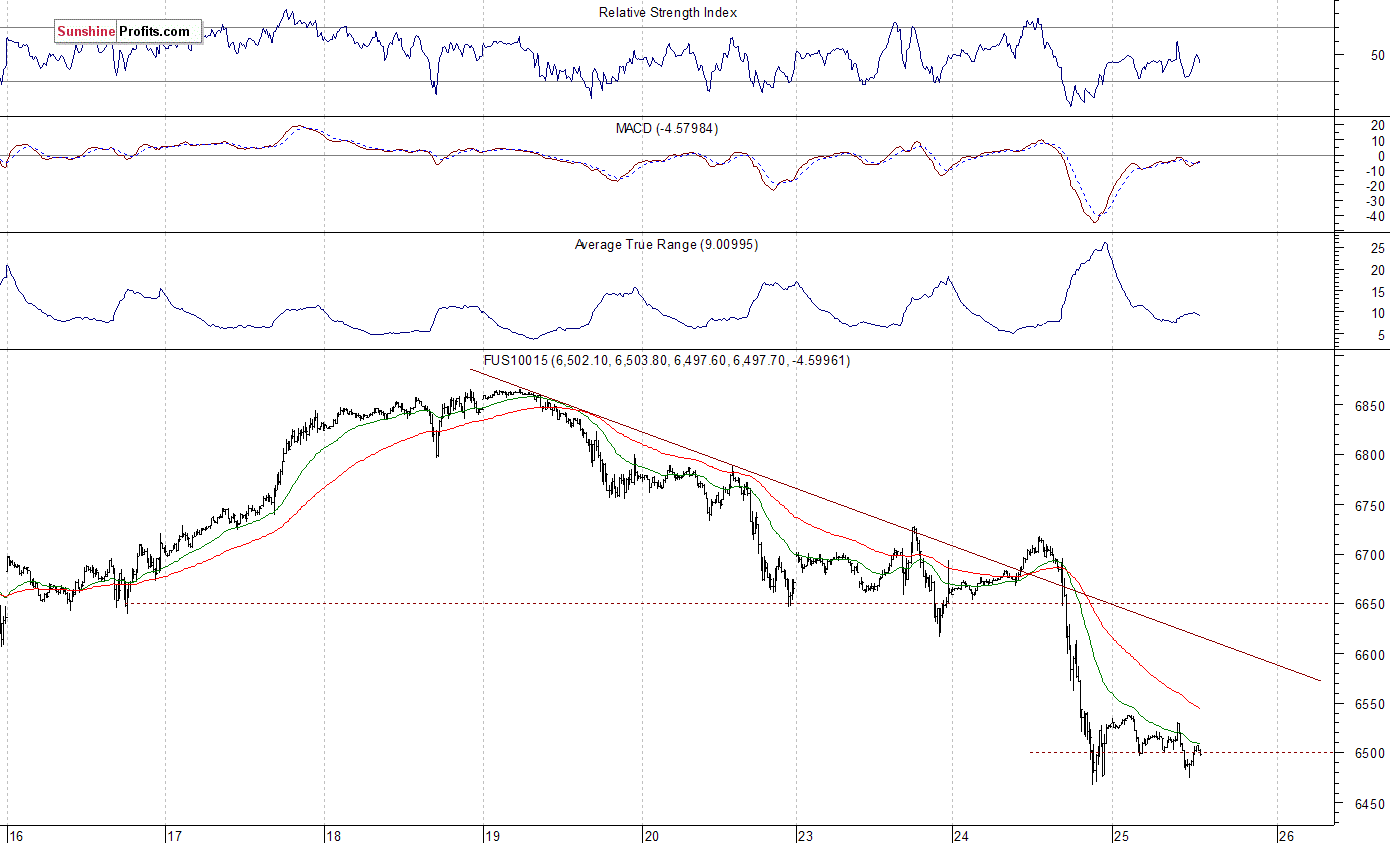
The technology Nasdaq 100 futures contract follows a similar path, as it trades within an intraday consolidation. The market accelerated its downtrend yesterday, after a failure at the resistance level of 6,700. Then, it lost around 250 points. The volatility is back. Will big cap tech stocks continue lower? Investors will react to today's earnings release from Facebook and tomorrow's earnings releases from Amazon, Microsoft, among others. The nearest important level of resistance is at around 6,530-6,550, marked by local highs. On the other hand, support level is at around 6,450-6,460. The Nasdaq futures contract trades along 6,500 mark, as we can see on the 15-minute chart:
Big Cap Tech Stocks Selling Off
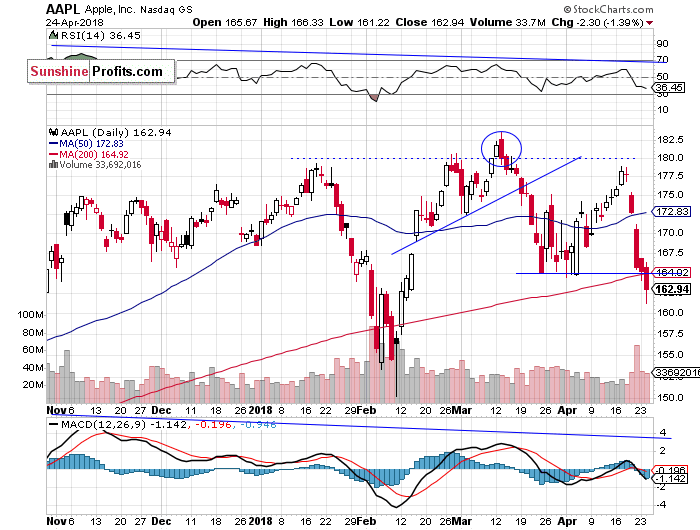
Let's take a look at Apple, Inc. stock (AAPL) daily chart (chart courtesy of http://stockcharts.com). It sold off on Friday, following Thursday's move down, and it broke below the support level of $165 yesterday. The market is the lowest since the middle of February. Apple will release its earnings report on May 1, so expectations before that release seem to be negative. Will we see some "sell the rumor, buy the fact" action? Potential support level is at around $160:
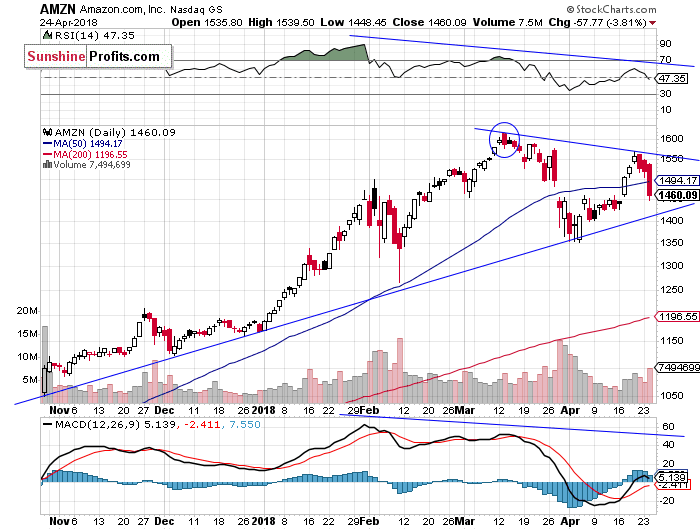
Now let's take a look at Amazon.com, Inc. stock (AMZN) daily chart. The price bounced off resistance level at $1,550 recently, and it continued below $1,500 yesterday. Will it break below its medium-term upward trend line? If it breaks lower, it could continue towards $1,250-1,300. We still can see medium-term negative technical divergences:
Failed Breakout, Dow Jones Lower Again
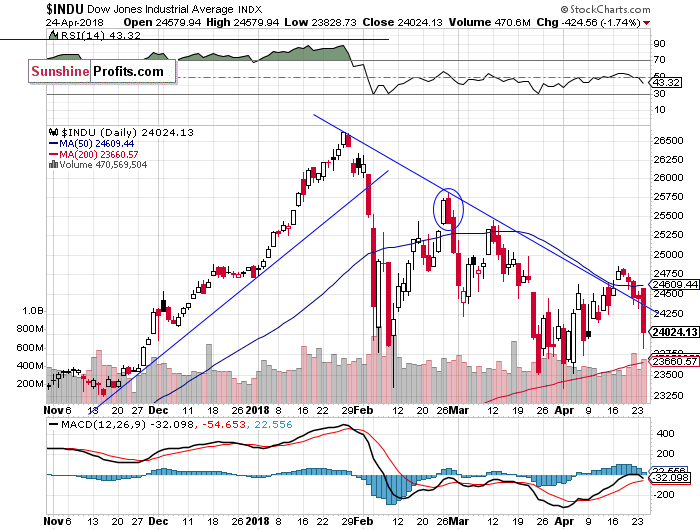
The Dow Jones Industrial Average came back below its medium-term downward trend line yesterday, as it invalidated its bullish scenario. The price bounced off resistance level of around 24,800-25,000 over a week ago. Will it get back to its late March - early April lows again? If it breaks below the level of 24,000, it could continue lower. Potential support level is at around 23,500:
The broad stock market retraced most of its early April move up in the last trading days. Is this a new downtrend or just quick downward correction? It looked like a correction yesterday, but the market accelerated its downtrend. So, medium-term bearish case is more likely again. Just like we wrote in our several Stocks Trading Alerts, the early February sell-off set the negative tone for weeks or months to come.
Concluding, the S&P 500 index will likely retrace some of its yesterday's decline today, but first it may extend its short-term downtrend. Overall, we may see a relatively flat correction following yesterday's sell-off. Rising bond yields outweighed quarterly earnings releases, and investors' sentiment is bearish again. There have been no confirmed positive signals so far. However, there are some short-term oversold conditions.
Currently, we prefer to be out of the market, avoiding low risk/reward ratio medium-term trades. We will let you know when we think it is safe to get back in the market.
To summarize: no medium-term positions are justified from the risk/reward perspective at this moment.
Intraday trade:
No intraday position is justified from the risk/reward perspective today.
No medium-term position is justified from the risk/reward perspective at this moment.
Thank you.
Paul Rejczak
Stock Trading Strategist
Stock Trading Alerts

