

Briefly:
Intraday trade: The S&P 500 index lost 2.3% on Friday, after opening 0.2% lower. The market will probably open slightly lower to virtually flat today. We may see an attempt at bouncing of the support level.
Trading position (short-term; our opinion): no positions are justified from the risk/reward perspective.
Our short-term outlook is neutral, and our medium-term outlook is neutral:
Short-term outlook (next 1-2 weeks): neutral
Medium-term outlook (next 1-3 months): neutral
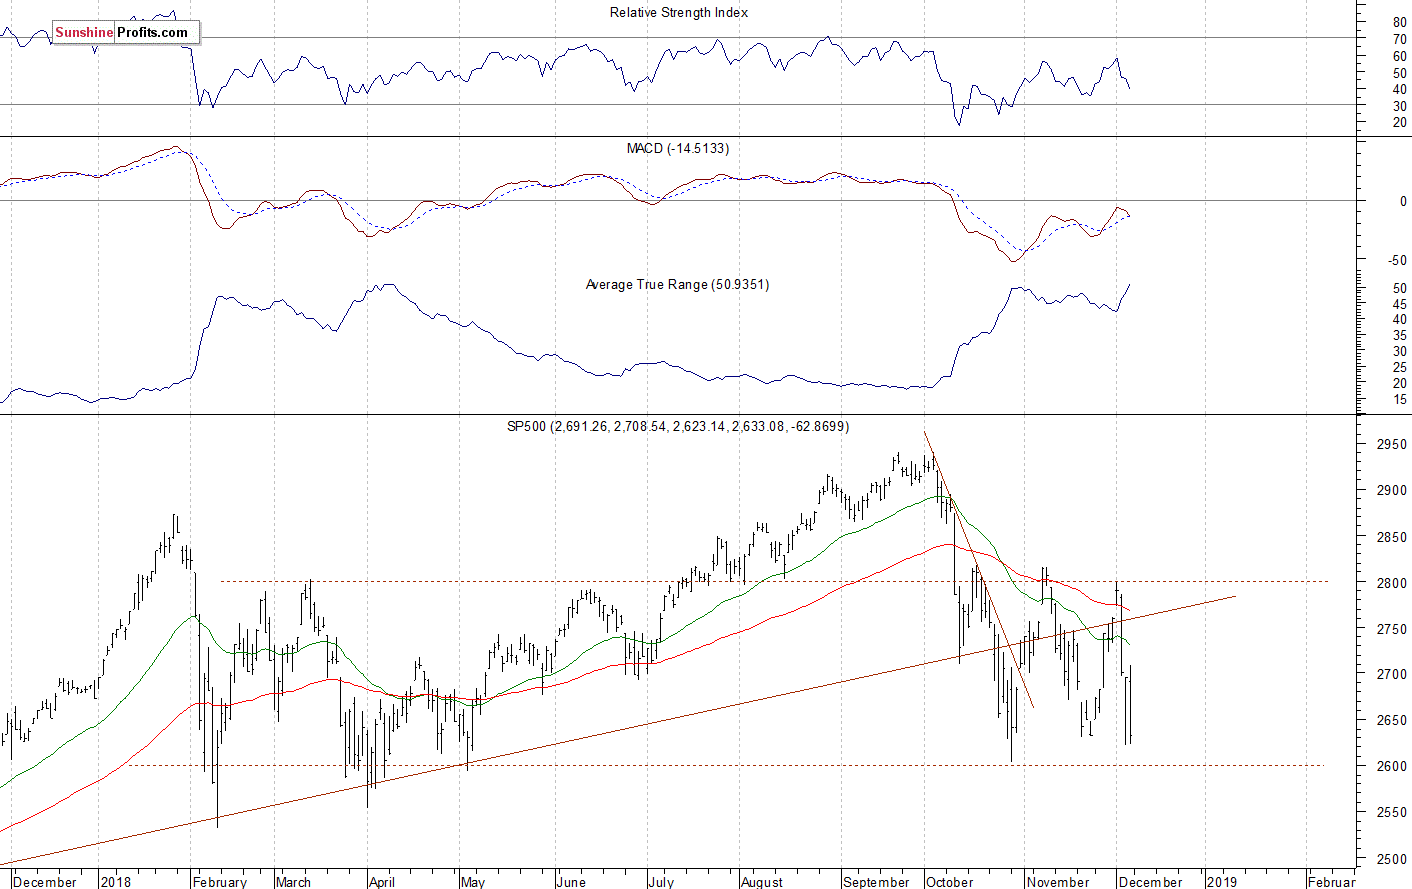
The U.S. stock market indexes lost 2.2-3.1% on Friday, reversing their short-term advance again, as investors sentiment worsened. The S&P 500 index trades 10.5% below September the 21st record high of 2,940.91. The Dow Jones Industrial Average lost 2.2% and the Nasdaq Composite lost 3.1% on Friday.
The nearest important level of resistance of the S&P 500 index is now at around 2,650, marked by the previous support level. The resistance level is also at 2,695-2,700, marked by Thursday's daily gap down of 2,696.15-2,697.18. On the other hand, the support level remains at 2,600-2,630, marked by the medium-term local lows.
The broad stock market quickly reversed its recent upward course following the S&P 500 index' reversal off the resistance level at 2,800. On Thursday the market broke below 2,700 mark, as it retraced more of the rally. The market is extending its medium-term consolidation. But if it breaks below 2,600 mark, we could see more selling pressure:
Short-Term Fluctuations Following the Sell-Off
Expectations before the opening of today's trading session are slightly negative, because the index futures contracts trade 0.2-0.3% below their Friday's closing prices. The European stock market indexes have been mixed so far. There will be no new important economic data announcements today. The broad stock market will likely fluctuate following its Friday's sell-off. If the S&P 500 index breaks below 2,600, we could see more selling pressure. However, it still looks like a volatile medium-term consolidation following the October decline.
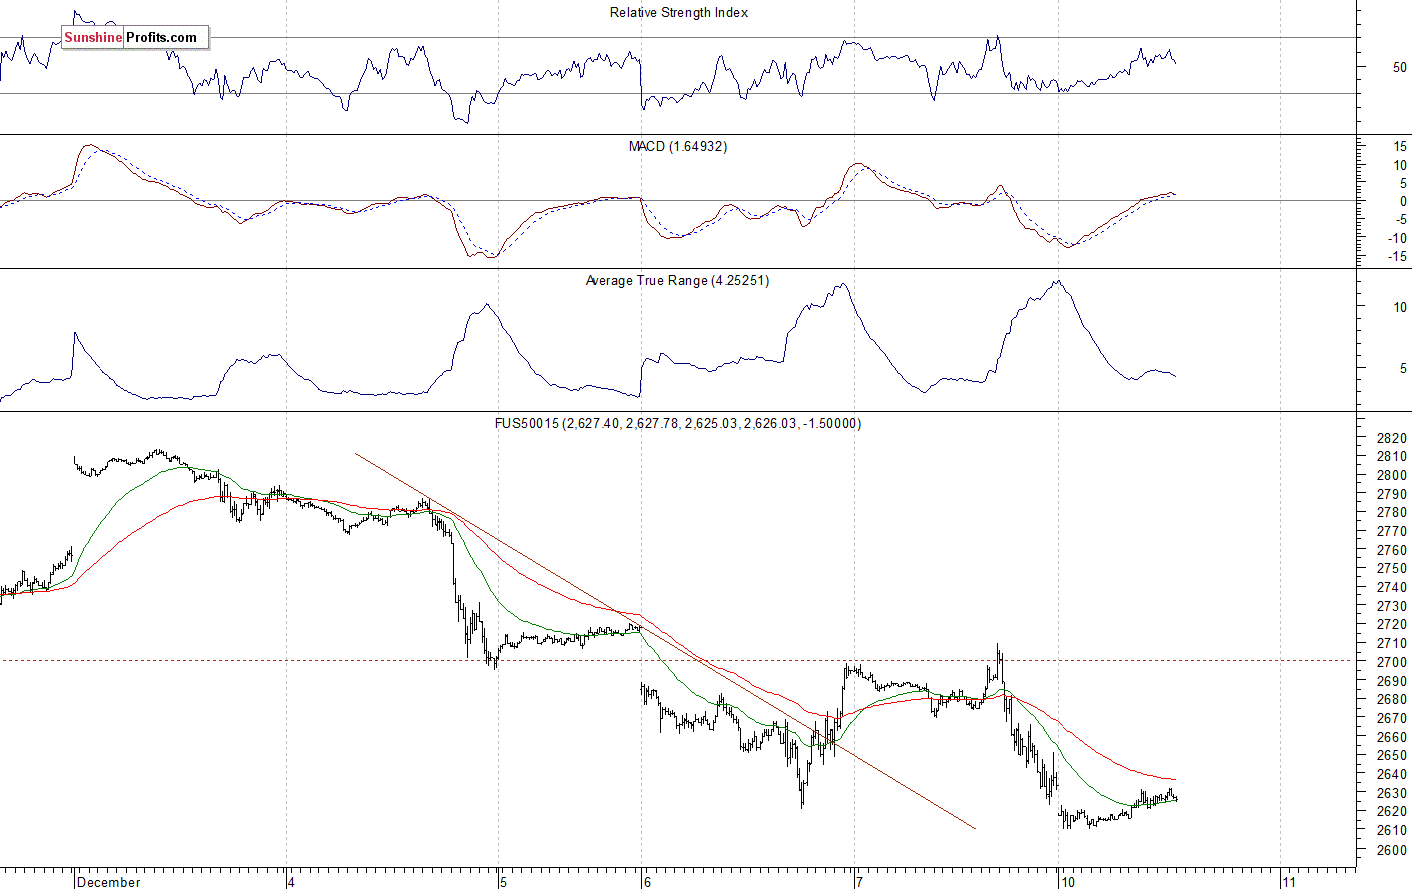
The S&P 500 futures contract trades within an intraday consolidation, as it fluctuates following Friday's big decline. The nearest important level of resistance is at around 2,630-2,650, marked by the local high. On the other hand, the support level is at 2,600-2,610, among others. The futures contract remains close to its short-term local lows, as we can see on the 15-minute chart:
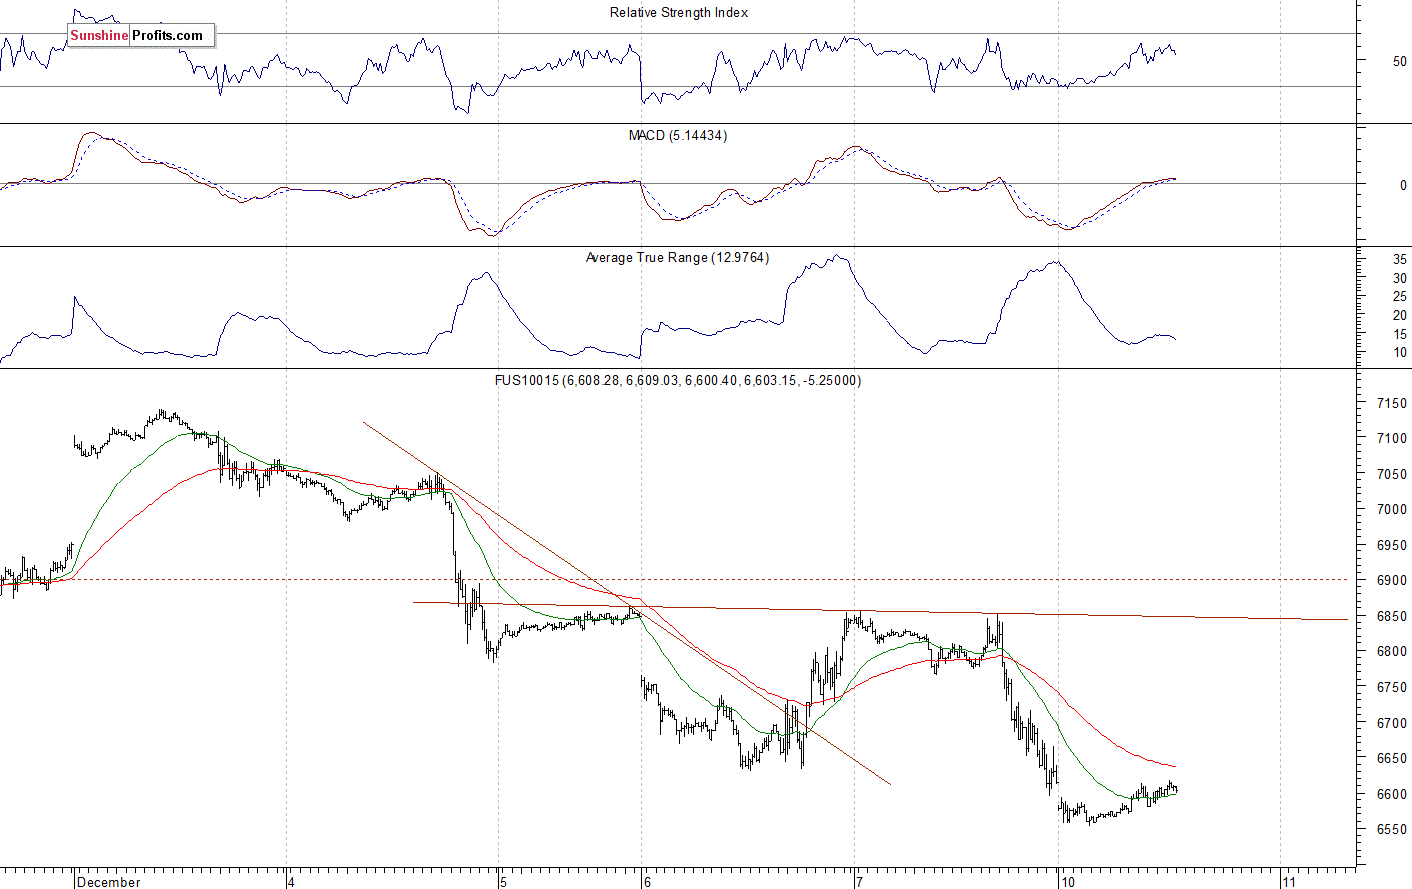
Nasdaq at 6,600 Mark
The technology Nasdaq 100 futures contract follows a similar path, as it fluctuates following Friday's sell-off. The market fell to the level of around 6,550 after bouncing off the resistance level at 6,850. So we still can see an increased volatility. The nearest important level of resistance is at 6,650-6,700. On the other hand, the support level is at 6,500-6,550. The Nasdaq futures contract trades along the level of 6,600 this morning, as the 15-minute chart shows:
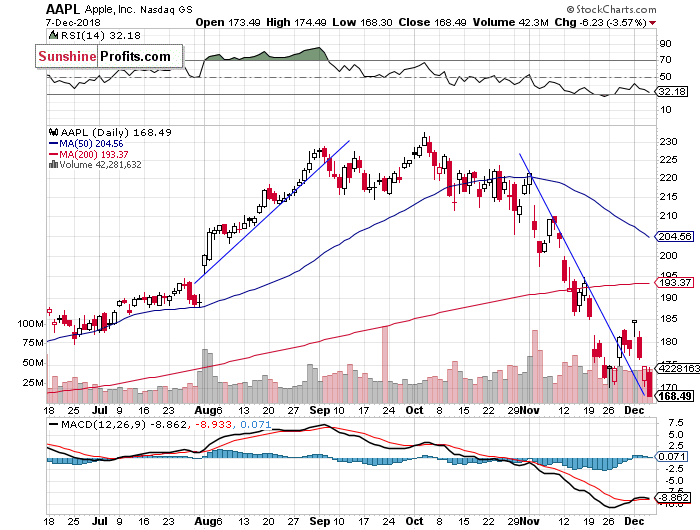
Big Cap Tech Stocks - Mixed Picture, Apple at New Low
Let's take a look at Apple, Inc. stock (AAPL) daily chart (chart courtesy of http://stockcharts.com). The stock sold off below the support level of $170 on Friday. Was it a panic bottom before an upward reversal? There have been no confirmed positive signals so far. However, we can see some short-term oversold conditions:
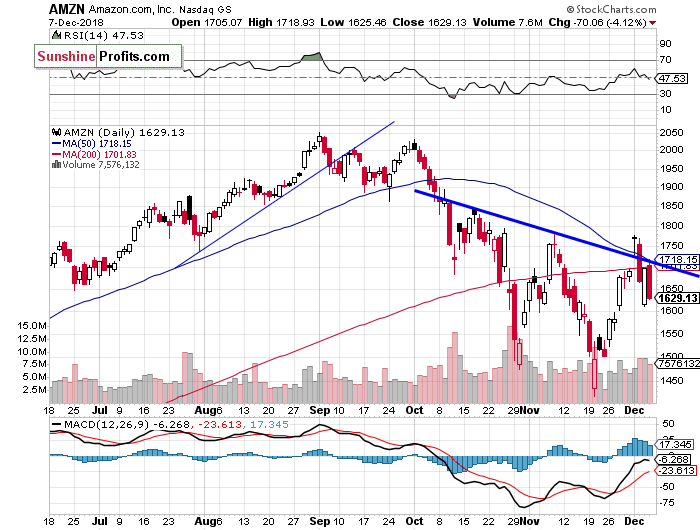
Now let's take a look at Amazon.com, Inc. stock (AMZN) daily chart. It remains relatively stronger, as it still trades way above the November low. The stock bounced off $1,600 on Thursday, but it failed to continue higher on Friday. The resistance level remains at $1,750-1,800, marked by some previous local highs. The stock continues to trade below its two-month-long downward trend line, as we can see on the daily chart:
Dow Jones Also Lower
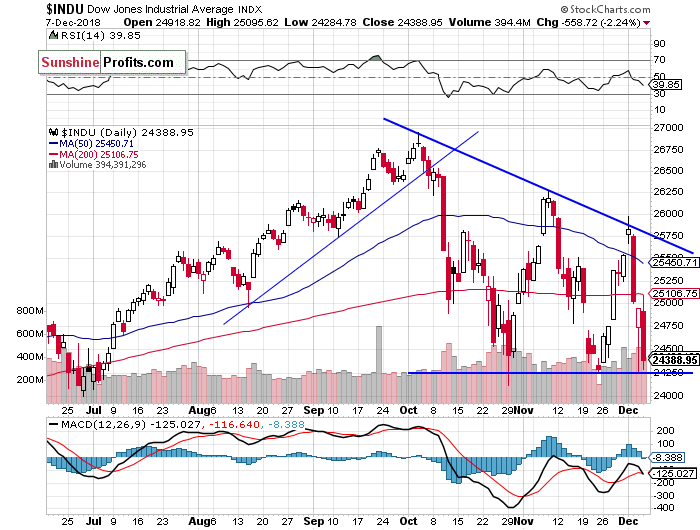
The Dow Jones Industrial Average got closer to 26,000 mark last week, as it accelerated its short-term uptrend, but then it quickly reversed lower. We saw more downward action on Thursday, as the index fell to around 24,250, before bouncing off to 25,000 again. On Friday, the blue-chip stocks' gauge fell closer to the support level again. If it breaks lower, we could see another sell-off:
Japanese Nikkei Closer to 21,000 Mark Again
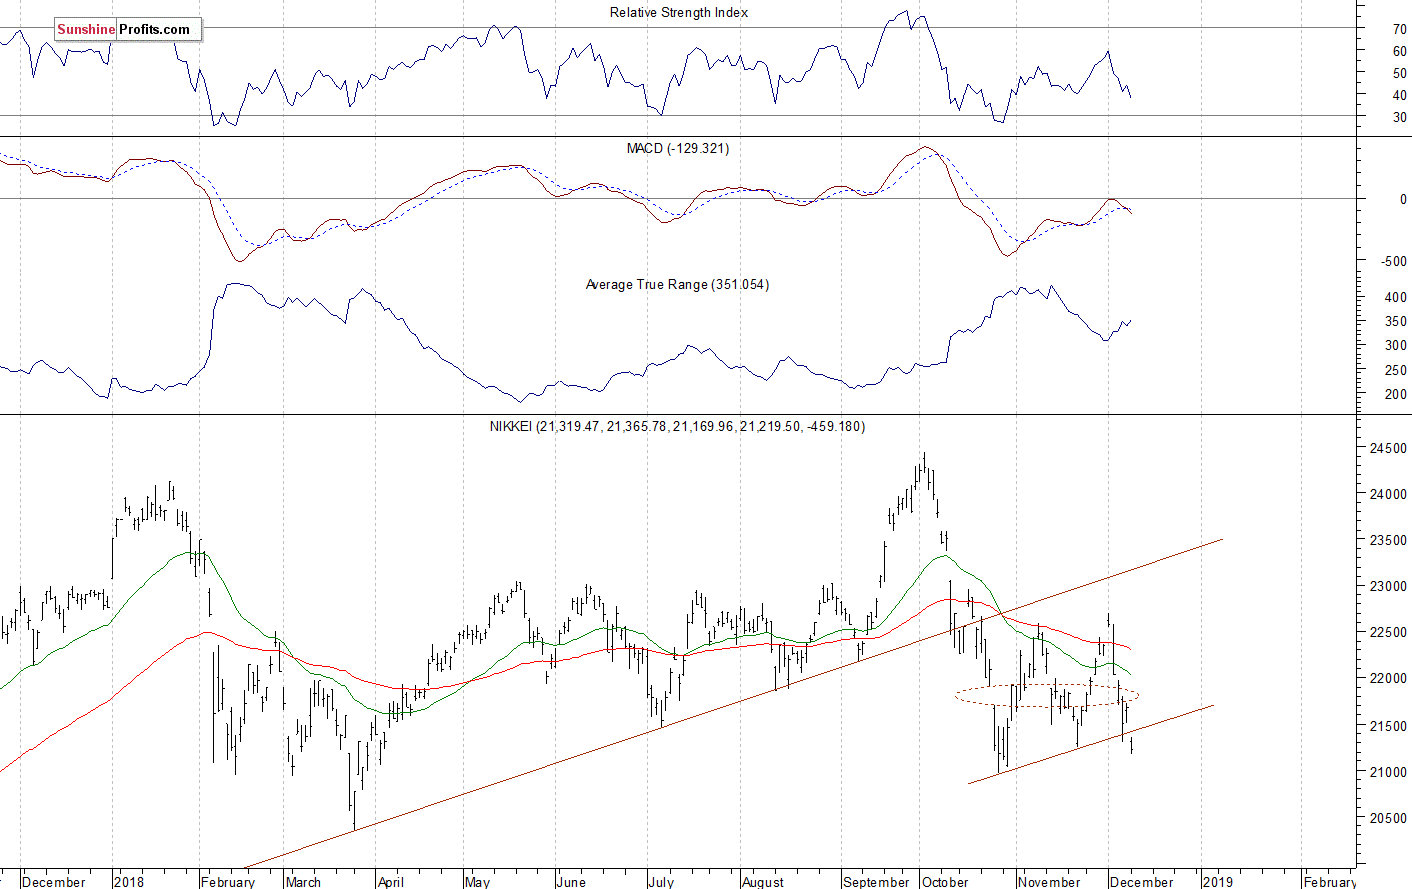
Let's take a look at the Japanese Nikkei 225 index. It broke slightly below its two-month-long upward trend line today. The market is also slightly below the medium-term bear flag pattern. So will it continue lower? We still could see an attempt at reversing higher:
The S&P 500 index quickly reversed its short-term uptrend last week following some negative U.S. - China trade war developments. It got back to 2,700 mark before the Wednesday's pause. On Thursday it continued towards the late October low of 2,603.54 before quickly bouncing off and retracing almost all of the daily decline. Then on Friday it sold off again, closing at the support level of 2,600-2,630. It still looks like a volatile medium-term consolidation.
Concluding, the S&P 500 index will likely open slightly lower to virtually flat today. We may see some more short-term volatility. If the index breaks below its medium-term local lows, we could see more selling pressure. There have been no confirmed short-term positive signals so far.
Trading position (short-term; our opinion): no positions are justified from the risk/reward perspective.
Thank you.
Paul Rejczak
Stock Trading Strategist
Stock Trading Alerts

