

Trading position (short-term, our opinion; levels for S&P 500 continuous futures contract): short positions with an entry at 4,435 price level, with 4,520 as a stop-loss and 4,200 as a price target.
The S&P 500 index retraced much more of its recent declines on Friday. But was it really a game-changer? Buyers may hit a wall soon.
Stocks were advancing on Friday (Aug. 20) led by the record-breaking run-up in Microsoft shares, among other factors. The S&P 500 index gained 0.81%, as it broke slightly above the 4,440 mark. It looks like a correction within a downtrend. However, a bounce from the three-month-long upward trend line may be considered bullish. The nearest important support level is now at 4,400-4,410. On the other hand, the resistance level is now at 4,460-4,480, marked by mid-August local highs, as we can see on the daily chart (chart by courtesy of http://stockcharts.com):
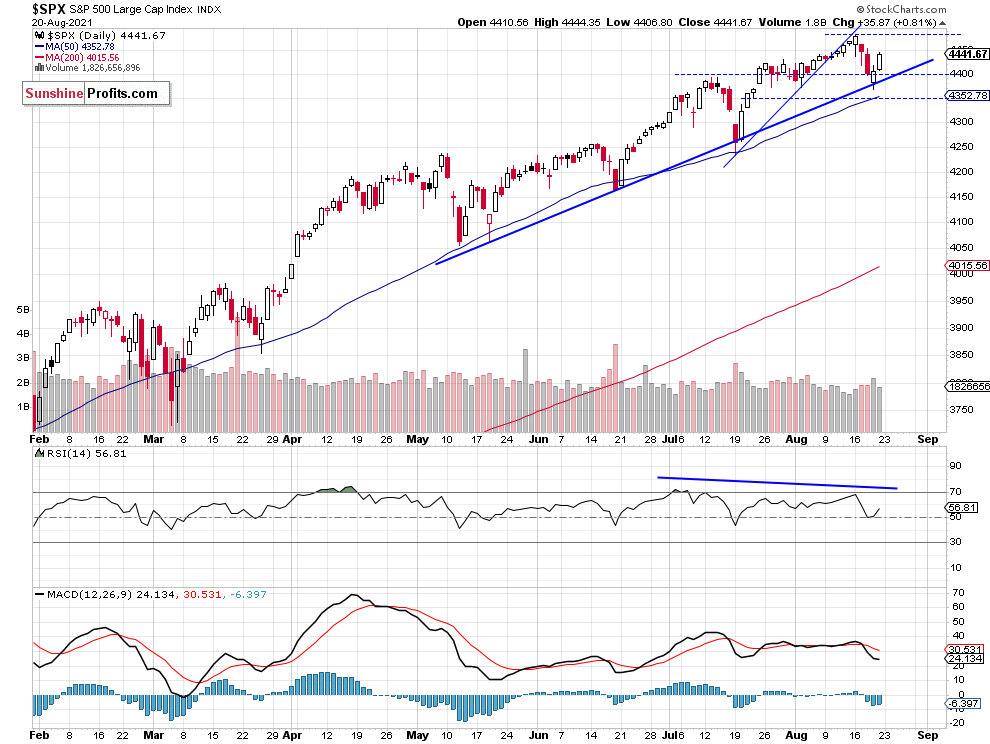
S&P 500 is Still Close to Medium-Term Trend Line
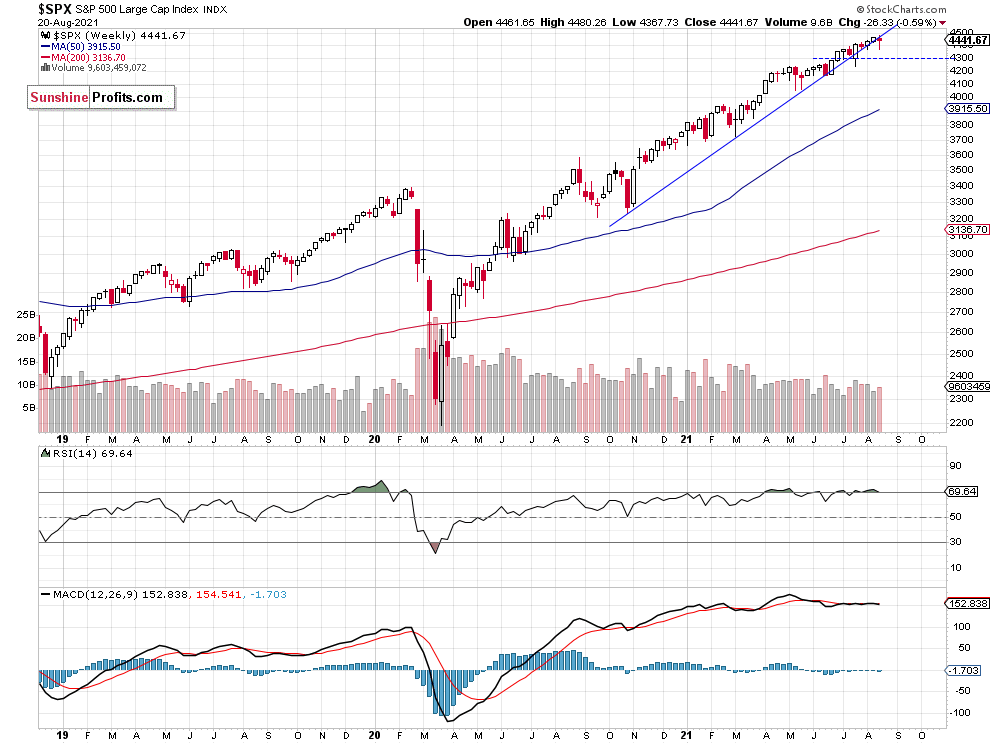
The S&P 500 index broke slightly below its medium-term upward trend line. However, it is still relatively close to it. The nearest important support level is at 4,300, as we can see on the weekly chart:
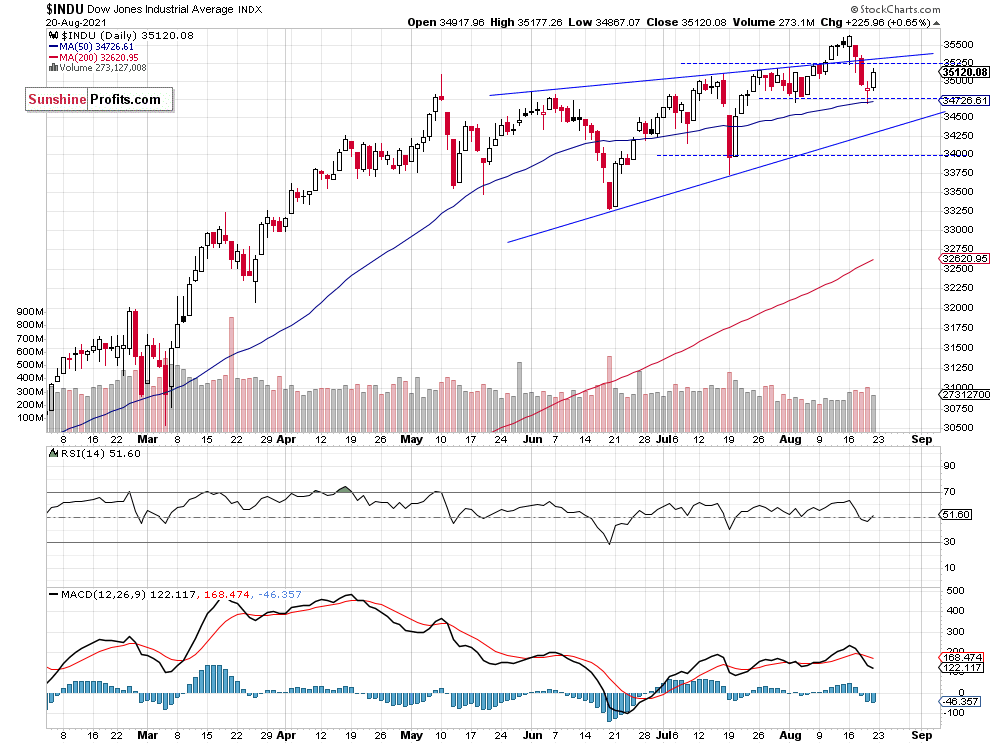
Dow Jones is Relatively Weaker
Let’s take a look at the Dow Jones Industrial Average chart. The blue-chip index broke below 35,000 recently and on Friday it got back above it. However, we can see a relative weakness vs. the broad stock market. The DJIA index is trading below the resistance level of 35,250, as we can see on the daily chart:
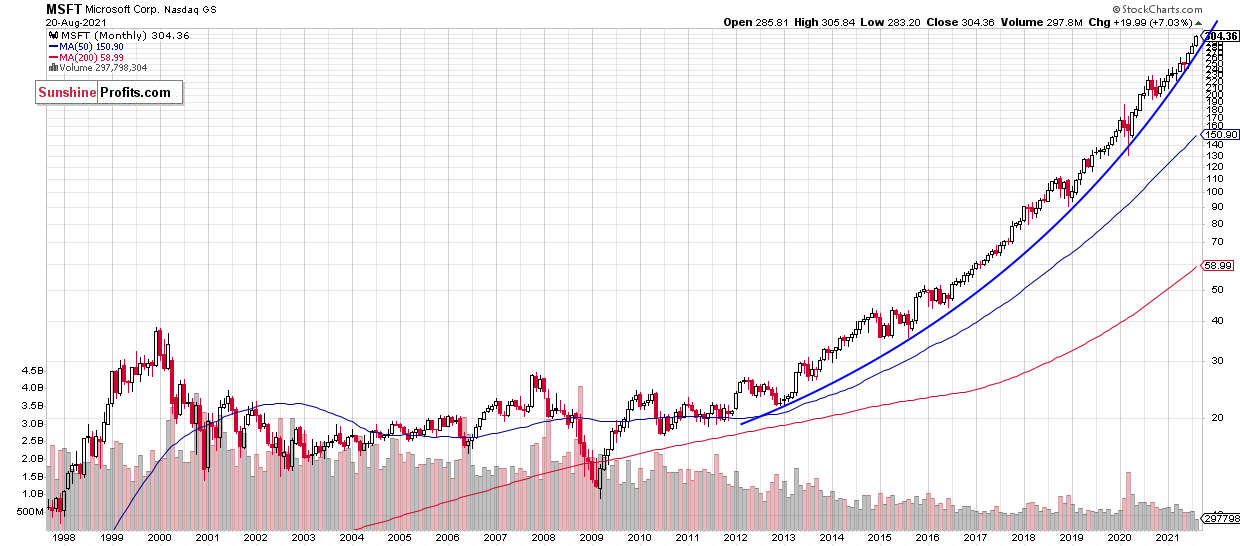
Microsoft’ Long-term Hyperbolic Run
The short-term run-up in Microsoft’s stock price has been the main bullish driver for the whole market last Thursday (Aug. 19) and Friday (Aug. 20). On Friday the stock reached a new record high of $305.84. Let’s take a look at a monthly chart of MSFT. We can clearly see that it has been a hyperbolic run since 2013. And the market capitalization reached almost $2.3 trillion on Friday. This may be one of the signs indicative of a price bubble in stocks.
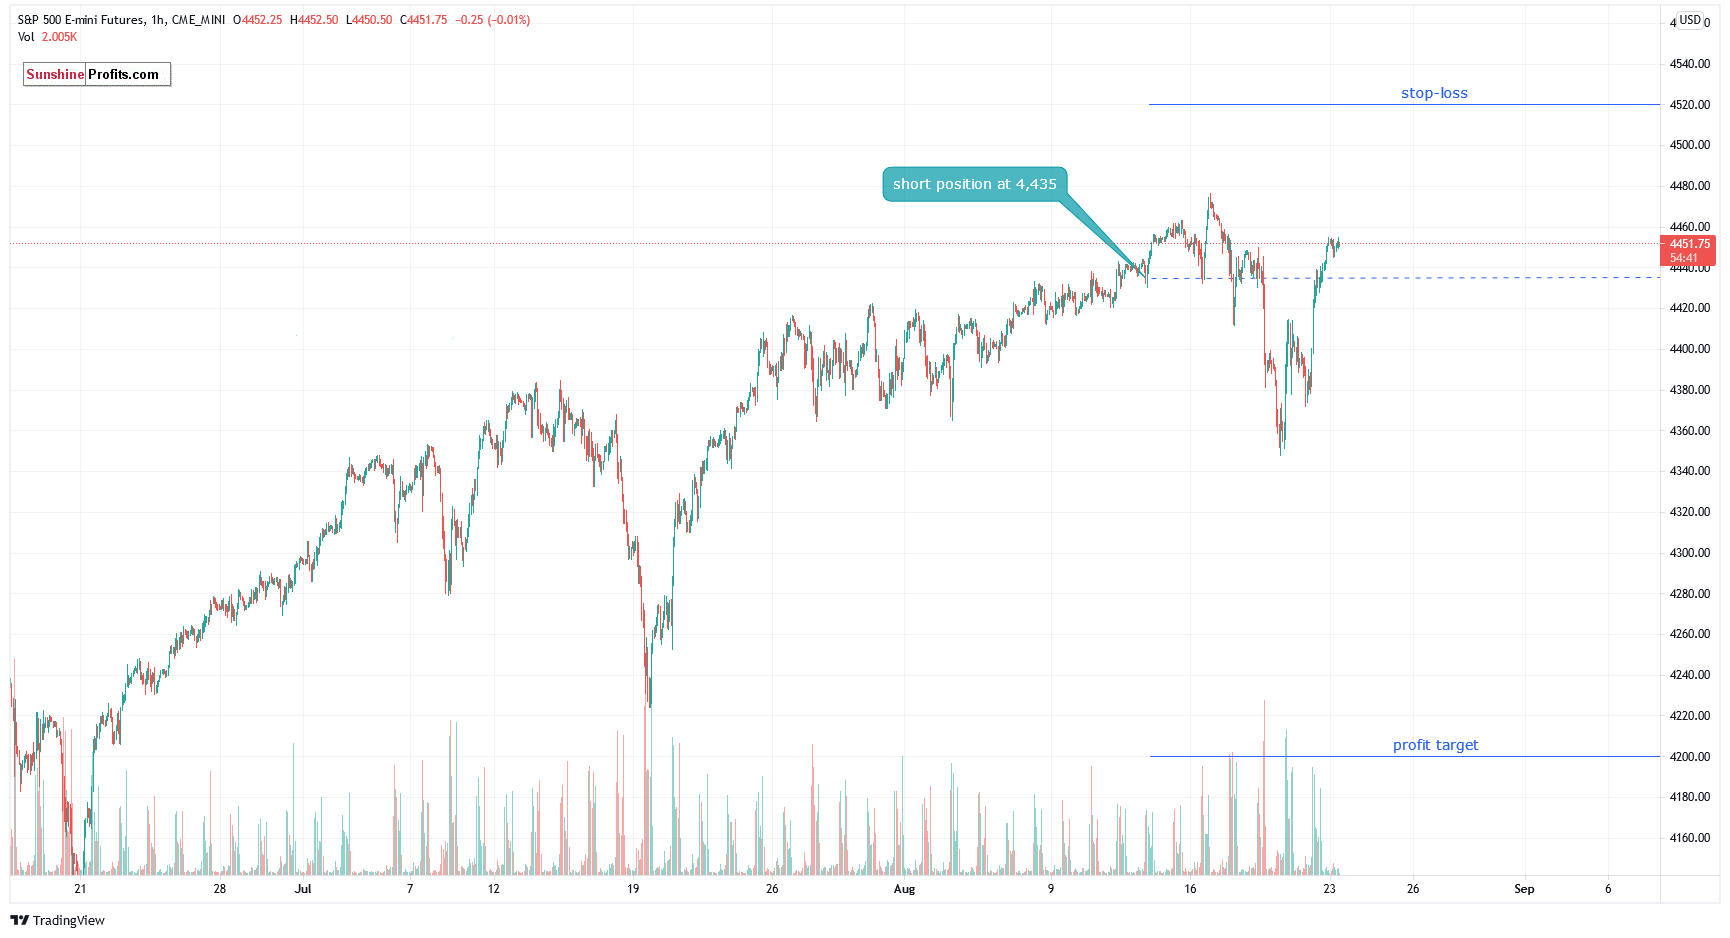
We’re Sticking to a Short Position
Let’s take a look at the hourly chart of the S&P 500 futures contract. We opened a short position on Thursday, August 12 at the level of 4,435. The position was profitable before Friday’s (Aug. 20) run-up. We still think that a speculative short position is justified from a risk/reward perspective. (chart by courtesy of http://tradingview.com):
Conclusion
The S&P 500 index retraced more of its recent declines on Friday. For now it looks like an upward correction within a new downtrend. Therefore, we’re keeping our short position intact.
Here’s the breakdown:
- The market got back above the 4,440 level and most investors are expecting a comeback to the all-time high of around 4,480.
- Our speculative short position is still justified from a risk/reward perspective.
- We are expecting a 5% or bigger correction from last Monday’s high.
As always, we’ll keep you, our subscribers, well-informed.
Trading position (short-term, our opinion; levels for S&P 500 continuous futures contract): short positions with an entry at 4,435 price level, with 4,520 as a stop-loss and 4,200 as a price target.
Thank you.
Paul Rejczak,
Stock Trading Strategist
Sunshine Profits: Effective Investments through Diligence and Care

