

Last week’s excessive CPI print marked the top of the S&P 500 for the week. As the market continues to digest the data, where is the breaking point for inflation and interest rates?
Did you watch Fed Chair Powell testify in front of the Senate and House last week? It seemed to be like watching certain angry congresspeople calling for interest rates to be kept lower for longer. Do they want hyperinflation? Other groups of Senators reflected on what the inflationary environment was like in the early 1980s.
As Chair Powell testified, bonds rose (yields fell), and the S&P 500 was mostly lower. Clearly, there was a bid under the bonds (keeping interest rates lower). All of this came over a two-day period following the monstrous CPI print.
Recapping Tuesday through Friday in the E-Mini S&P 500 Futures Last Week:
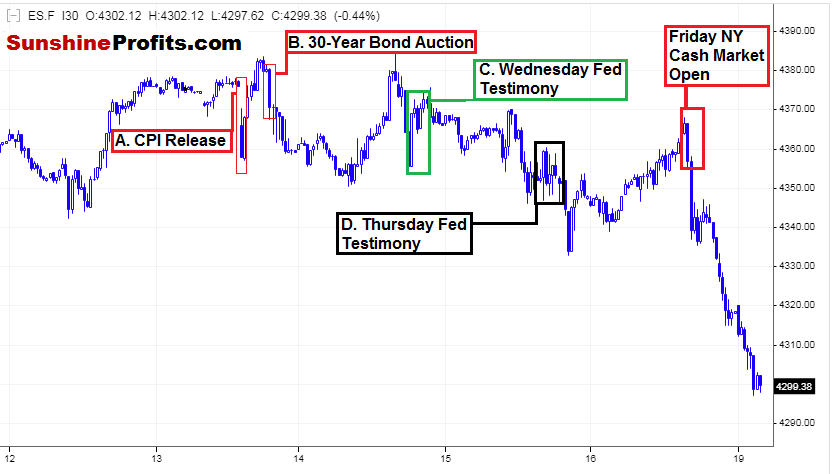
Figure 1 - E-Mini S&P 500 Futures July 12, 2021 - July 16, 2021, 10:00 PM ET, 30 Minute Candles Source stooq.com
A. Tuesday 8:30 AM: CPI Data 0.9% vs. 0.5% expected, highest run rate ex-food and energy in 30 years.
B. Tuesday 1:00 PM: Weak 30-Year bond auction offered at 2.00% yield
C. Wednesday: Fed Chair testimony
D. Thursday: Fed Chair testimony
E. Friday: NY Cash Market Open
We can see the large CPI print was bearish for the index, and the market recovered. Then, we had the bond auction, which had very weak demand at 2.00%, and the index sold off again. It recovered once again, tested the highs, and was rejected. The Fed testimonies on Wednesday and Thursday kept the S&P 500 bid and sideways.
As all of this was occurring last week, I was eyeballing the index all day, each day, wondering when it would all become too much to keep the index afloat.
On Friday, we got a bullish Retail Sales number at 8:30 AM before the NY cash open, and then a bearish UoM Consumer Sentiment Print at 10:00 AM. The NY open was lower even before the bearish UoM print at 10:00 AM. It seemed like the index finally couldn’t bear the inflation data. The weak bond auction, and the congressional rhetoric during the Fed 2-day testimony any further and had to break. It actually made sense.
I want to illustrate the above A through E points in terms of interest rates last week.
Taking a look in terms of the 10-Year note yield:
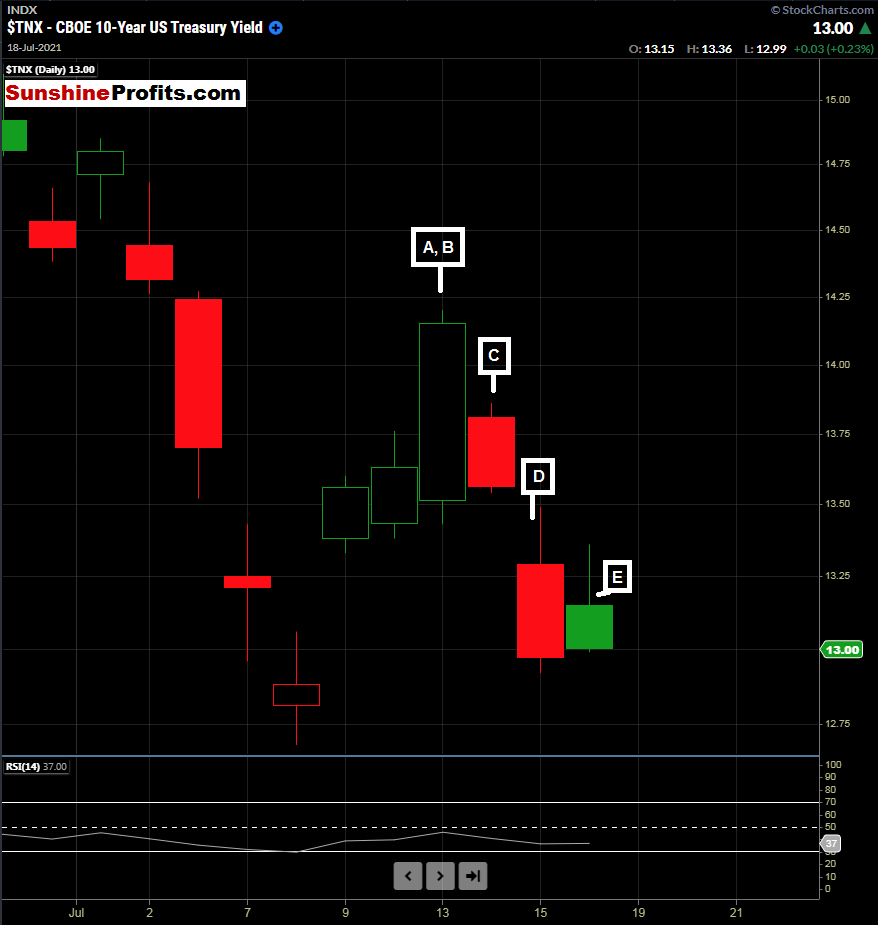
Figure 2 - 10-Year Treasury Yield July 12, 2021 - July 16, 2021, Daily Candles Source stockcharts.com
The question I pose here: What if interest rates were rising towards the end of last week?
It doesn’t seem like the current market would be able to handle it. However, the Fed must use tools to curb inflation. This inflation seems anything but transitory or temporary at this point.
If bond yields were going higher on Friday with the market lower, how much would the INdex have dropped? That is the million-dollar question.
Rates do need to rise. But, if the Fed is not going to begin tapering (slowing bond purchases) or raising rates incrementally, what will happen with inflation?
If you hold a beach ball underwater, it eventually will pop up. You can’t keep it underwater forever.
This is food for thought as we begin the week.
While there are fundamental and valid reasons to flip and get bearish on the market here, it is most likely not the time to do so. Let’s allow the market to digest the data and see how the market behaves once buyers come back into the market. As of late Sunday night Eastern Time, we have the S&P 500 futures down 13 handles. Let’s see how this week plays out in the early going.
I have BUY opinions for:
- SPDR S&P Bank ETF (KBE) between $48.11 - $49.39/$50.00. Update 07/19: This has held well given the overall market sentiment. Always use a stop loss level that caters to your individual risk tolerance.
- Defiance Quantum ETF (QTUM) between $44.00 - $49.50. Update 07/19: This one has pierced its 50-day SMA in sympathy with the broader markets. The story is good. Always use a stop loss level that caters to your individual risk tolerance.
- Amplify Transformational Data Sharing ETF (BLOK) Update 07/19: We are below the 200-day moving average ($41.84) at the moment. I have been waiting for this, but instinct tells me that Bitcoin could move lower. I want to wait another day and see what transpires. Stay tuned. Bitcoin is at an inflection point. Always use a stop loss level that caters to your individual risk tolerance.
- Invesco MSCI Sustainable Future ETF (ERTH) between $65 and $66. Update 07/19: Here we are near $65. I like this theme given the current administration. Always use a stop loss level that caters to your individual risk tolerance.
- Invesco Solar ETF (TAN) Update 07/19: Getting close to the 50-day MA of $80.45. If not on board, wait for a pullback; this one can move erratically in both directions. It seems to have a strange correlation to the overall equity market direction on some days. Targeting $100 - $125. Always use a stop loss level that caters to your individual risk tolerance.
I have SELL opinions for:
- iShares 20 Plus Year Treasury Bond ETF (TLT) when $TNX trades 1.291% or at the 200-day moving average of TLT ($148.47) / $147.75 - $148.47. Risk to 2nd sequential daily close above $153.16. Update 07/15: Bonds went from looking amazing on Wednesday’s close to not looking great at the moment due the Fed’s 2 day testimony appearing to be dovish. While concerning, let’s stick to our original plan and remove the emotion from the trade. I hate to let a winning trade turn negative, but it does happen - and this happened quickly thanks to the Powell testimony. Update 07/19: Let’s see if interest rates become rational early this week. Always use a stop loss level that caters to your individual risk tolerance.
I have a HOLD opinion for:
- First Trust NASDAQ Clean Edge Smart Grid Infrastructure Index Fund (GRID). Update 07/19: No change in sentiment. This has been a favorite. I have moved it to hold, as I do not suggest chasing it here. This has been a buy opinion from the May 6th publication between $86.91 - $88.17 Hold longs. I have liked this one for a longer-term-swing trade or longer-term holding, and am looking for signs to ring the register. Today, we are trading $94.41 the last time I checked, and I think it has a little more gas in the tank. Stay tuned. Always use a stop loss level that caters to your individual risk tolerance.
- Invesco Exchange-Traded Fund Trust - S&P SmallCap 600 Pure Value ETF (RZV) on pullbacks. Update 07/19: I suspect that if the overall market gets a bid, the small-caps could lead the way. Always use a stop loss level that caters to your individual risk tolerance.
- iShares Global Timber & Forestry ETF (WOOD) Update 7/19: No change in sentiment. Given the plummet in lumber, let’s just hold here. This one can be good for diversification, if nothing else, for now. See the June 16th publication to consider the first tranche of buying between $86.50 and $87.50. Look to add the 2nd tranche between $81.62 (200-day SMA) and $80.00. We are trading at $89.39 (last time I checked). Always use a stop loss level that caters to your individual risk tolerance.
Thanks for reading today’s Stock Trading Alert. Your readership is valued and appreciated. Have a great day!
Thank you,
Rafael Zorabedian
Stock Trading Strategist

