

Briefly:
Intraday trade: Our Monday's intraday outlook was neutral. It proved accurate, because the S&P 500 index gained 0.1% after opening 0.2% higher. The stock market may continue to fluctuate today, as there may be some more short-term profit-taking action following last week's move up. We prefer to be out of the market, avoiding low risk/reward ratio trades.
Medium-term trade: In our opinion, no medium-term positions are justified.
Our intraday outlook is neutral. Our short-term outlook is neutral, and our medium-term outlook is neutral:
Intraday outlook (next 24 hours): neutral
Short-term outlook (next 1-2 weeks): neutral
Medium-term outlook (next 1-3 months): neutral
The U.S. stock market indexes gained 0.1-0.3% on Monday, as investors hesitated following last week's run-up. The S&P 500 index slightly extended its short-term uptrend and got closer to 2,750 mark yesterday. It currently trades 5.0% below January 26 record high of 2,872.87. The Dow Jones Industrial Average gained 0.3%, and the technology Nasdaq Composite gained 0.1% on Monday.
The nearest important level of resistance of the S&P 500 index remains at around 2,740-2,750, marked by mid-March local high. The next resistance level is at 2,780-2,800, marked by some previous local highs. On the other hand, support level is at around 2,720-2,725, and the next support level is at 2,700-2,705, marked by recent resistance level and Thursday's daily gap up of 2,701.27-2,704.54.
The broad stock market extended its short-term uptrend last week week, as the S&P 500 index broke above the level of 2,700 again. Will this run-up continue towards 2,800? There are still two possible medium-term scenarios - bearish that will lead us below February low following trend line breakdown, and the bullish one in a form of medium-term double top pattern or breakout towards 3,000 mark. There is also a chance that the market will just go sideways for some time, and that would be positive for bulls in the long run (some kind of an extended flat correction):
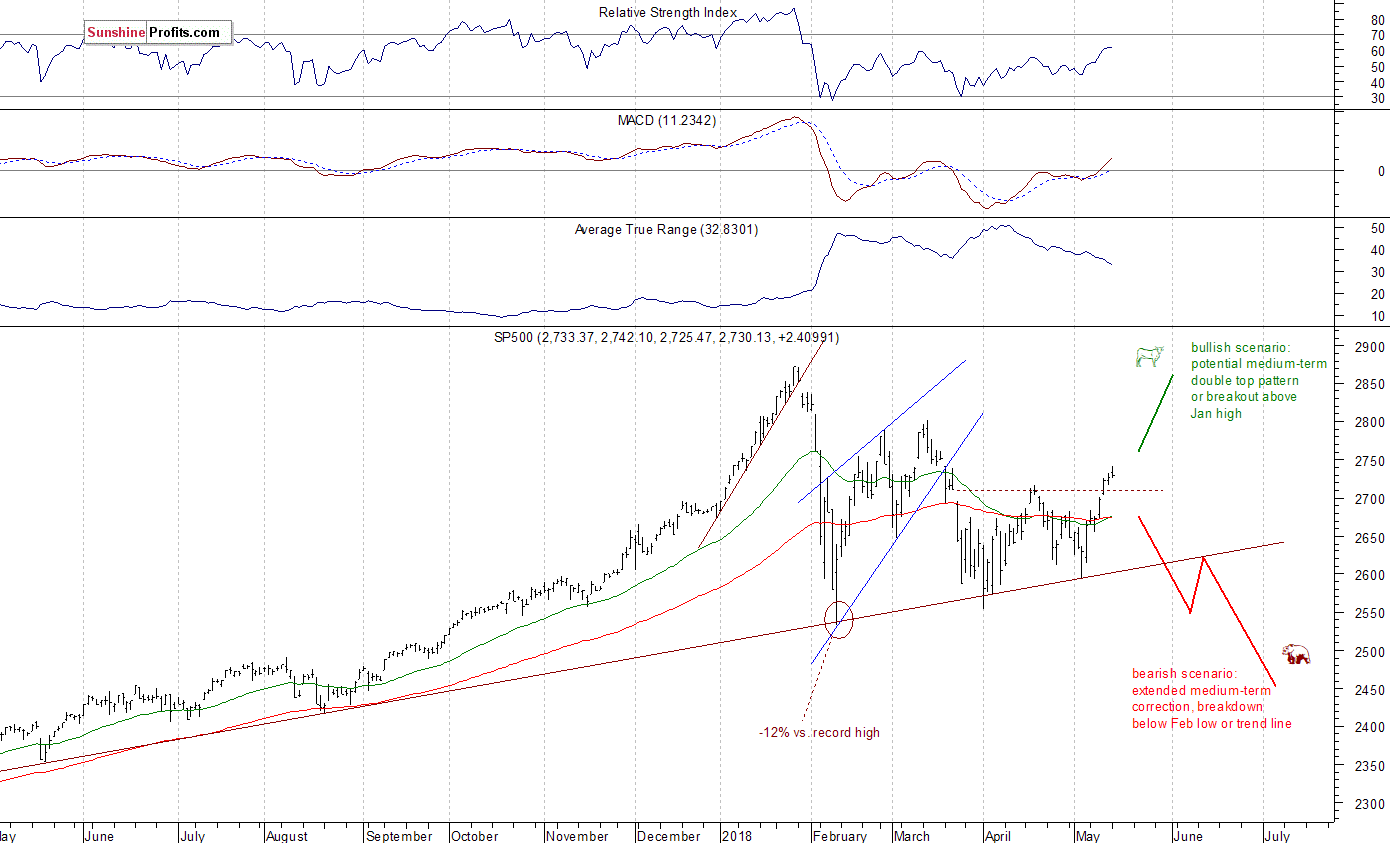
Just Correction?
Expectations before the opening of today's trading session are slightly negative, because the index futures contracts trade 0.1-0.2% below their yesterday's closing prices. The main European stock market indexes have been mixed so far. Investors will now wait for series of economic data announcements: Retail Sales, Empire State Manufacturing Index at 8:30 a.m., Business Inventories, NAHB Housing Market Index at 10:00 a.m. The broad stock market will likely retrace some of its Friday's and Monday's move up today. But will the uptrend reverse? Probably not. For now, it looks like some relatively flat correction. There have been no confirmed negative signals so far.
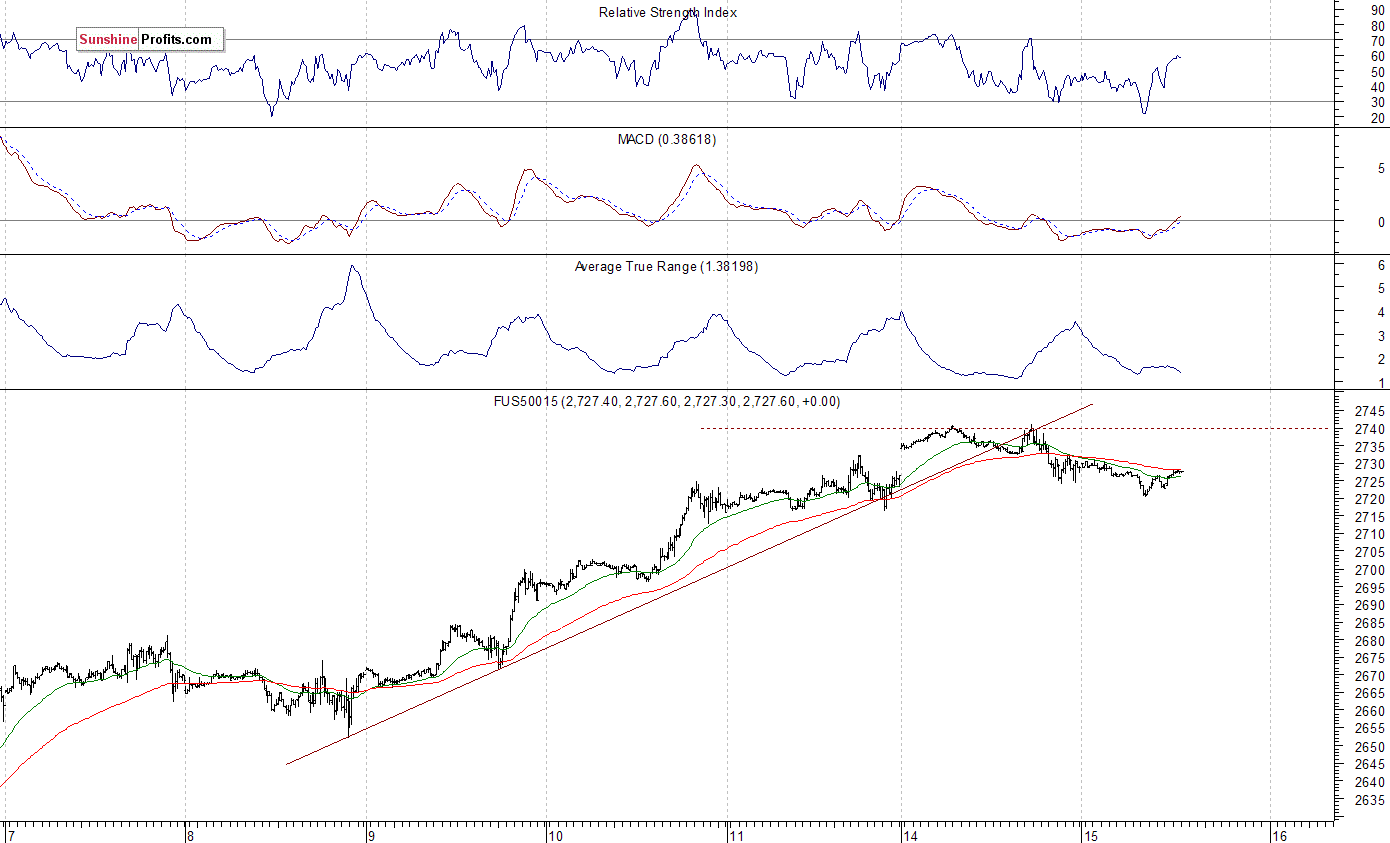
The S&P 500 futures contract trades within an intraday consolidation following overnight weakness. The market bounced off resistance level at around 2,740 recently. On the other hand, level of support is at around 2,720-2,725, marked by short-term local lows. The next support level is at 2,700-2,710, among others. The futures contract broke below short-term upward trend line after bouncing off resistance level, as the 15-minute chart shows:
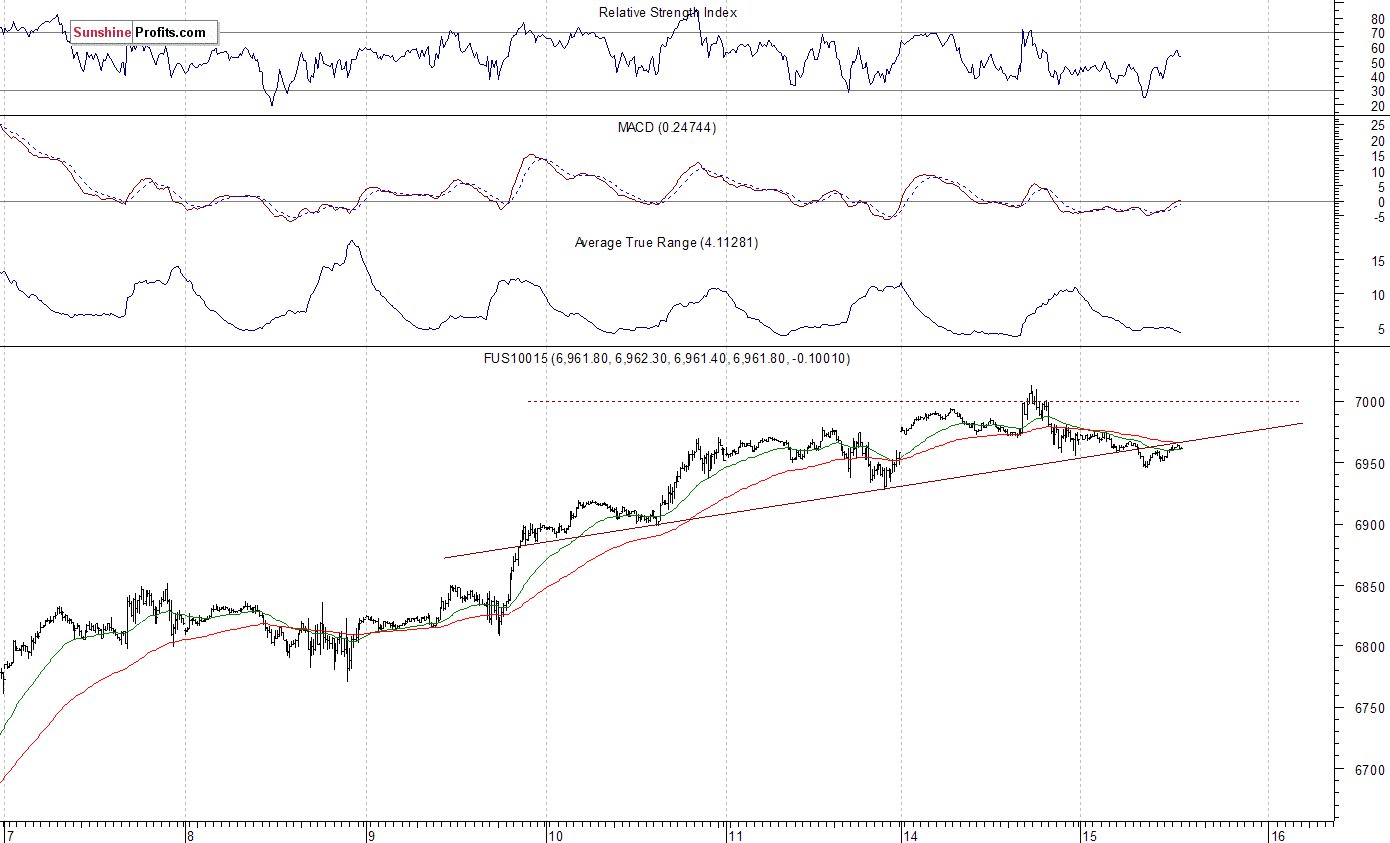
Nasdaq Fluctuates Below 7,000 Mark
The technology Nasdaq 100 futures contract follows a similar path, as it trades within an intraday consolidation. The market bounced off resistance level of 7,000 yesterday, and it currently trades along the level of 6,950. It continued its uptrend recently after rebounding off 6,500 mark more than a week ago. The nearest important support level is at 6,930-6,950, marked by recent local lows. The support level is also at 6,700. The Nasdaq futures contract trades below its short-term upward trend line, as we can see on the 15-minute chart:
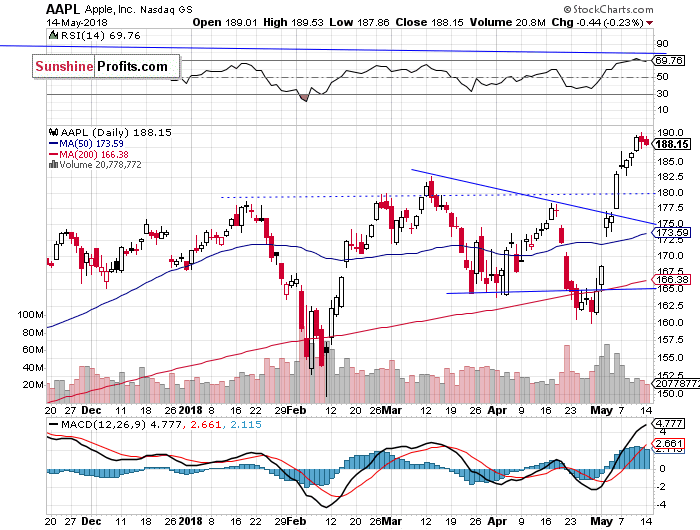
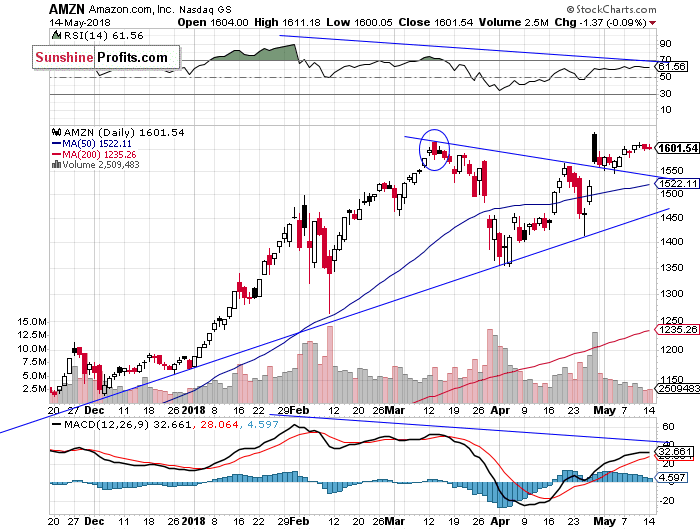
Apple, Amazon Going Sideways
Let's take a look at Apple, Inc. stock (AAPL) daily chart (chart courtesy of http://stockcharts.com). It reached new record high on Friday, as it slightly extended its short-term uptrend. The price got closer to potential resistance level of around $190-200. There have been no confirmed negative signals so far. But will it continue even higher? There are some short-term technical overbought conditions:
Now let's take a look at Amazon.com, Inc. stock (AMZN) daily chart. The price reached new record high in the late April, as investors reacted to better-than-expected quarterly earnings release. Then, on the same trading day it sold off below $1,600. Was this a downward reversal or just correction following breakout higher? The recent price action looks pretty bullish, as price gets back to the all-time high level. But will it continue higher? There seems to be some short-term uncertainty:
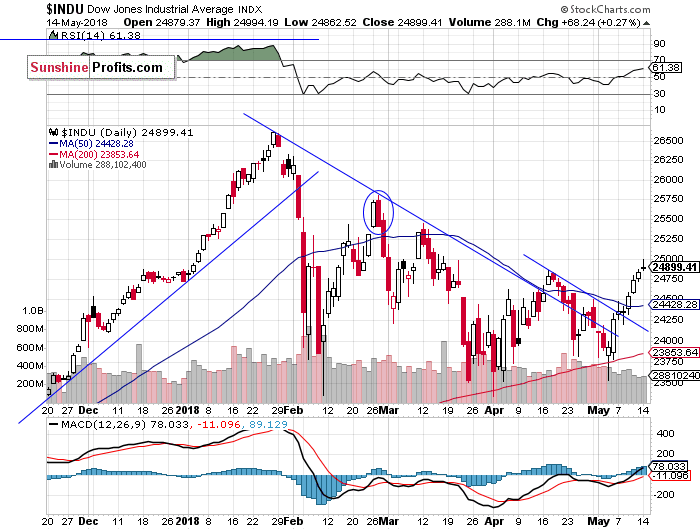
Dow Jones Bounces Off 25,000 Mark
The Dow Jones Industrial Average broke above its medium-term downward trend line recently. Then it continued higher above a few-week-long downward trend line. It is currently at the resistance area of 24,800-25,000. There may be some short-term fluctuations, as investors take short-term profits off the table. However, there have been no confirmed negative signals so far:
The broad stock market is the highest since March 21, following S&P 500 index breakout above 2,700 mark. It is still just medium-term consolidation after the early February sell-off, but bulls are much happier than at the beginning of the month. Just like we wrote in our several Stocks Trading Alerts, the early February sell-off set the negative tone for weeks or months to come. Stocks rallied on better-than-expected big cap tech companies' earnings releases recently, but they came back lower after the May 2 FOMC Statement release. They resumed their uptrend more than a week ago on Friday, following monthly jobs data release, Apple's stock price rally. The market continued higher last week, as it got closer to relatively important mid-March local highs (2,801.90 in case of S&P 500 index).
Concluding, the S&P 500 index is likely to extend its short-term fluctuations following last week's rally. We may see some profit-taking action, but there have been no confirmed negative signals so far. It doesn't look like downward reversal yet.
Currently, we prefer to be out of the market, avoiding low risk/reward ratio medium-term trades. We will let you know when we think it is safe to get back in the market.
To summarize: no medium-term positions are justified from the risk/reward perspective at this moment.
Intraday trade:
No intraday position is justified from the risk/reward perspective today.
No medium-term position is justified from the risk/reward perspective at this moment.
Thank you.
Paul Rejczak
Stock Trading Strategist
Stock Trading Alerts

