

Briefly:
Intraday trade: The S&P 500 index lost 0.2% after opening virtually flat on Thursday. The broad stock market will probably open slightly higher today. We may see more short-term uncertainty, as stocks trade close to their medium-term resistance level. We prefer to be out of the market, avoiding low risk/reward ratio trades.
Trading position (short-term; our opinion): short positions in the S&P 500 Index (opened at the level of 2,810 on July the 30th) with a stop-loss order at 2,875 and the initial downside target at 2,768 are justified from the risk/reward perspective.
Our intraday outlook is neutral. Our short-term outlook is bearish, and our medium-term outlook is neutral:
Intraday outlook (next 24 hours): neutral
Short-term outlook (next 1-2 weeks): bearish
Medium-term outlook (next 1-3 months): neutral
The U.S. stock market indexes lost 0.1-0.3% on Thursday, as investors took some profits off the table following the recent record-breaking advance. The S&P 500 index extended its short-term consolidation after reaching Tuesday's new record high of 2,873.23. The Dow Jones Industrial Average lost 0.3% and the technology Nasdaq Composite lost 0.1% on Thursday.
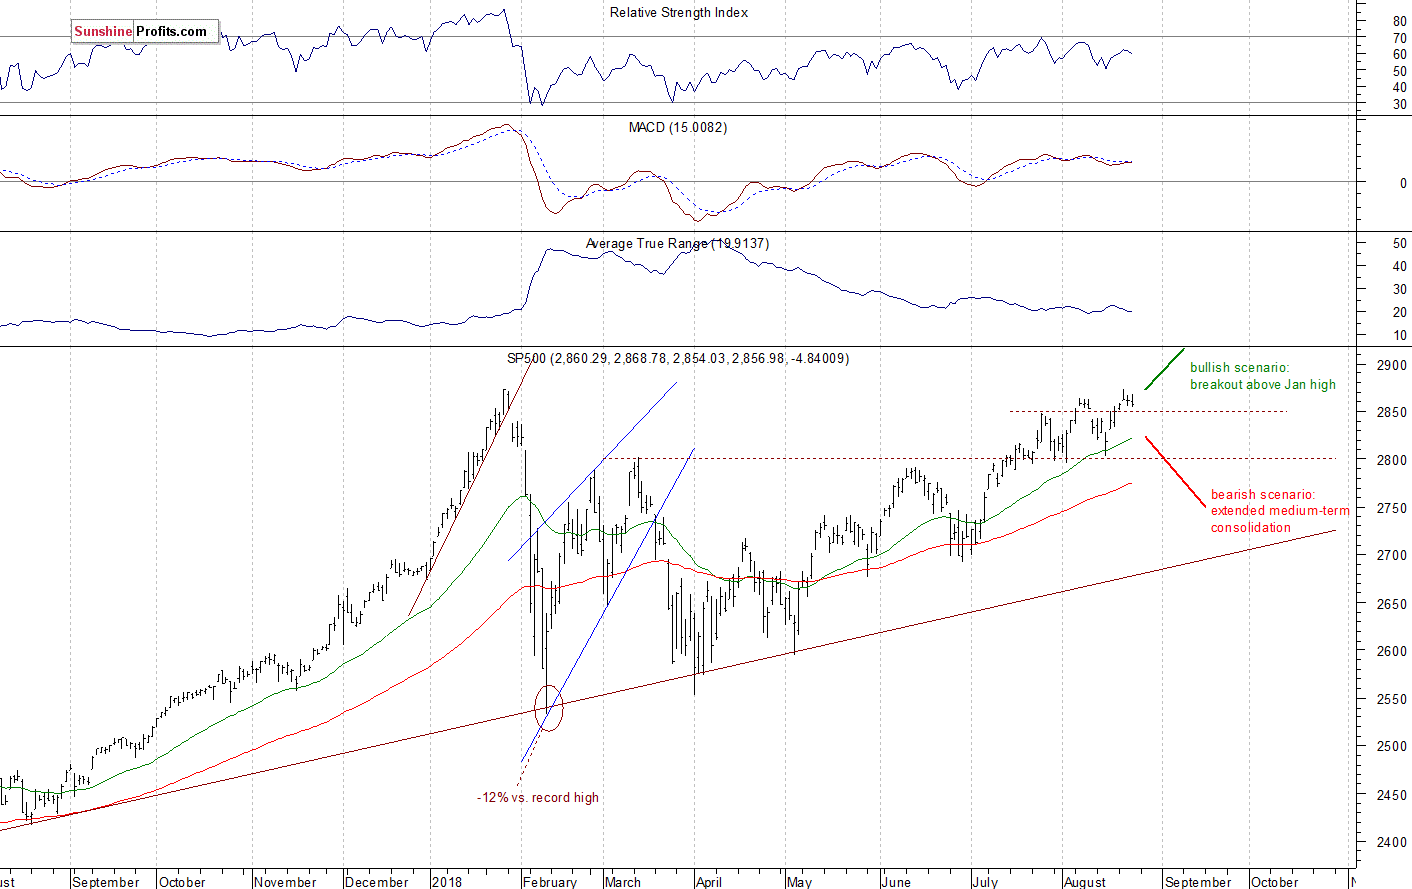
The nearest important level of support of the S&P 500 index is now at around 2,850, marked by the previous level of resistance. The next support level is at 2,830-2,835, marked by some short-term local lows. The support level is also at 2,825-2,830, marked by the last Thursday's daily gap up of 2,827.95-2,831.44. On the other hand, the resistance level is at 2,870-2,875, marked by the record high. Potential resistance level is also at 2,900.
The broad stock market reached the new record high on Tuesday, as it broke slightly above its late January high. Will the S&P 500 index continue higher? There are still two possible medium-term scenarios - bearish that will lead us towards the February low again, and the bullish one - breakout higher towards 3,000 mark. The latter one got very real recently:
Short-term Consolidation, Pre-market Optimism
The index futures contracts trade 0.2-0.3% above their yesterday's closing prices. So expectations before the opening of today's trading session are positive. The main European stock market indexes have gained 0.2-0.5% so far. Investors will wait for the Durable Goods number release at 8:30 a.m., Fed Chair Powell's Speech at 10:00 a.m. The broad stock market will probably open slightly higher today. Then we may see some more short-term fluctuations following the recent run-up. There have been no confirmed negative signals so far. However, we can see some selling pressure at the medium-term resistance level.
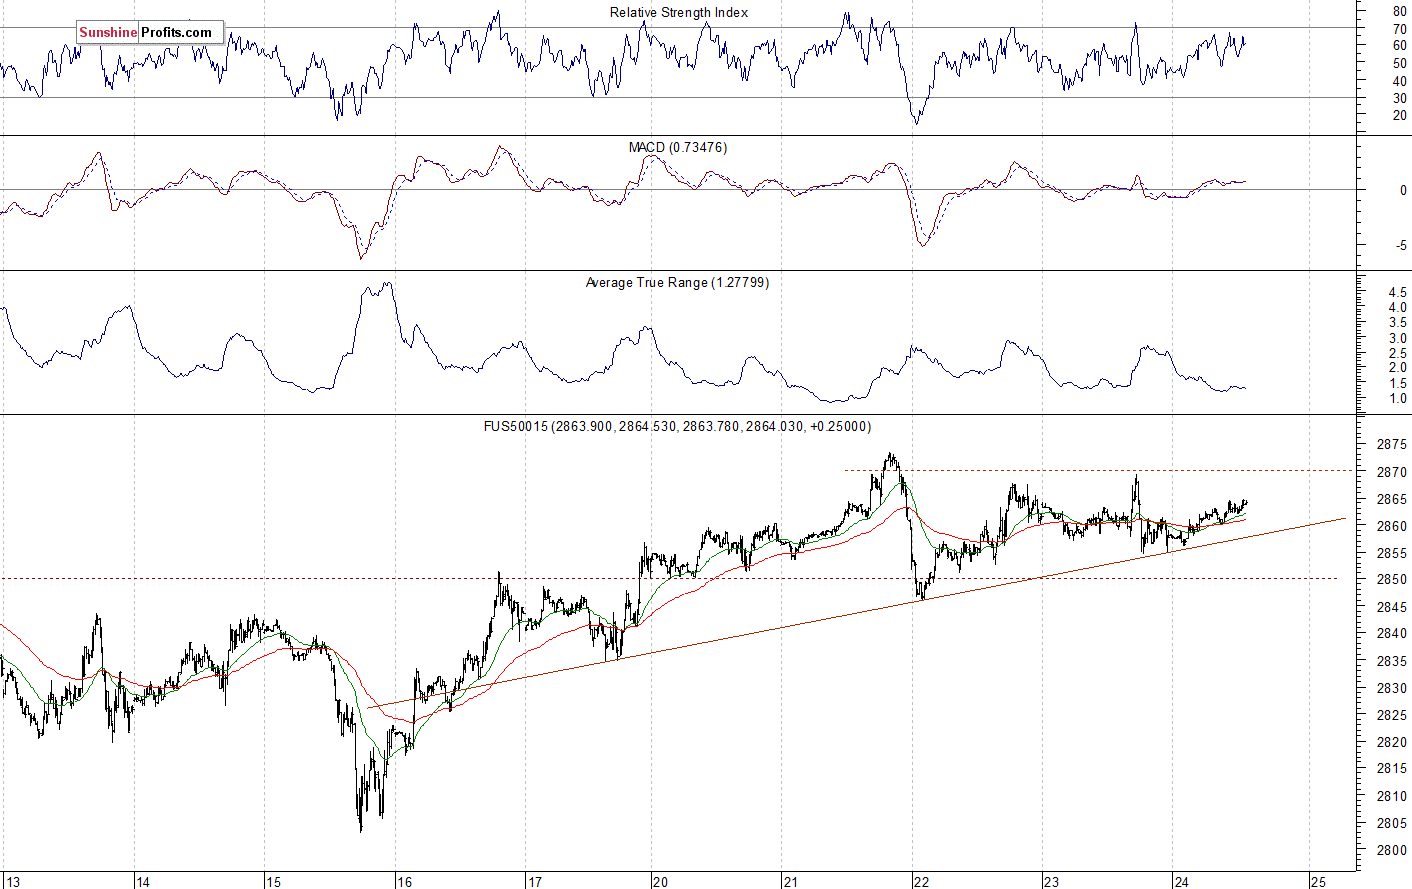
The S&P 500 futures contract trades within an intraday uptrend. The market has retraced most of its yesterday's decline and extends its short-term consolidation. The nearest important level of resistance is at around 2,870, marked by the local highs. On the other hand, support level is at 2,845-2,855, among others. The futures contract remains above its short-term upward trend line, as we can see on the 15-minute chart:
Nasdaq Still Below 7,500 Mark
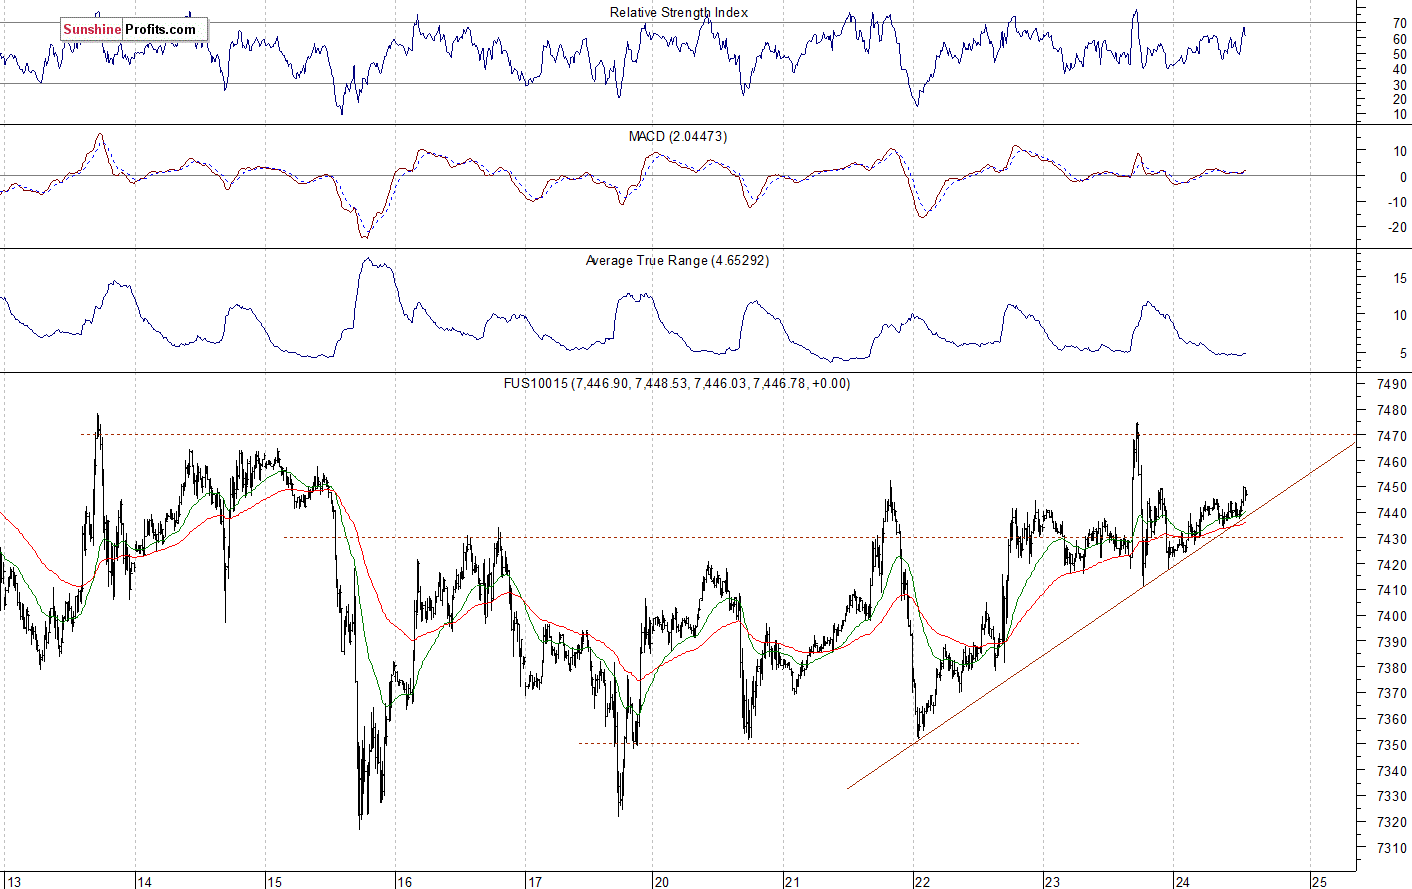
The technology Nasdaq 100 futures contract follows a similar path, as it retraces its yesterday's intraday decline. The market continues to trade above 7,400 mark. The nearest important level of resistance is at around 7,470-7,500. The next resistance level is at 7,530, marked by the record high. On the other hand, level of support is at 7,400-7,420, and the next support level is at 7,350-7,370. The Nasdaq futures contract trades along its previous local highs, as the 15-minute chart shows:
Big Cap Tech Stocks' Topping Pattern?
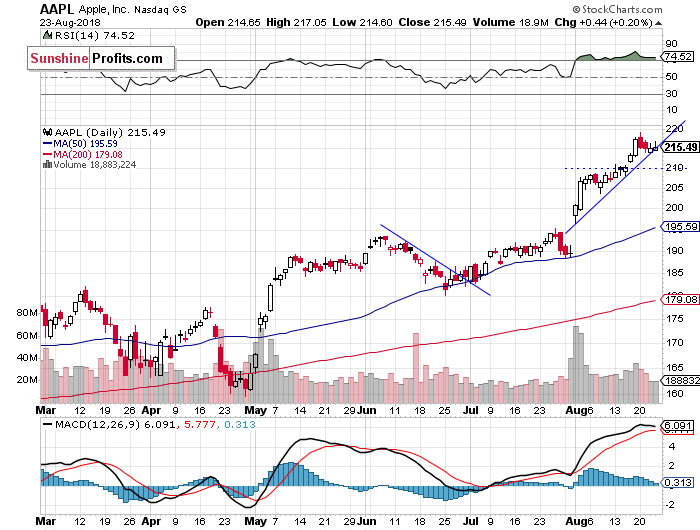
Let's take a look at Apple, Inc. stock (AAPL) daily chart (chart courtesy of http://stockcharts.com). It reached the new record high at the level of $219.18 on Monday. Since then it fluctuates. There have been no confirmed negative signals so far. However, we may see a downward correction at some point. The nearest important level of support is now at $205-210, marked by the recent consolidation. The price is at its upward trend line:
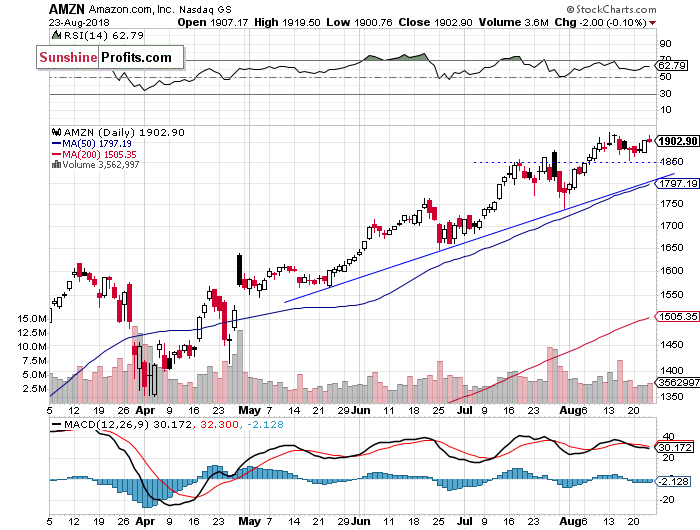
Now let's take a look at Amazon.com, Inc. stock (AMZN) daily chart. It reached the new record high in the early August at the level of $1,925.00. Since then it traded within a short-term consolidation. The stock got closer to the record high yesterday, but then it reversed its intraday advance. The nearest important level of resistance remains at around $1,925. On the other hand, support level is at $1,850:
Dow Jones Slightly Lower
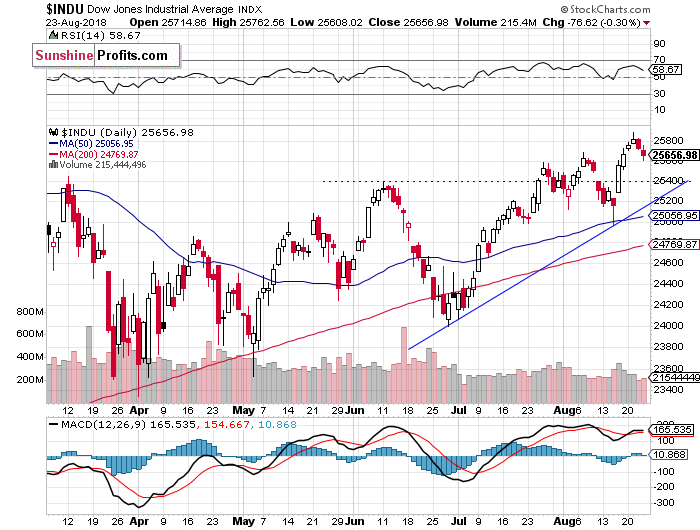
The Dow Jones Industrial Average reached the new local high on Tuesday, as it extended its last week's rally following breaking above its early August local high. The blue-chip stocks' gauge remained relatively weaker than the broad stock market yesterday, as it retraced more of its recent advance. However, there have been no confirmed negative signals so far. There are some short-term overbought conditions, so the market may fluctuate along its local highs for a while:
The S&P 500 index broke above its early August local highs of around 2,860-2,865 on Tuesday and then it reached the new record high of 2,873.23. Investors' sentiment remained pretty bullish following last Wednesday's bounce off support level of 2,800. Will stocks break higher and continue towards 3,000 mark? We may see some more short-term uncertainty along the medium-term resistance level.
Concluding, the broad stock market will likely open slightly higher today. But then we may see some more short-term uncertainty, as stocks fluctuate along their medium-term resistance level marked by the late January high. There have been no confirmed negative signals so far. Investors will wait for the Fed Chair Powell's Speech at 10:00 a.m. in Jackson Hole.
Intraday trade:
No intraday position is justified from the risk/reward perspective today.
Trading position (short-term; our opinion): short positions in the S&P 500 Index (opened at the level of 2,810 on July the 30th) with a stop-loss order at 2,875 and the initial downside target at 2,768 are justified from the risk/reward perspective.
Thank you.
Paul Rejczak
Stock Trading Strategist
Stock Trading Alerts

