

Briefly:
Intraday trade: Our Monday's intraday trading outlook was neutral. It proved wrong because the S&P 500 index lost 0.4%, following slightly higher opening of the trading session. The broad stock market reversed its pre-session intraday move up, and it lost around 0.5% off a new record high. The market may retrace more of its recent rally. Therefore, intraday short position is favored. Stop-loss is at the level of 2,585 and potential profit target is at 2,535 (S&P 500 index).
Medium-term trade: In our opinion, no medium-term positions are justified.
Our intraday outlook is bearish today. Our short-term outlook is neutral, and our medium-term outlook is neutral:
Intraday outlook (next 24 hours): bearish
Short-term outlook (next 1-2 weeks): neutral
Medium-term outlook (next 1-3 months): neutral
The U.S. stock market indexes lost 0.2-0.6% on Monday, retracing some of their recent rally, as investors took short-term profits off the table. The S&P 500 index has managed to reach yet another new record high at the level of 2,578.29 shortly after the open. The Dow Jones Industrial Average reached new all-time high at the level of 23,368.37, but it closed 0.2% lower. The technology Nasdaq Composite was relatively weaker than the broad stock market again. It reached new record high at the level of 6,641.57, before closing 0.6% lower. The nearest important level of support of the S&P 500 index is at around 2,565, marked by Friday's daily gap up of 2,562.36-2,567.56. The next support level remains at around 2,550, marked by previous level of resistance, among others. The support level is also at 2,540, marked by recent fluctuations. On the other hand, potential resistance level is at around 2,580-2,600. The S&P 500 index fluctuates following its recent run-up. Is this a topping pattern or just consolidation before another leg up? There have been no confirmed negative signals so far. However, we can see medium-term technical overbought conditions:
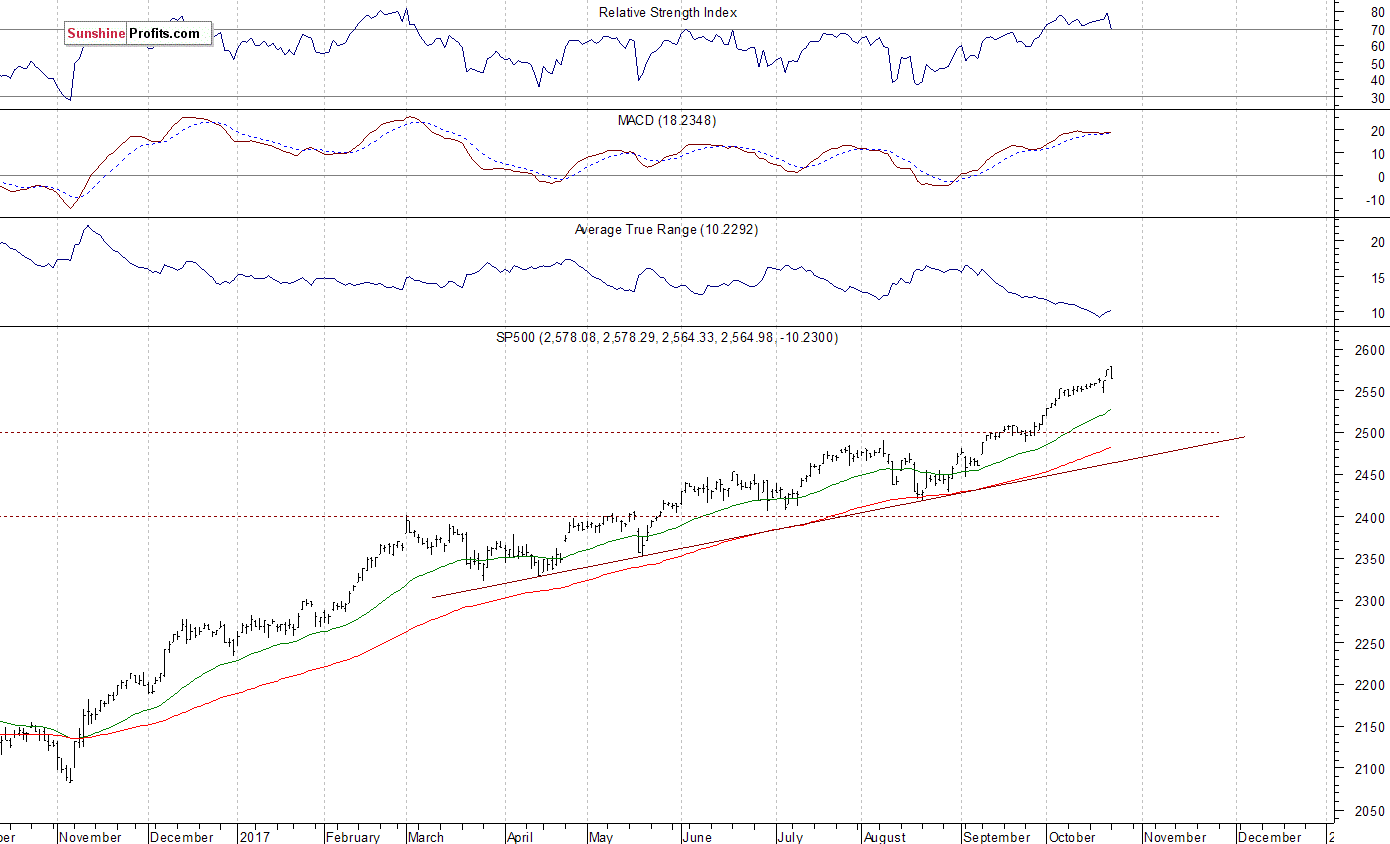
Just Correction?
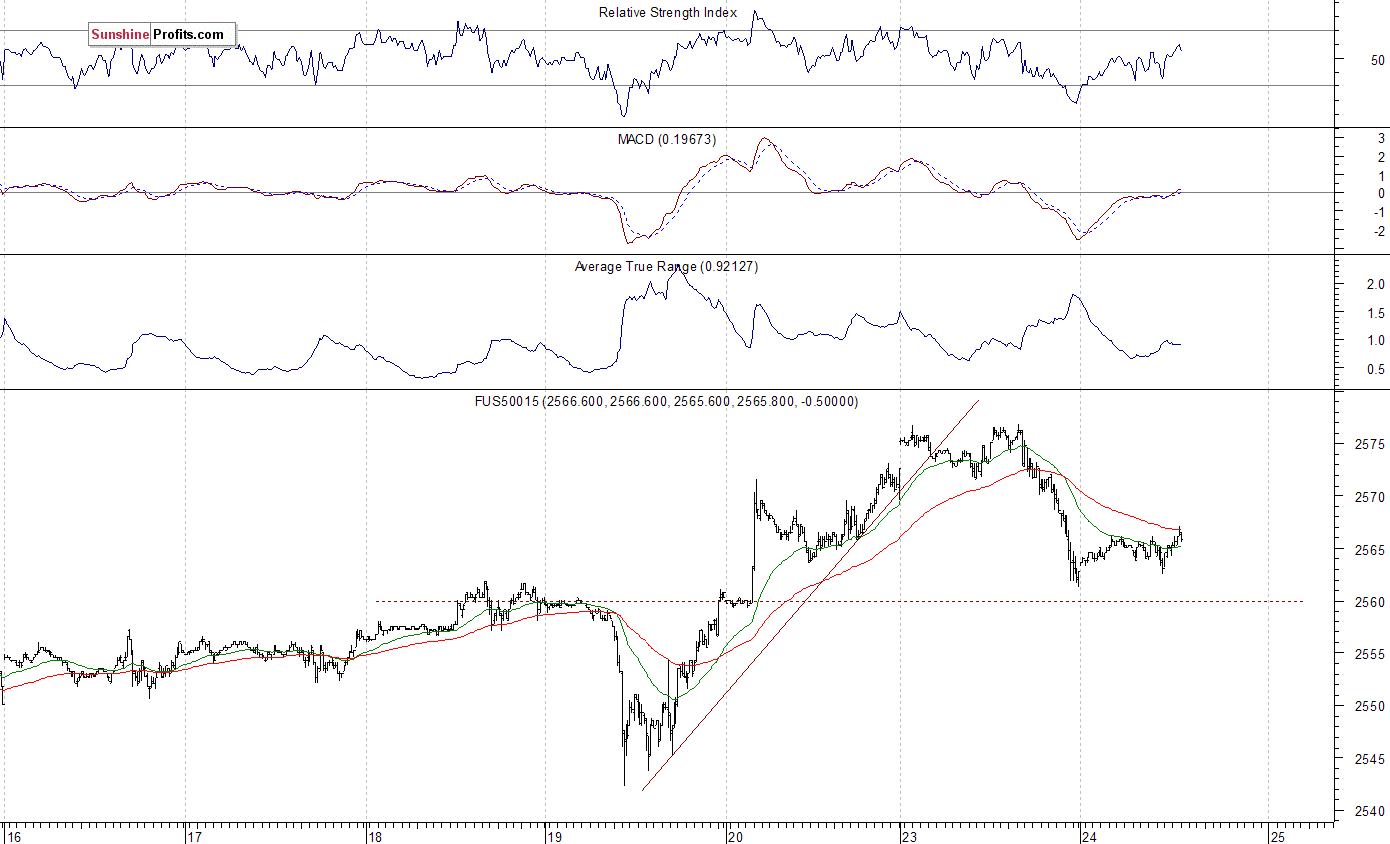
Expectations before the opening of today's trading session are positive, with index futures currently between +0.1% and +0.3% vs. Monday's closing prices. The European stock market indexes have gained 0.2-0.3% so far. Investors will now wait for some economic data announcements: Flash Manufacturing PMI at 9:45 a.m., Richmond Manufacturing Index at 10:00 a.m. The market expects that Flash PMI number was at 53.3, and Richmond Manufacturing Index was at 17 in October. Investors will also wait for quarterly corporate earnings releases. The S&P 500 futures contract trades within an intraday consolidation following yesterday's move down. It retraced some of its recent rally, following a bounce off resistance level at 2,570-2,575. The nearest important support level is now at around 2,560, marked by local lows. The next level of support is at 2,540-2,550. The futures contract remains relatively close to record high, above its support level of 2,560, as the 15-minute chart shows:
Nasdaq Relatively Weaker
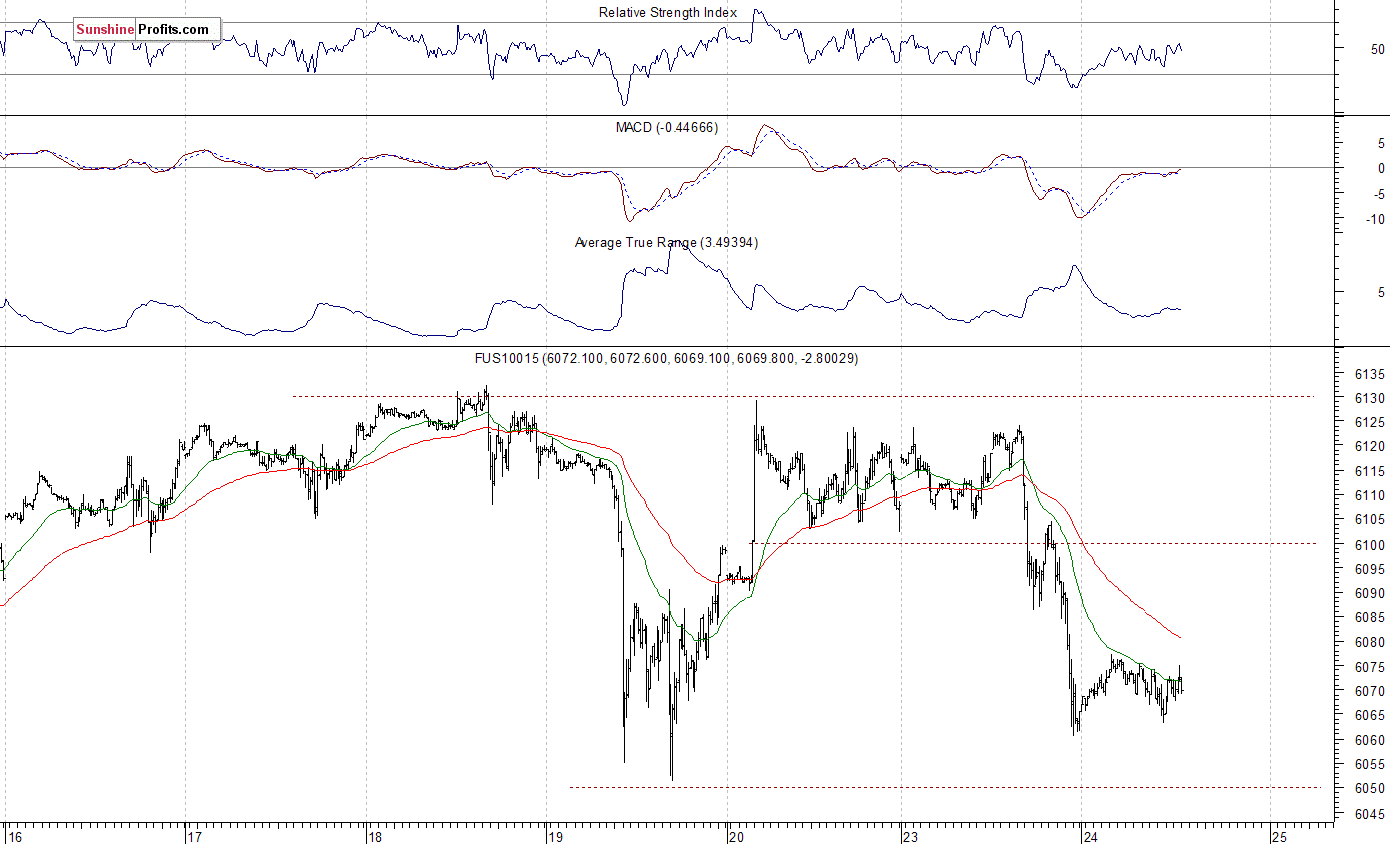
The technology Nasdaq 100 futures contract trades within a similar intraday consolidation, following yesterday's decline. The market trades close to its last week's Thursday's local lows. The nearest important level of support is at around 6,050-6,070. The next level of support is at 5,980-6,000. On the other hand, resistance level is at around 6,100, and the next level of resistance is at 6,120-6,130, marked by record high. The Nasdaq 100 futures contract trades within a week-long consolidation along 6,050-6,130, as we can see on the 15-minute chart:
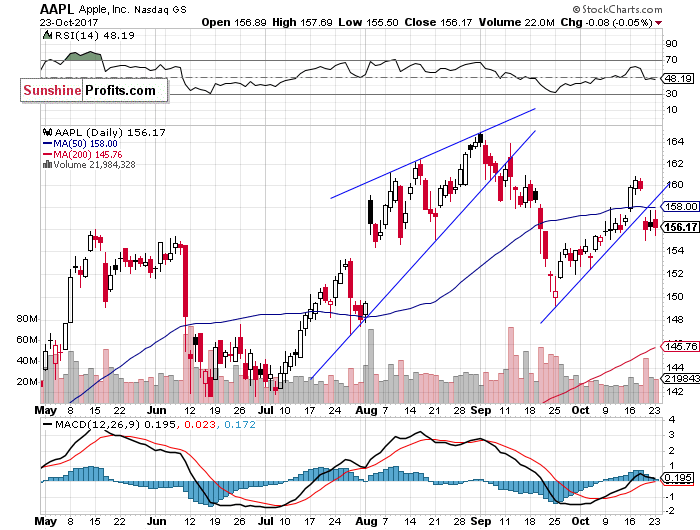
Let's take a look at Apple, Inc. stock (AAPL) daily chart (chart courtesy of http://stockcharts.com) again. The stock remains relatively weaker than record-breaking broad stock market gauges. It broke below its short-term upward trend line on Thursday, after reaching resistance level of $160. Since then it fluctuates within a short-term consolidation along the price of $156. Is this a new downtrend or just downward correction following recent advance?
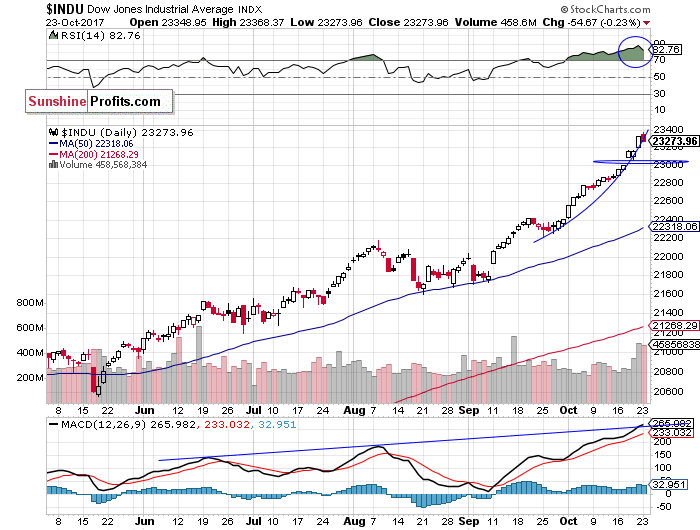
The Dow Jones Industrial Average daily chart (chart courtesy of http://stockcharts.com) shows that blue-chip index accelerated its long-term uptrend last week. We can see some clear technical overbought conditions. Is this a medium-term blow-off top pattern?
Concluding, the S&P 500 index lost 0.4% on Monday, as it retraced some of its Friday's advance. Is this an uptrend reversal or just quick downward correction? Investors will wait for quarterly corporate earnings releases. Will they drive stock prices even higher? Or is this some medium-term topping pattern before downward correction?
Currently, we prefer to be out of the market, avoiding low risk/reward ratio medium-term trades. We will let you know when we think it is safe to get back in the market.
To summarize: no medium-term positions are justified from the risk/reward perspective at this moment.
Intraday trade:
S&P 500 index - short position: profit target level: 2,535; stop-loss level: 2,585,
S&P 500 futures contract (September) - short position: profit target level: 2,532; stop-loss level: 2,582
SPY ETF (SPDR S&P 500, not leveraged) - short position: profit target level: $253.5; stop-loss level: $258.5
Medium-term trade:
No medium-term position is justified from the risk/reward perspective at this moment.
Thank you.
Paul Rejczak
Stock Trading Strategist
Stock Trading Alerts

