

Briefly:
Intraday trade: Our Friday's intraday trading outlook was neutral. It proved wrong, because the S&P 500 gained 0.7% following slightly higher opening of the trading session (+0.1%). The market continued its short-term uptrend, as it got closer to 2,800 mark. There have been no confirmed negative signals so far. We can see some clear short-term overbought conditions along with an overly bullish investors' sentiment. However, there have been no confirmed negative signals so far. Therefore, we prefer to be out of the market today, avoiding low risk/reward ratio trades.
Medium-term trade: In our opinion, no medium-term positions are justified.
Our intraday outlook is neutral today. Our short-term outlook is neutral, and our medium-term outlook is neutral:
Intraday outlook (next 24 hours): neutral
Short-term outlook (next 1-2 weeks): neutral
Medium-term outlook (next 1-3 months): neutral
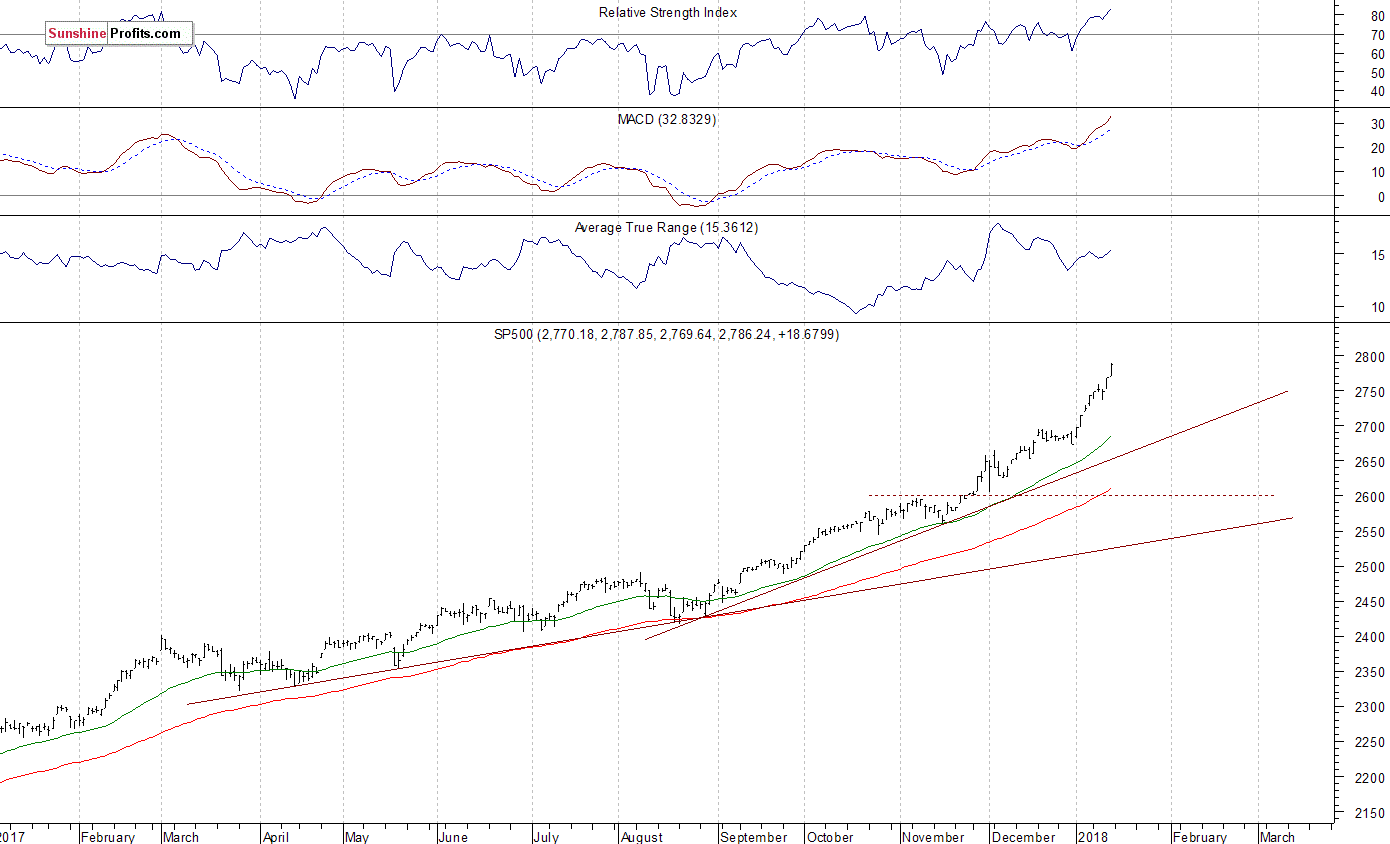
The main U.S. stock market indexes gained 0.7-0.9% on Friday, extending their uptrend, as investors' sentiment remained very bullish after last Thursday's breakout above short-term consolidation. The S&P 500 index has reached yet another new all-time high at the level of 2,787.85. The Dow Jones Industrial Average reached new record high of 25,810.43, and the technology Nasdaq Composite reached new record high at 7,265.26. The nearest important level of support of the S&P 500 index is now at 2,765-2,770, marked by Friday's daily gap up of 2,767.56-2,769.64. The next support level is at around 2,760, marked by last Tuesday's local high. The support level is also at 2,750, marked by Thursday's daily gap up of 2,750.80-2,752.78. There have been no confirmed negative signals so far. However, we still can see medium-term technical overbought conditions along with negative technical divergences:
New Record Highs
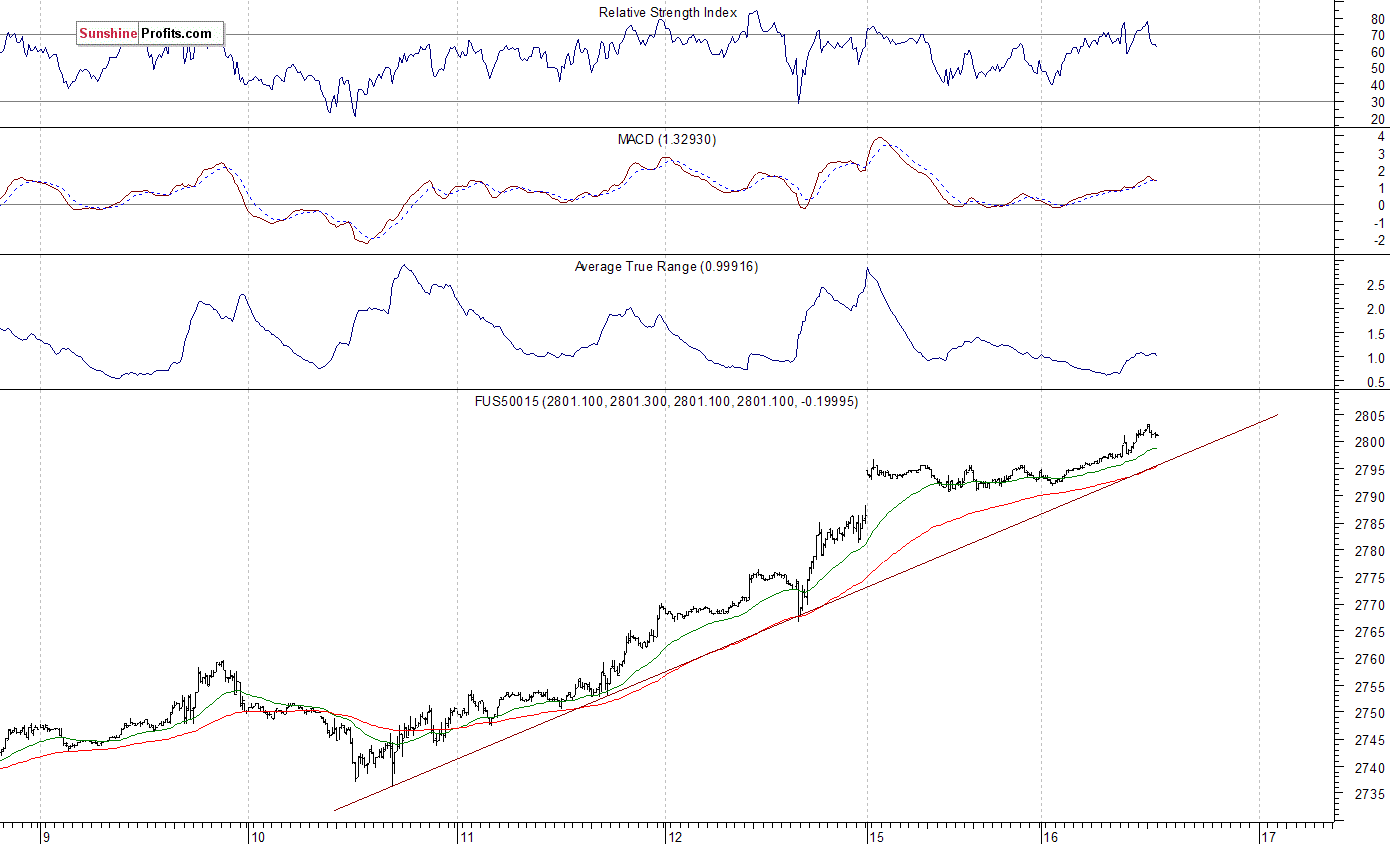
Expectations before the opening of today's trading session are positive, following long holiday weekend, with index futures currently up 0.2-0.5%. The European stock market indexes have gained 0.1-1.0% so far. Investors will wait for the Empire State Manufacturing Index announcement at 8:30 a.m. The market expects that it was at 18.5 in January. The S&P 500 futures contract trades within an intraday uptrend, as it continues its record-setting rally. The nearest important level of support is at around 2,790, marked by yesterday's intraday fluctuations. The next support level is at 2,770-2,780, marked by recent consolidation. The futures contract remains close to new record high, as the 15-minute chart shows:
Nasdaq 100 Above 6,800
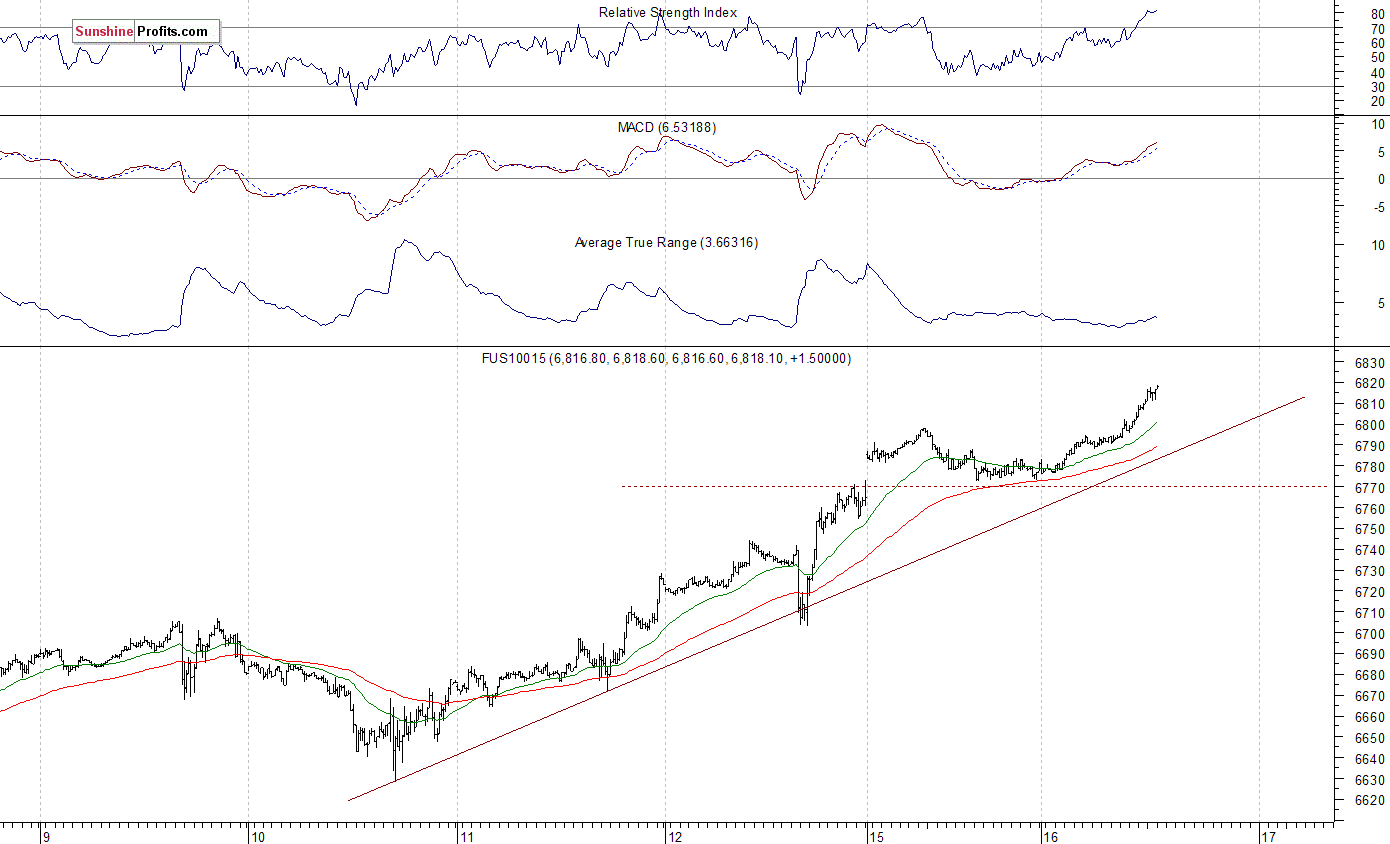
The technology Nasdaq 100 futures contract follows a similar path, as it extends its record-setting rally today. The market broke above the level of 6,800. It is currently trading at new record high. The nearest important level of support is at around 6,780-6,800, marked by previous resistance level. The support level is also at around 6,750-6,770. The Nasdaq 100 futures contract trades above its short-term upward trend line, as we can see on the 15-minute chart:
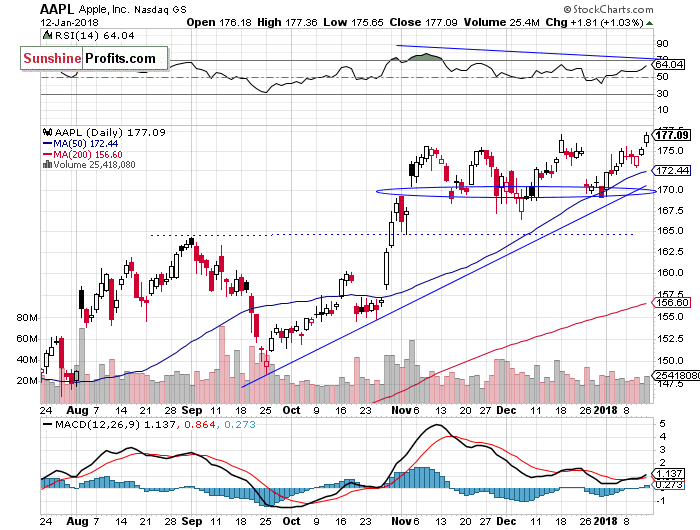
Let's take a look at Apple, Inc. stock (AAPL) daily chart (chart courtesy of http://stockcharts.com). The stock reached new record high on Friday, as it broke slightly above its December top. Will the uptrend accelerate? Or is this just another move up within two-month-long consolidation? The nearest important support level is now at around $175, marked by previous level of resistance:
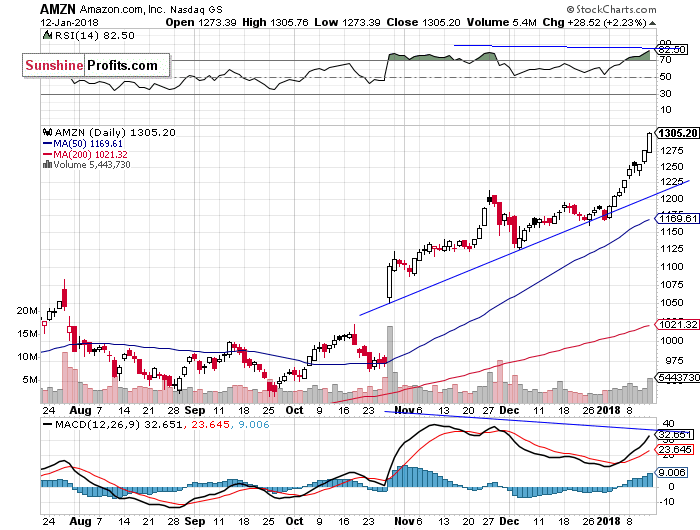
Amazon.com, Inc. stock (AMZN) remains relatively stronger than the broad stock market, as it breaks above $1,300 mark. It accelerated its uptrend on Friday. However, we can see some clear technical overbought conditions along with negative technical divergences. Will rally continue?
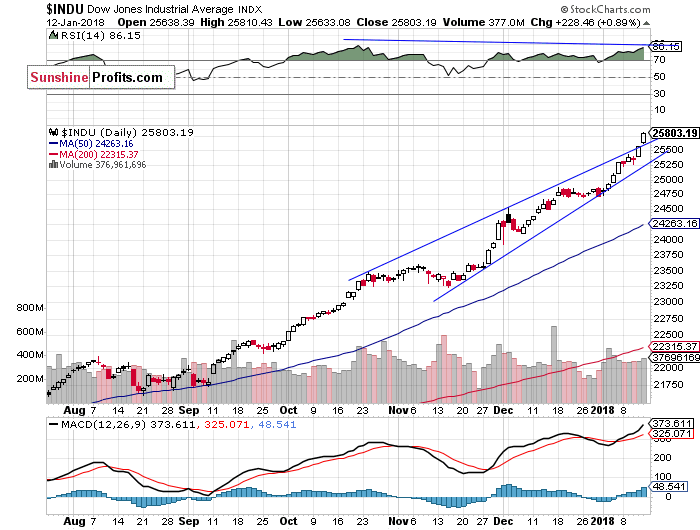
The Dow Jones Industrial Average daily chart shows that blue-chip index reaches new record highs following breakout above the level of 25,000. We still can see negative technical divergences. The most common divergences are between asset’s price and some indicator based on it (for instance the index and RSI based on the index). In this case, the divergence occurs when price forms a higher high and the indicator forms a lower high. It shows us that even though price reaches new highs, the fuel for the uptrend starts running low. The index breaks above its two-month-long rising wedge pattern. Will uptrend continue despite clear technical overbought conditions?
Concluding, the S&P 500 index continued its uptrend on Friday, as it got closer to 2,800 mark. Will uptrend extend even further ahead of quarterly corporate earnings releases? We still can see medium-term overbought conditions along with negative technical divergences. However, there have been no confirmed negative signals so far.
Currently, we prefer to be out of the market, avoiding low risk/reward ratio medium-term trades. We will let you know when we think it is safe to get back in the market.
To summarize: no medium-term positions are justified from the risk/reward perspective at this moment.
Intraday trade:
No intraday position is justified from the risk/reward perspective today.
No medium-term position is justified from the risk/reward perspective at this moment.
Thank you.
Paul Rejczak
Stock Trading Strategist
Stock Trading Alerts

