

Briefly:
Intraday trade: The S&P 500 index gained 0.3% on Tuesday, after opening 0.3% lower. The broad stock market will probably open higher today. We may see some more short-term fluctuations.
Trading position (short-term; our opinion): no positions are justified from the risk/reward perspective.
Our short-term outlook is neutral, and our medium-term outlook is neutral:
Short-term outlook (next 1-2 weeks): neutral
Medium-term outlook (next 1-3 months): neutral
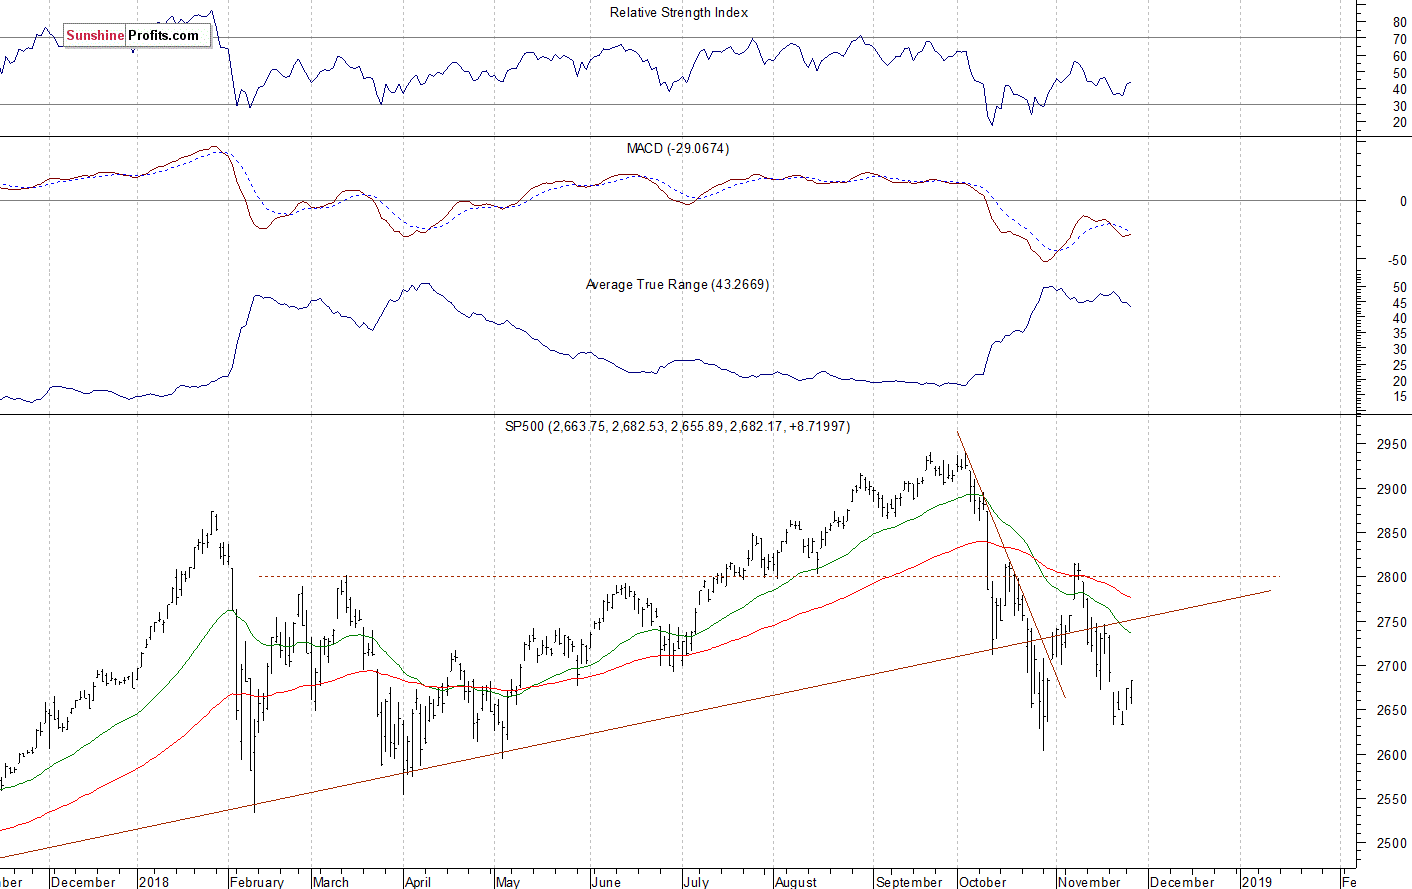
The U.S. stock market indexes were mixed between 0.0% and +0.4% on Tuesday, as investors continued to hesitate following last week's sell-off. The S&P 500 index broke slightly above its recent local highs, however, it remained below the level of 2,700. It currently trades 8.8% below September the 21st record high of 2,940.91. The Dow Jones Industrial Average gained 0.4% and the Nasdaq Composite was unchanged on Tuesday.
The nearest important level of resistance of the S&P 500 index is at 2,690-2,700, marked by the previous level of support. The resistance level is also at 2,710-2,715. On the other hand, the level of support is now at 2,645-2,650, marked by Monday's daily gap up of 2,647.55-2,649.97. The support level is also at 2,630, marked by the recent local lows.
The broad stock market got closer to its late October low recently. The S&P 500 index traded more than 10% below the record high. So will the downtrend continue? Or is this a bottoming pattern before an upward reversal? There have been no confirmed positive signals so far. The market continues to trade below its long-term upward trend line, as we can see on the daily chart:
Positive Expectations
Expectations before the opening of today's trading session are positive, because the index futures contracts trade 0.3-0.4% above their Tuesday's closing prices. The European stock market indexes have been mixed so far. Investors will wait for series of economic data announcements today: Goods Trade Balance, Wholesale Inventories at 8:30 a.m., New Home Sales, Richmond Manufacturing Index at 10:00 a.m., Crude Oil Inventories at 10:30 a.m. The broad stock market will likely slightly extend its recent rebound. If the market breaks above the resistance level of around 2,700, we could see more buying pressure.
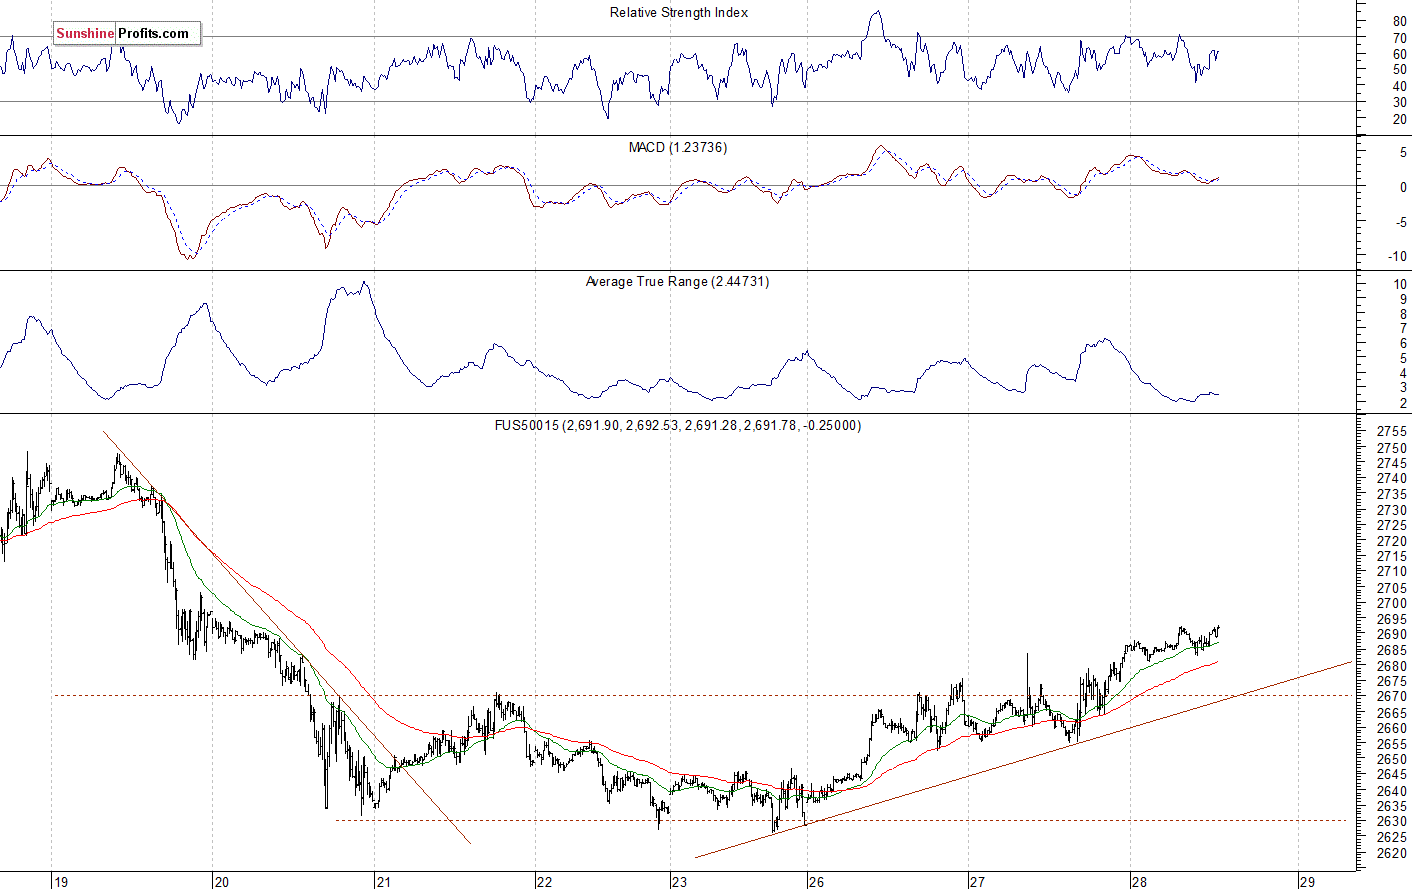
The S&P 500 futures contract trades within an intraday uptrend. It gets closer to the resistance level of 2,700 this mornings. On the other hand, the support level remains at 2,650-2,660, marked by the recent local lows. The futures contract trades above its short-term upward trend line, as the 15-minute chart shows:
Nasdaq Also Higher
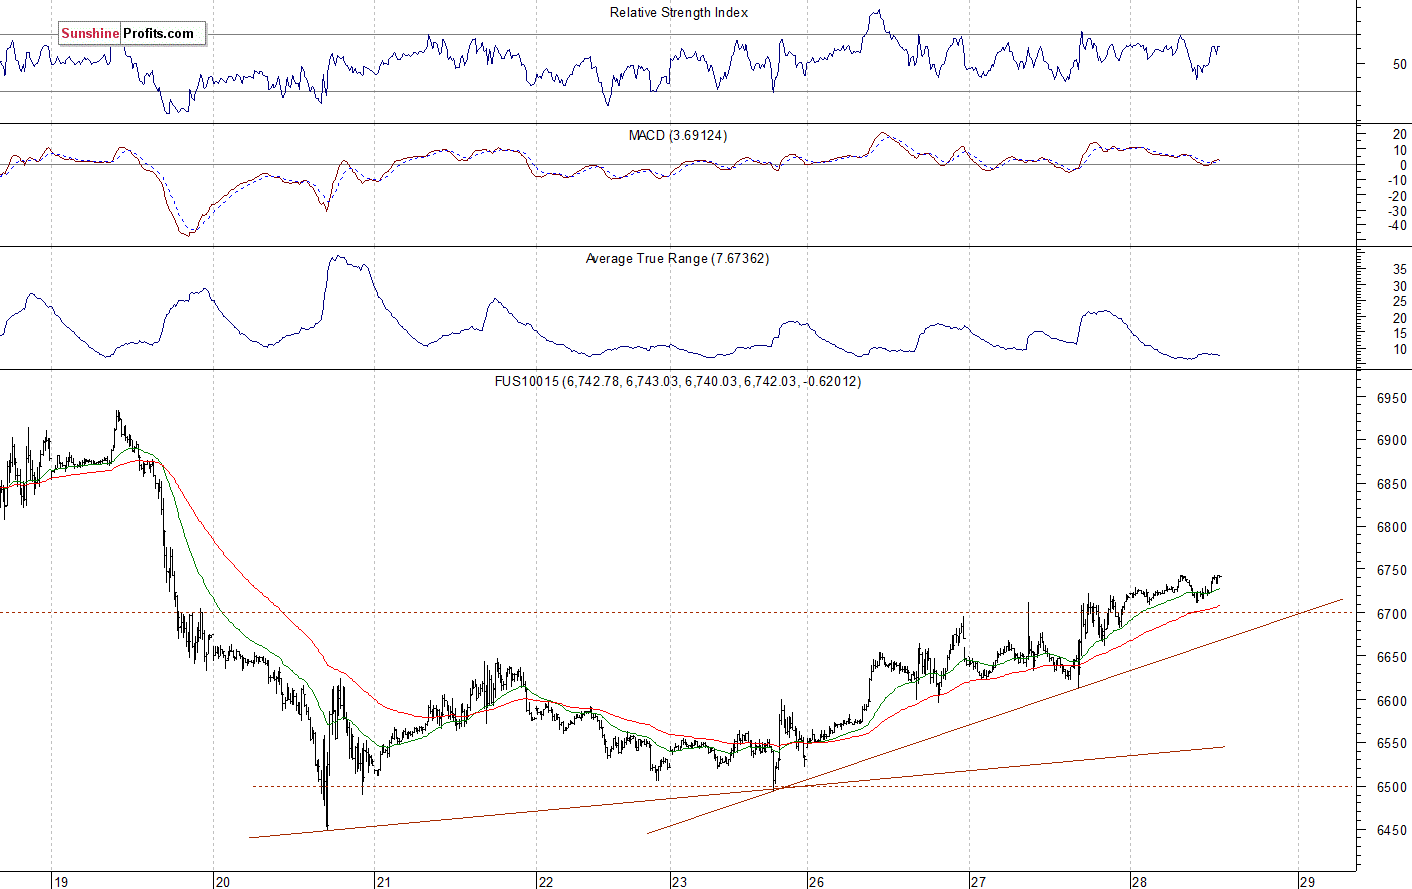
The technology Nasdaq 100 futures contract follows a similar path, as it trades within an intraday uptrend. The tech stocks' gauge accelerated its downtrend on Tuesday a week ago and it reached the new low of around 6,450. It was the lowest since the late April. Then the market fluctuated along the level of 6,500-6,550. And now it is trading above 6,700 mark. The Nasdaq futures contract is above its recent trading range, as we can see on the 15-minute chart:
Apple's Consolidation, Amazon's Rebound
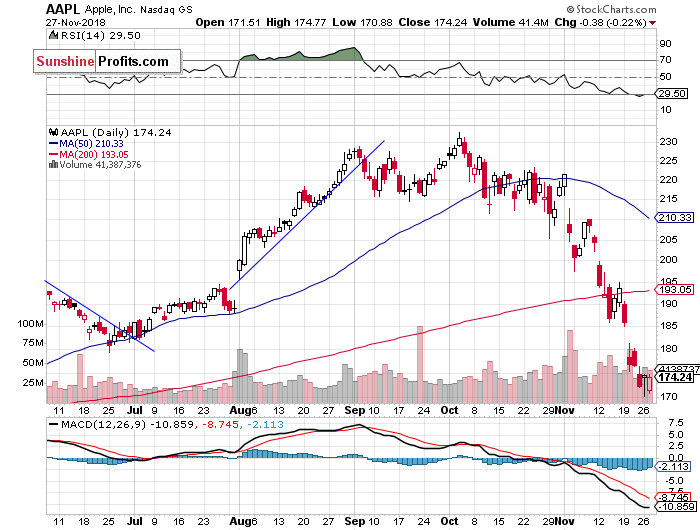
Let's take a look at Apple, Inc. stock (AAPL) daily chart (chart courtesy of http://stockcharts.com). The stock accelerated its sell-off on Friday following Tuesday's breakdown below the support level of $185-190. It fell closer to $170 on Monday. The market may have reached a temporary bottom of around $170-175. However, there still have been no confirmed positive signals so far:
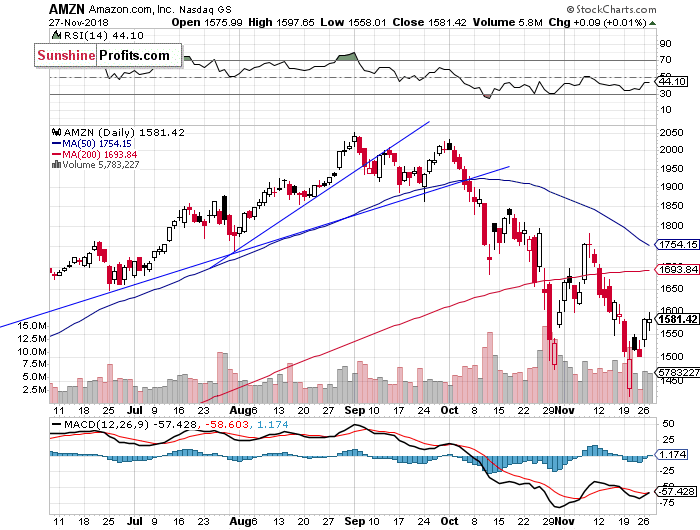
Now let's take a look at Amazon.com, Inc. stock (AMZN) daily chart. It remains relatively stronger, as it retraces the recent sell-off. On Tuesday a week ago, the stock fell closer to the price of $1,400, before rebounding off the support level. Was it an upward reversal? The market got back above the resistance level of $1,500:
Dow Jones at Resistance Level
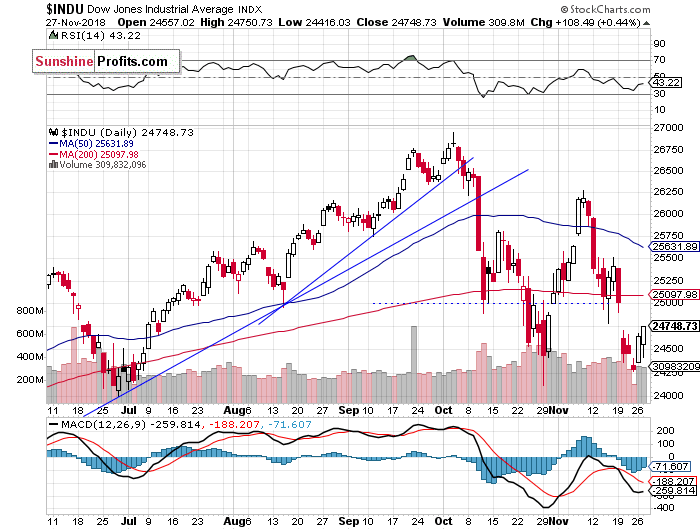
The Dow Jones Industrial Average broke below 25,000 mark on Tuesday a week ago and then it fluctuated along the late October low and the support level of 24,000-24,200. Will it break below that support level? The resistance level is now at 24,750-25,000, and the market got back to that resistance level yesterday:
The S&P 500 index retraced most of its recent sell-off, but it remains below the level of 2,700. We still can see some short-term oversold conditions that may lead to an upward correction. However, there have been no confirmed positive signals so far.
Concluding, the S&P 500 index will likely open higher today. For now, it looks like an upward correction following last week's decline. If the market breaks above the resistance level of around 2,700, we could see more buying pressure.
Trading position (short-term; our opinion): no positions are justified from the risk/reward perspective.
Thank you.
Paul Rejczak
Stock Trading Strategist
Stock Trading Alerts

