

Briefly:
Intraday trade: The S&P 500 gained 0.9% on Thursday, after opening 1.0% lower. The market will probably open higher today. We may see more short-term volatility following the recent sell-off.
Trading position (short-term; our opinion): no positions are justified from the risk/reward perspective.
Our short-term outlook is neutral, and our medium-term outlook is neutral:
Short-term outlook (next 1-2 weeks): neutral
Medium-term outlook (next 1-3 months): neutral
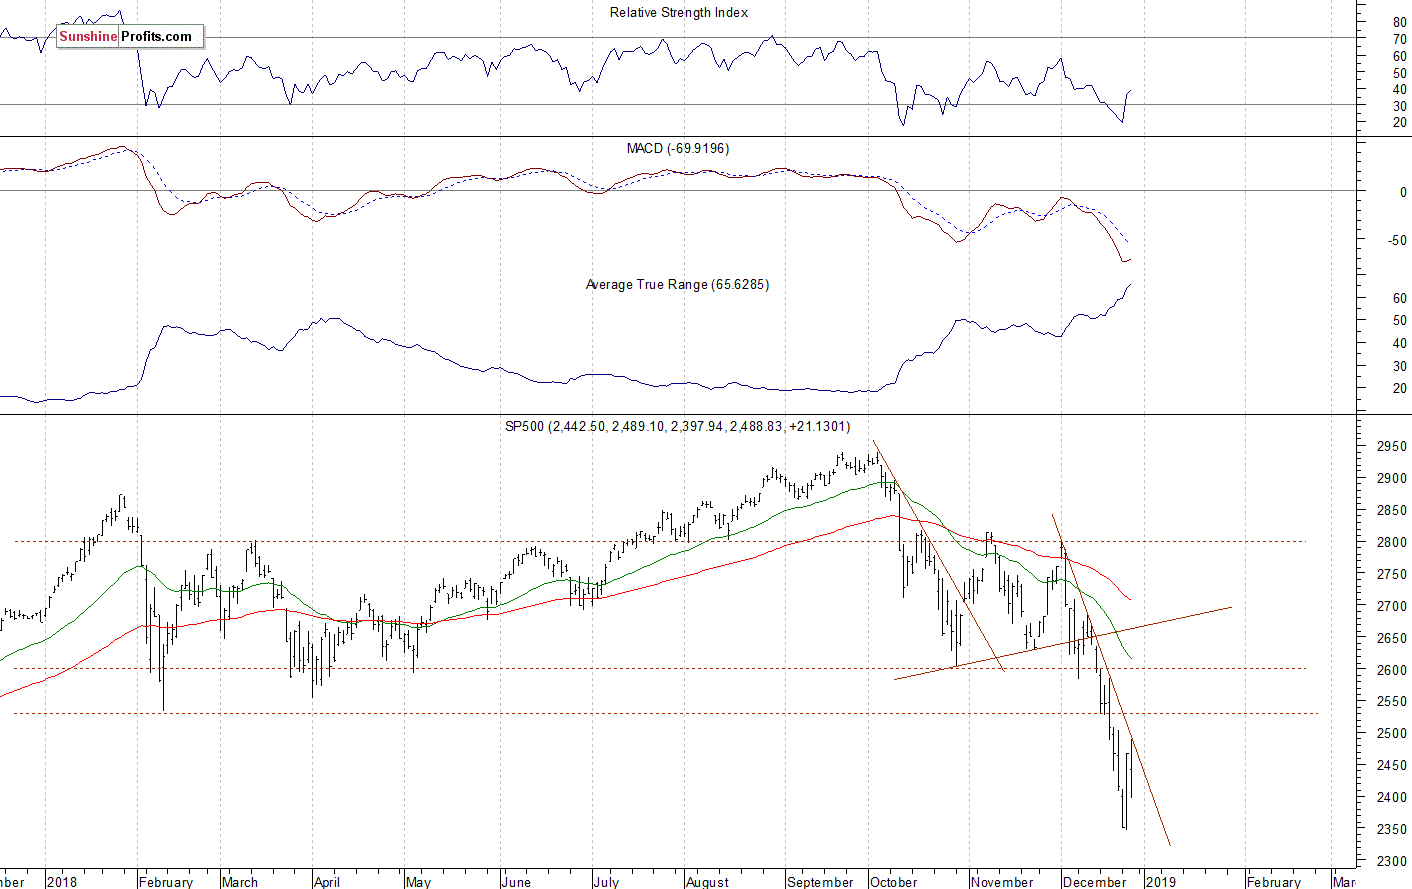
The U.S. stock market indexes gained 0.4-1.1% on Thursday, as they retraced more of their recent sell-off. The S&P 500 index fell the lowest since the late April of 2017 and it traded 20.2% below September the 21st record high of 2,940.91 on Wednesday when it reached the new medium-term low of 2,346.58. Then the market rallied and got closer to 2,500 mark. The Dow Jones Industrial Average gained 1.1% and the Nasdaq Composite gained 0.4% on Thursday.
The nearest important level of resistance of the S&P 500 index is now at around 2,500, marked by the recent local highs. The resistance level is also at 2,530. On the other hand, the support level is at 2,400-2,420, among others.
The broad stock market broke below its two-month-long trading range recently, as the S&P 500 index fell below the level of 2,600. Then the market accelerated lower and it broke below the level of 2,400 on Monday. The downward correction reached 20.2% from the September all-time high, surpassing January-February correction of around 12%. Is this a long-term bear market? It still looks like a medium-term downward correction, but the index remains below the recent consolidation, as we can see on the daily chart:
Positive Expectations
Expectations before the opening of today's trading session are positive, because the index futures contracts trade 0.4-0.5% above their yesterday's closing prices. The European stock market indexes have gained 1.6-1.9% so far. Investors will wait for some economic data announcements today: Chicago PMI number at 9:45 a.m., Pending Home Sales at 10:00 a.m., Crude Oil Inventories at 11:00 a.m. The broad stock market may slightly extend its two-day-long advance. However, we may see some selling pressure, as the index gets to the resistance level of around 2,500. For now, it still looks like an upward correction within a downtrend.
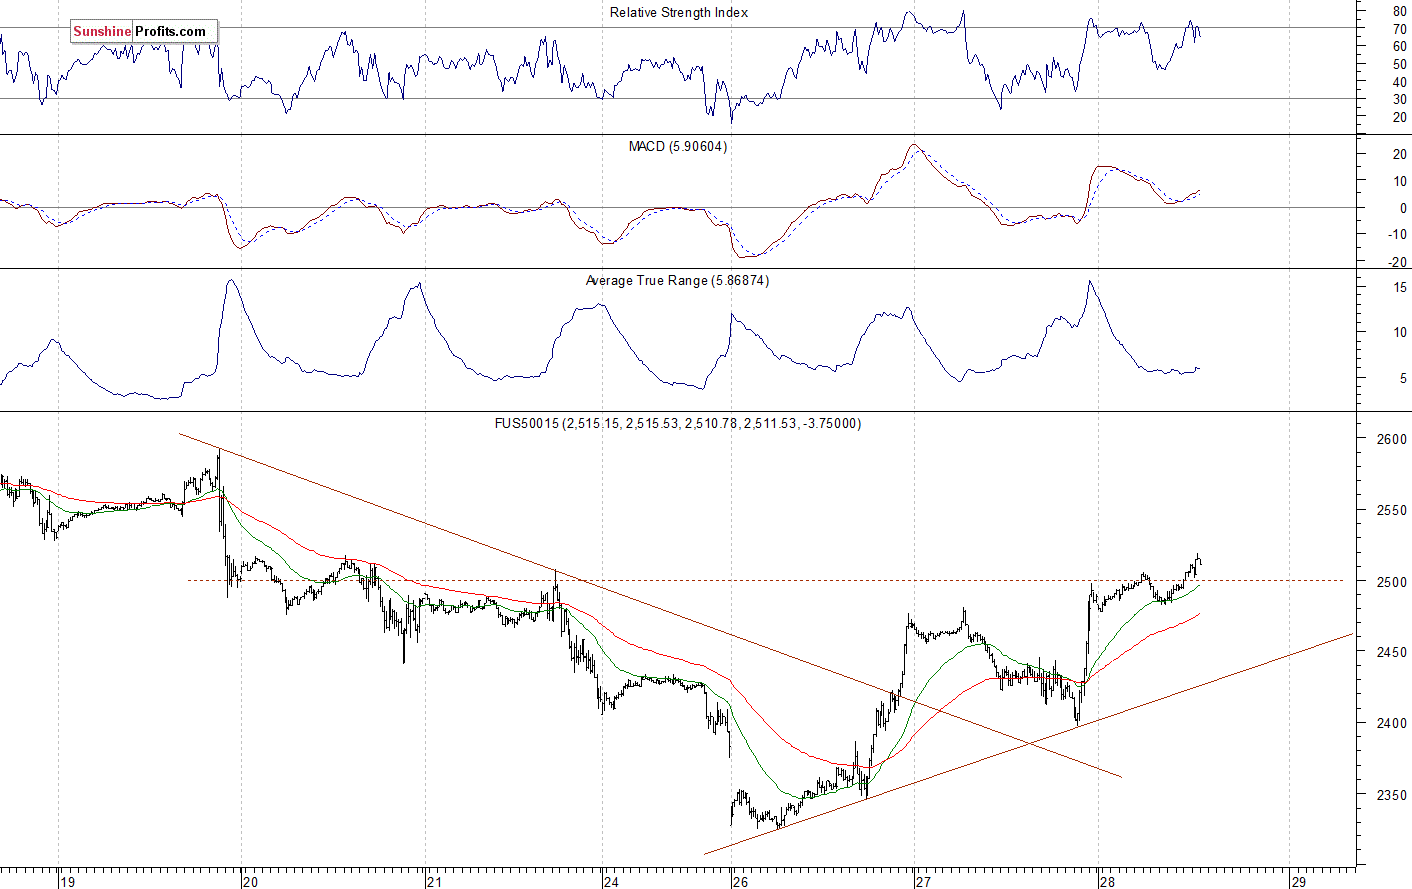
The S&P 500 futures contract trades within an intraday uptrend, as it breaks above the level of 2,500. The nearest important level of support is at around 2,450-2,470, marked by the previous resistance level. On the other hand, the resistance level is now at 2,530-2,550. The futures contract is above its three-day-long upward trend line, as we can see on the 15-minute chart:
Nasdaq Also Higher
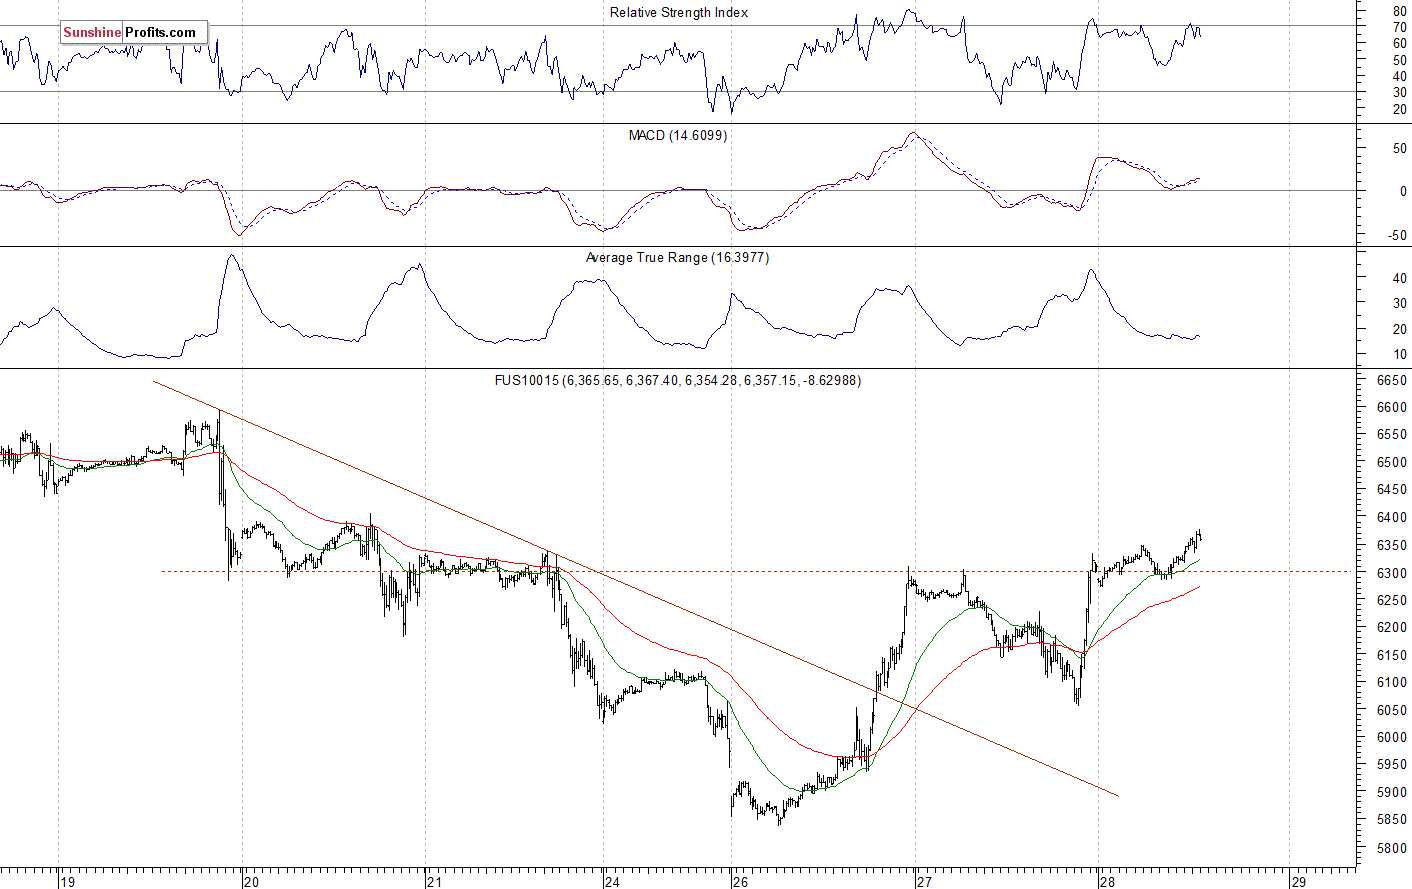
The technology Nasdaq 100 futures contract follows a similar path, as it trades within an intraday uptrend. The market fell below the level of 6,000 on Monday and it continued lower on Wednesday. It traded 24.7% below the early October record high, before reversing higher. The nearest important level of resistance is now at around 6,400-6,500. On the other hand, the support level is at 6,150-6,200, among others. The Nasdaq futures contract trades along its previous local highs, as the 15-minute chart shows:
Apple, Amazon - Reversing Upwards?
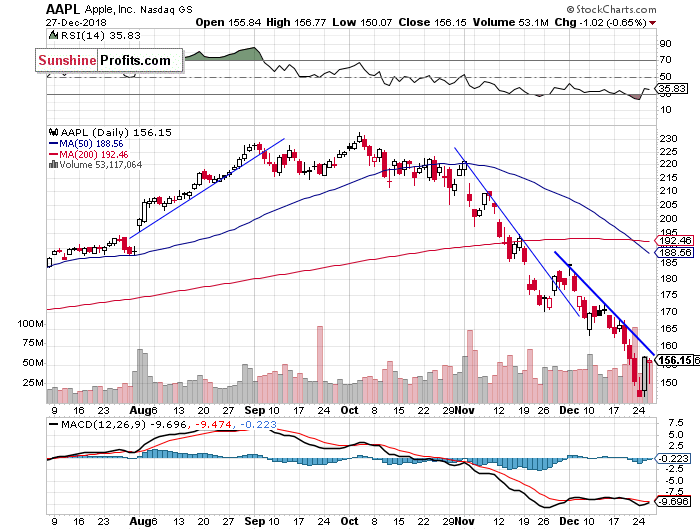
Let's take a look at Apple, Inc. stock (AAPL) daily chart (chart courtesy of http://stockcharts.com). The stock further accelerated its sell-off this week, as it fell below the price of $150. The market reached the new medium-term low of $146.59 on Monday. Then it retraced some of the decline. However, the stock remains below its month-long downward trend line:
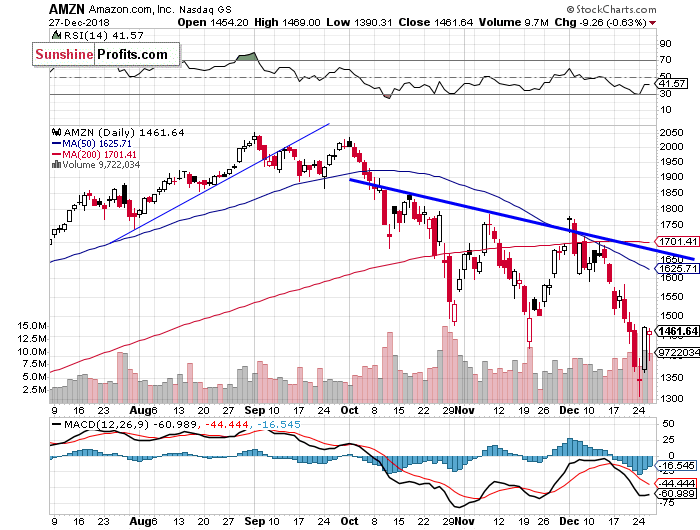
Now let's take a look at Amazon.com, Inc. stock (AMZN) daily chart. The stock accelerated its downtrend recently and it reached the new medium-term low of $1,307 on Monday. Was Wednesday's rally the upward reversal? For now, it looks like another upward correction. The market remains below its three-month-long downward trend line:
Dow Jones Retracing More of the Decline
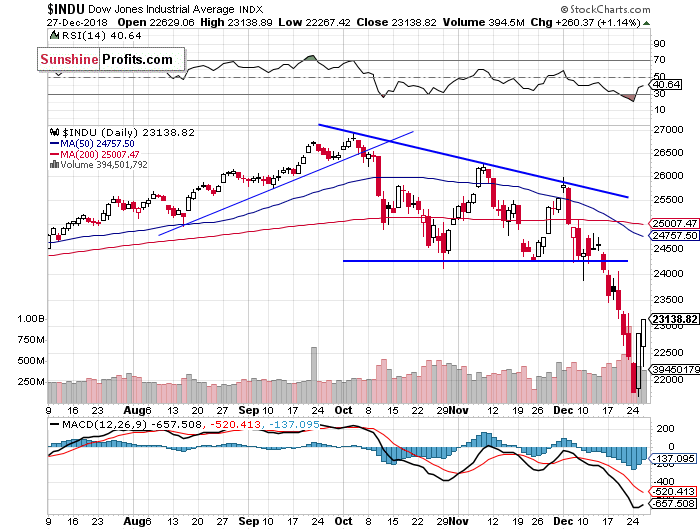
The Dow Jones Industrial Average broke below its two-month-long consolidation in the middle of the month and then it accelerated much lower. The blue-chip stocks' gauge fell below the level of 22,000 on Monday. It slightly extended the downtrend on Wednesday, before sharply reversing higher and getting back to 23,000 mark. So was it an upward reversal or just a correction within a downtrend? The market remains way below its October - December trading range:
The S&P 500 index extended its downtrend on Wednesday, before reversing higher and gaining 5%. The broad stock market was more than 20% below its September's record high. Is this a new long-term bear market or just medium-term downward correction? For now, it looks like a correction. However, there have been no confirmed medium-term positive signals so far.
Concluding, the S&P 500 index will likely open higher today. We may see more short-term volatility after Monday's panic-selling climax followed by Wednesday's rally.
Trading position (short-term; our opinion): no positions are justified from the risk/reward perspective.
Thank you.
Paul Rejczak
Stock Trading Strategist
Stock Trading Alerts

