

Briefly:
Intraday trade: The S&P 500 lost 1.4% on Tuesday, after opening 0.5% lower. The market will probably higher today. We may see a short-term consolidation along the level of 2,600-2,650.
Trading position (short-term; our opinion): no positions are justified from the risk/reward perspective.
Our short-term outlook is neutral, and our medium-term outlook is neutral:
Short-term outlook (next 1-2 weeks): neutral
Medium-term outlook (next 1-3 months): neutral
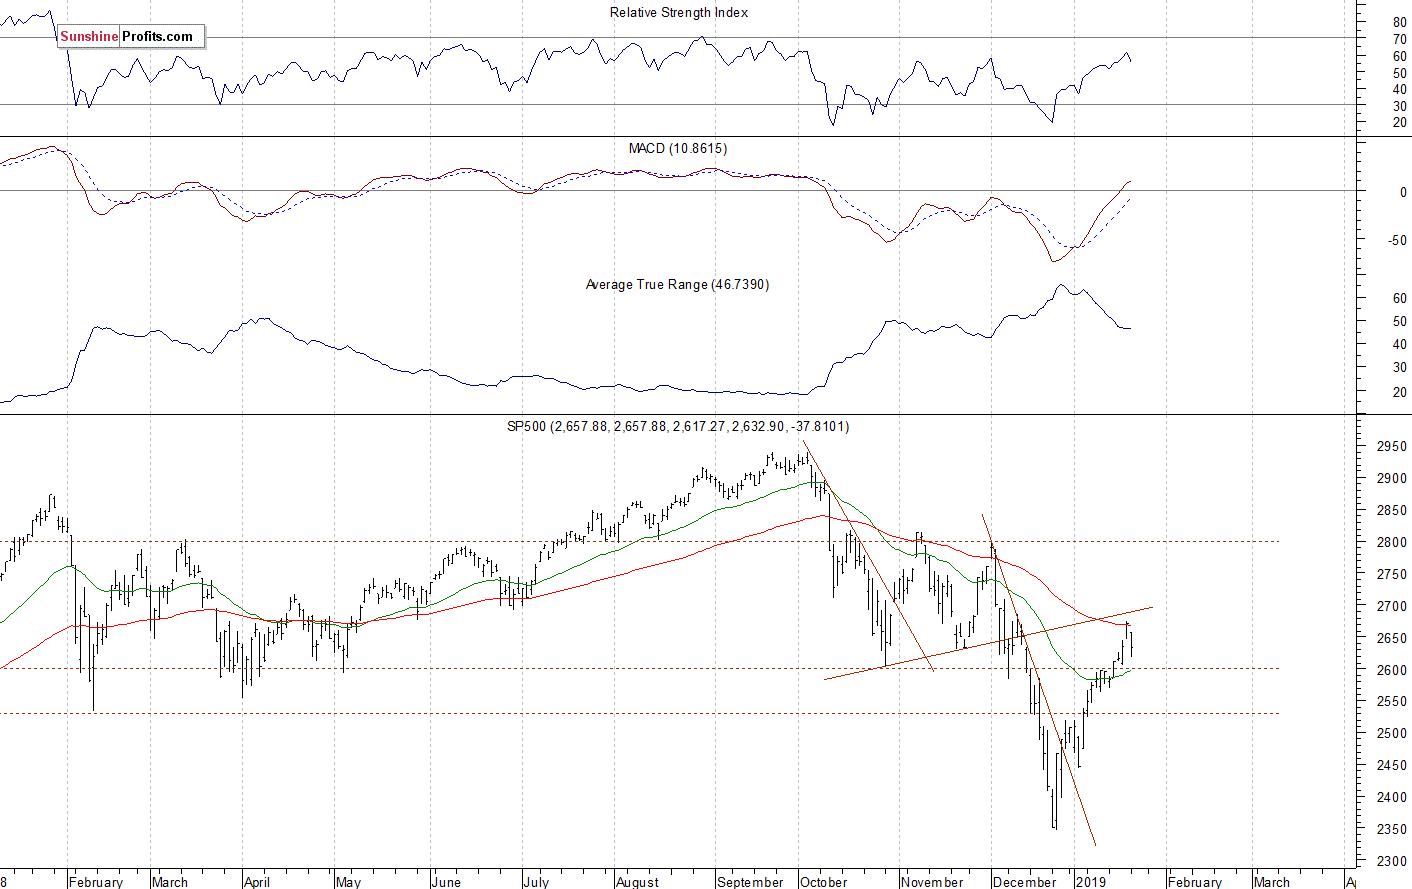
The U.S. stock market indexes lost 1.2-1.9% on Tuesday, retracing some of their recent advances, as investors took short-term profits off the table. The S&P 500 index continued its rebound off the December the 26th medium-term low of 2,346.58 recently. The index traded 20.2% below September the 21st record high of 2,940.91 on that day. Then the market rallied and retraced more than 50% of the downtrend. It broke slightly above 2,600 mark on Tuesday and it got closer to 2,700 on Friday. The Dow Jones Industrial Average lost 1.2% and the Nasdaq Composite lost 1.9% yesterday.
The nearest important level of resistance of the S&P 500 index remains at 2,675-2,685, marked by the early December local highs. The resistance level is also at 2,700-2,710. On the other hand, the support level is at around 2,600-2,610. The support level is also at 2,570-2,585, marked by some recent local lows.
The broad stock market broke below its two-month-long trading range in the mid-December, as the S&P 500 index fell below the level of 2,600. Then the market accelerated lower and it broke below 2,400 mark. The downward correction reached 20.2% from the September all-time high, surpassing January-February correction of around 12%. Since then, the market retraced more than 50% of the whole decline off the September high. The index trades close to a possible resistance level of its previously broken upward trend line, as we can see on the daily chart:
Short-Term Consolidation
The index futures contracts trade 0.3-0.5% above their Tuesday's closing prices. So expectations before the opening of today's trading session are positive. The European stock market indexes have been mixed so far. Investors will wait for the Richmond Manufacturing Index release at 10:00 a.m. They will also wait for more quarterly corporate earnings releases this week. The broad stock market will likely fluctuate following the recent advance and its yesterday's downward correction. There have been no confirmed negative signals so far. But we saw some clear short-term technical overbought conditions.
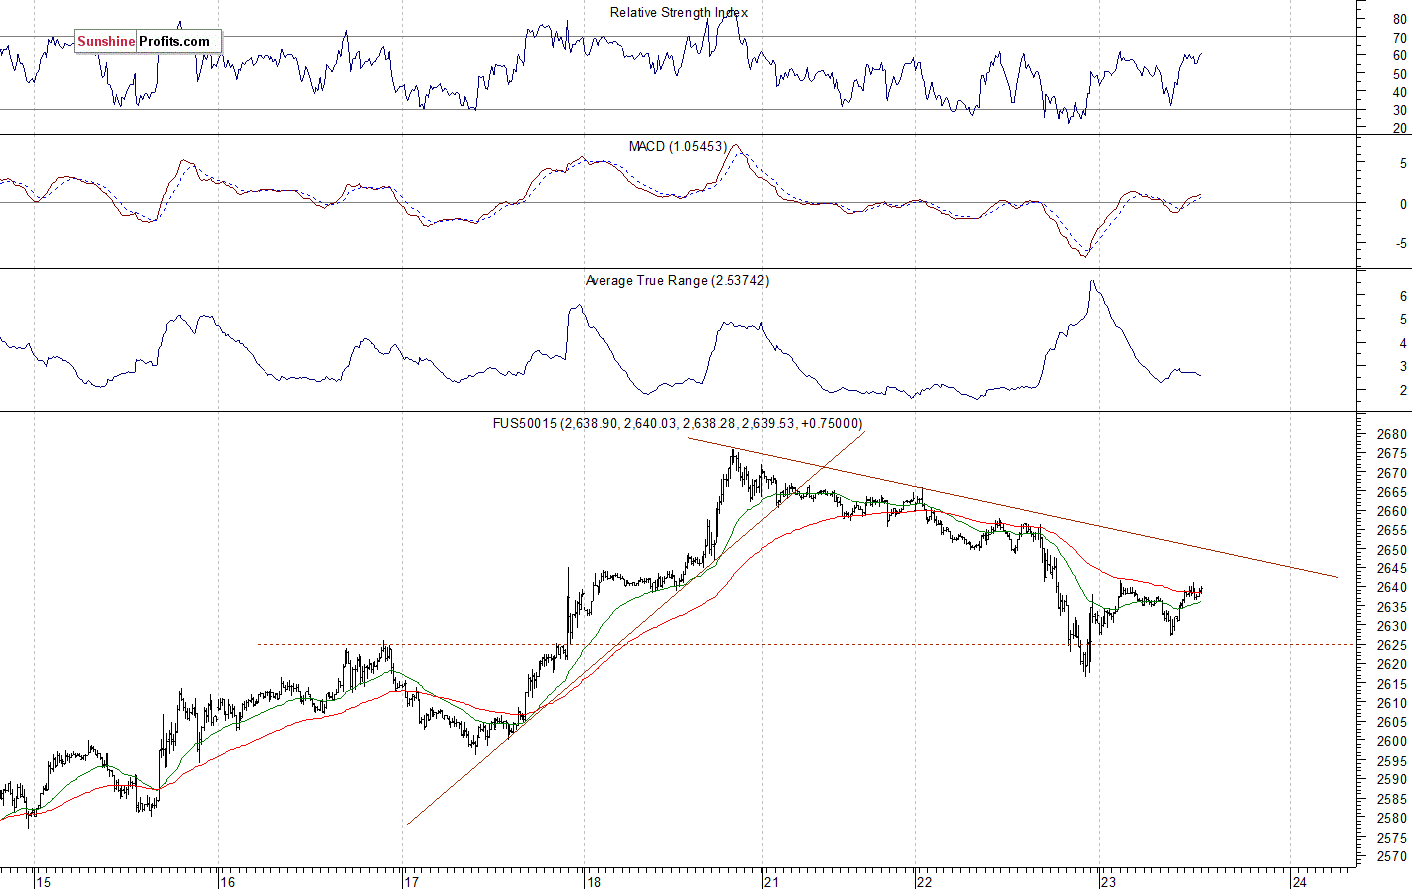
The S&P 500 futures contract trades within an intraday consolidation following yesterdays decline. The nearest important level of resistance is now at around 2,640-2,650, marked by some recent fluctuations. The resistance level is also at 2,660-2,670. On the other hand, the support level is at 2,615-2,620, marked by the local lows. The futures contract remains above its previous local highs, as the 15-minute chart shows:
Nasdaq Also Going Sideways
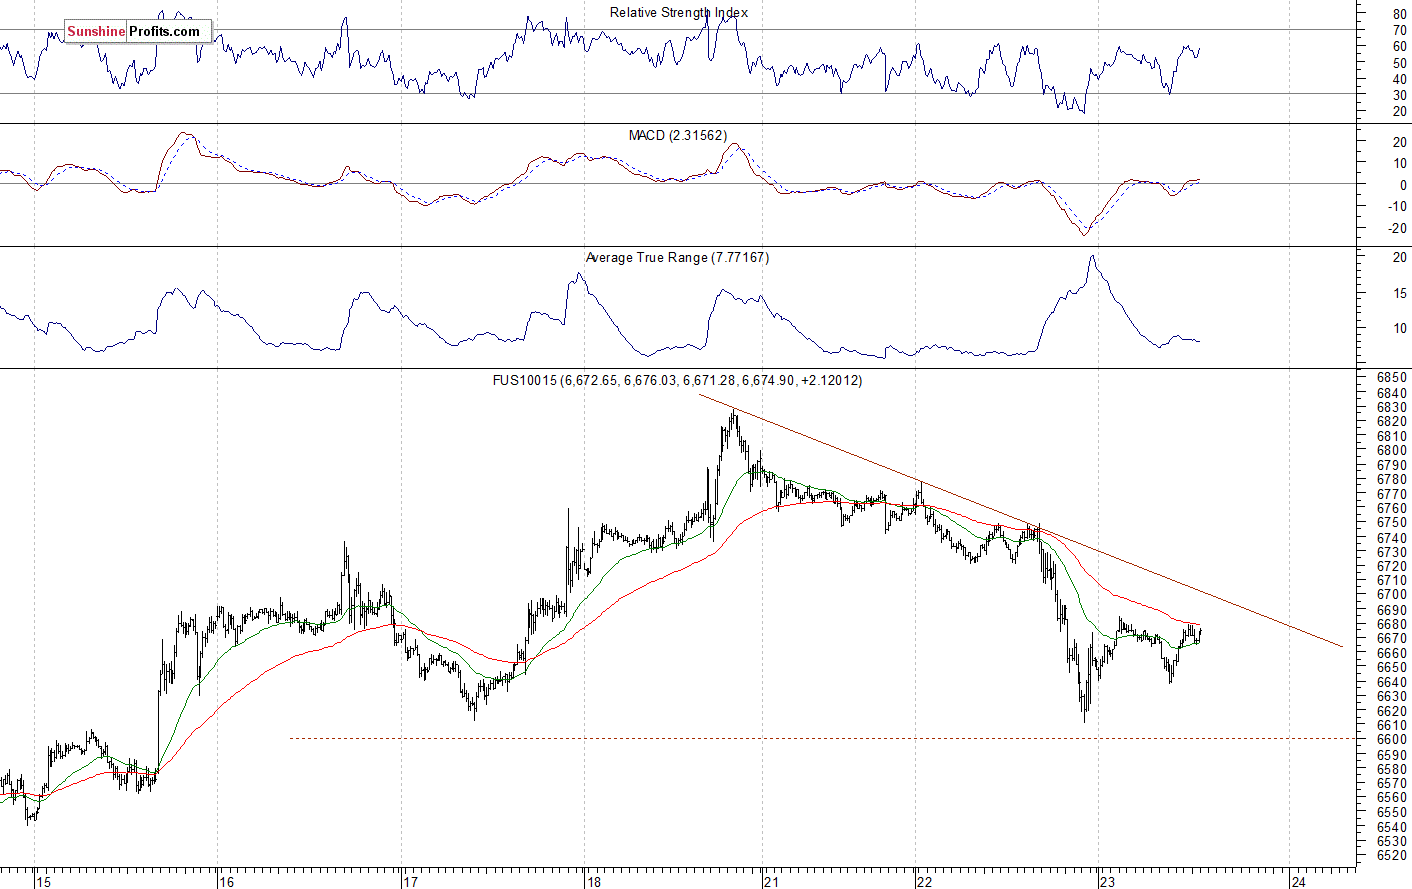
The technology Nasdaq 100 futures contract follows a similar path, as it trades within an intraday consolidation after yesterday's decline. The market gained over 1,000 points from December the 26th local low of around 5,820. On Friday it broke above 6,800 mark before quickly reversing lower. The nearest important level of resistance is now at 6,700-6,750. The next resistance level is at 6,800-6,830. The support level is at 6,600-6,650, among others. The Nasdaq futures contract remains below its three-day-long downward trend line, as we can see on the 15-minute chart:
Apple, Amazon - Downward Corrections or Reversals?
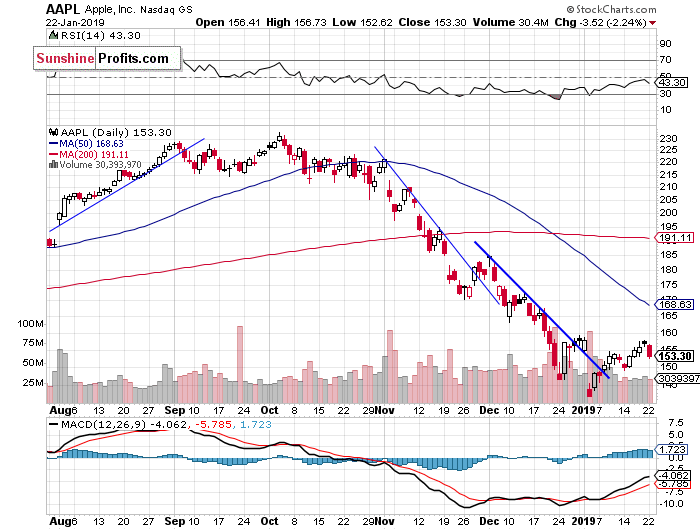
Let's take a look at Apple, Inc. stock (AAPL) daily chart (chart courtesy of http://stockcharts.com). The stock sold off in the early January, as it reached the new medium-term low of $142. We saw clear short-term oversold conditions and then the stock retraced some of its recent decline. It broke above the month-long downward trend line, but it still remains at the resistance level of $155-160:
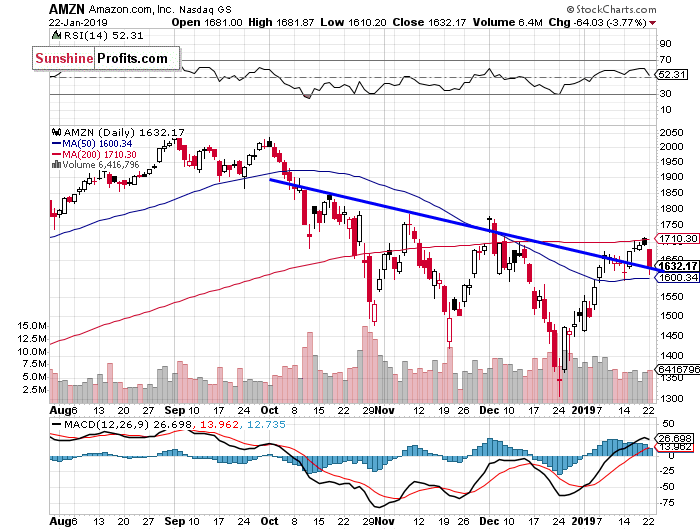
Now let's take a look at Amazon.com, Inc. stock (AMZN) daily chart. The stock accelerated its downtrend in the late December and it reached the new medium-term low of $1,307. Since then it was consequently advancing. Last week the market broke above its three-month-long downward trend line. But there is a close resistance level at around $1,700-1,750, and the stock retraced its recent run-up yesterday:
Dow Jones at Previous Consolidation Lows
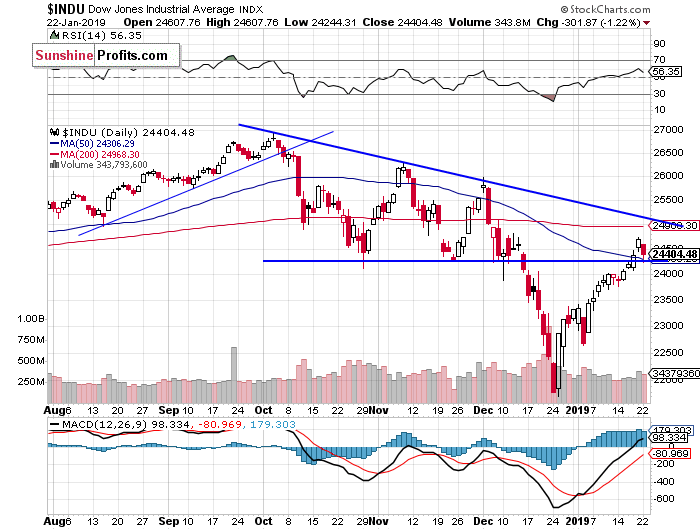
The Dow Jones Industrial Average broke above the level of 24,000 last week, and it continued higher towards 25,000 mark on Friday. The market is back above its October-December local lows. So will it continue higher and reach the record high? For now, it still looks like an upward correction. However, there have been no confirmed negative signals so far. The resistance level remains at the mentioned 25,000:
The S&P 500 index extended its short-term uptrend recently, as it broke above the mentioned 50% retracement of the whole downtrend from the record high. Is this a new medium-term uptrend? We can see a short-term downward correction. However, the medium-term picture is quite bullish at this moment.
Concluding, the S&P 500 index will likely open higher today and then we may see some short-term fluctuations. For now, it looks like a correction within an uptrend.
Trading position (short-term; our opinion): no positions are justified from the risk/reward perspective.
Thank you.
Paul Rejczak
Stock Trading Strategist
Stock Trading Alerts

