

Trading position (short-term; our opinion): No positions are justified from the risk/reward perspective.
Intraday outlook: The broad stock market will likely open virtually flat to slightly lower today. The S&P 500 index may continue to fluctuate along the last week's local high. For now, it looks like a relatively flat correction within a short-term uptrend.
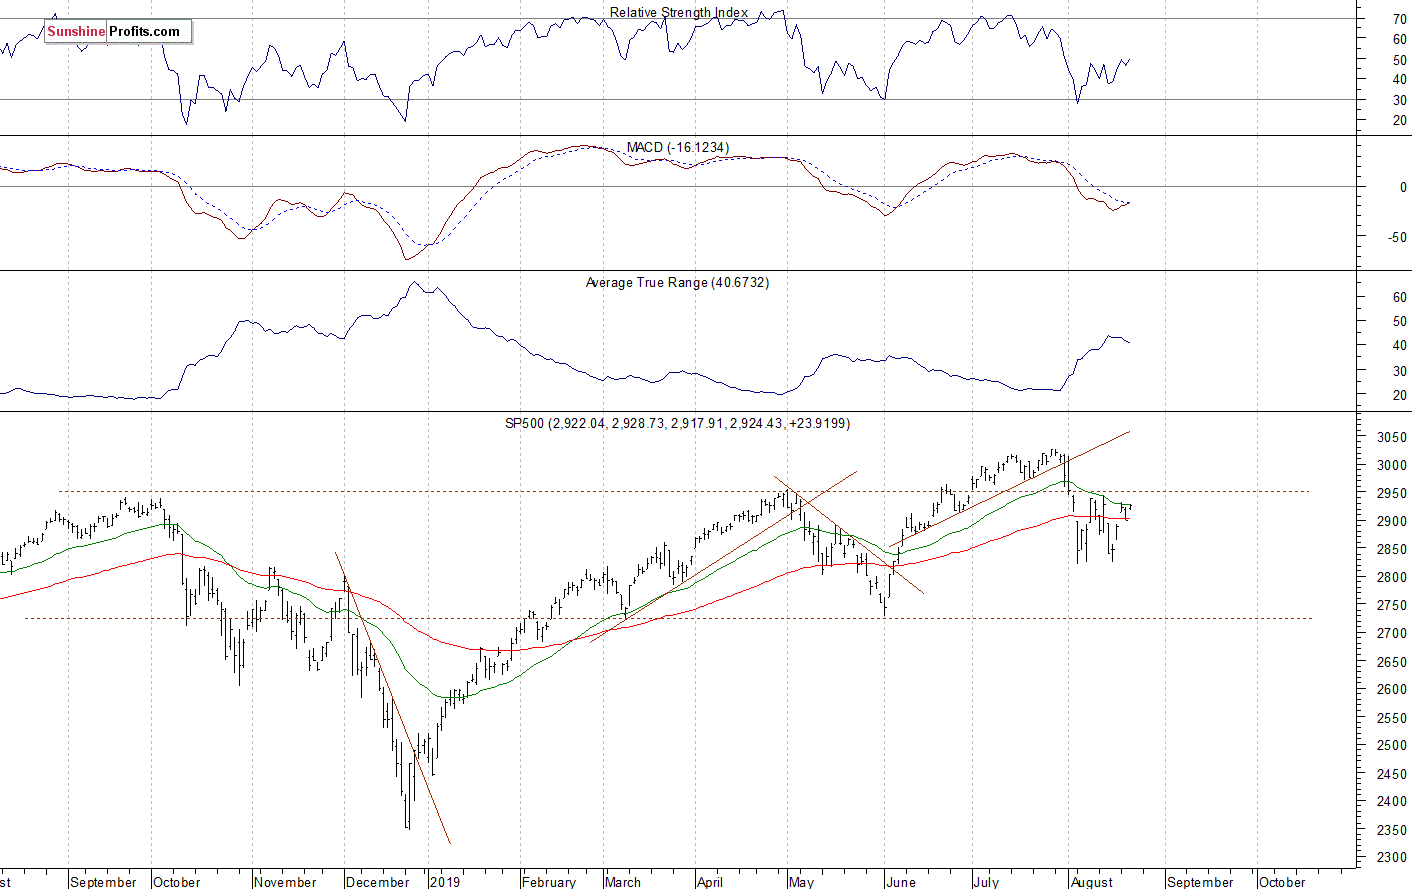
The U.S. stock market indexes gained 0.8-0.9% on Wednesday, as stocks retraced their Tuesday's declines. The S&P 500 index fell over 200 points from its record high of 3,027.98 in early August. Then it retraced more than 120 points of that sell-off, before getting back to the low again last week. Both the Dow Jones Industrial Average and the Nasdaq Composite gained 0.9% yesterday.
The nearest important resistance level of the S&P 500 index remains at around 2,940-2,950, marked by last week's local high. On the other hand, the support level is at 2,895-2,900, marked by Monday's daily gap up of 2,893.63-2,913.48. The support level is also at 2,865-2,870.
The broad stock market broke below its two-month-long upward trend line in early August, and then it quickly retraced most of the June-July advance. The S&P 500 index remains below the previous medium-term local highs. For now, it looks like a consolidation following the January-February advance. However, it could also play out as a long-term topping pattern ahead of a more meaningful downward correction:
Uncertainty at Short-Term Local High
The index futures contracts trade between -0.1% and -0.2% vs. their Wednesday's closing prices. So expectations before the opening of today's trading session are slightly negative. The European stock market indexes have been mixed so far. Investors will wait for some economic data announcements today: Initial Claims at 8:30 a.m., Flash Manufacturing PMI, Flash Services PMI at 9:45 a.m., CB Leading Index at 10:00 a.m.
The S&P 500 futures contract trades within an intraday consolidation, as it fluctuates following yesterday's advance. The nearest important resistance level is at 2,930-2,935. On the other hand, the support level is at 2,900-2,920. The futures contract extends its short-term consolidation, as the 15-minute chart shows:

Nasdaq 100 Also Going Sideways
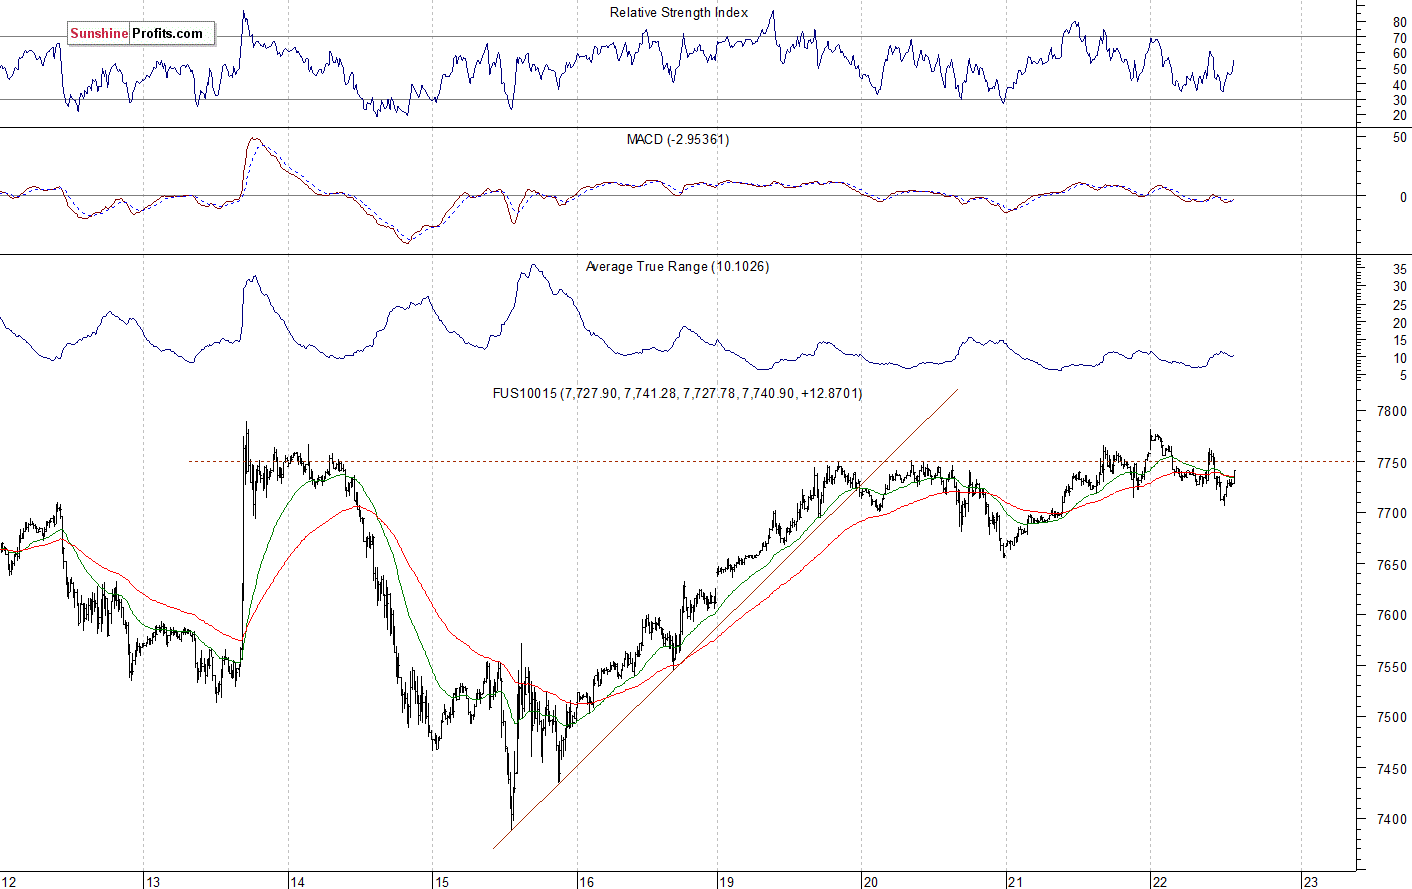
The technology Nasdaq 100 futures contract follows a similar path, as it trades within an intraday consolidation. It bounced off a support level of 7,350-7,400 a week ago. And the nearest important resistance level remains at around 7,750. The Nasdaq futures contract is close to the short-term local highs, as we can see on the 15-minute chart:
Big Cap Tech Stocks - Closer to Breakout?
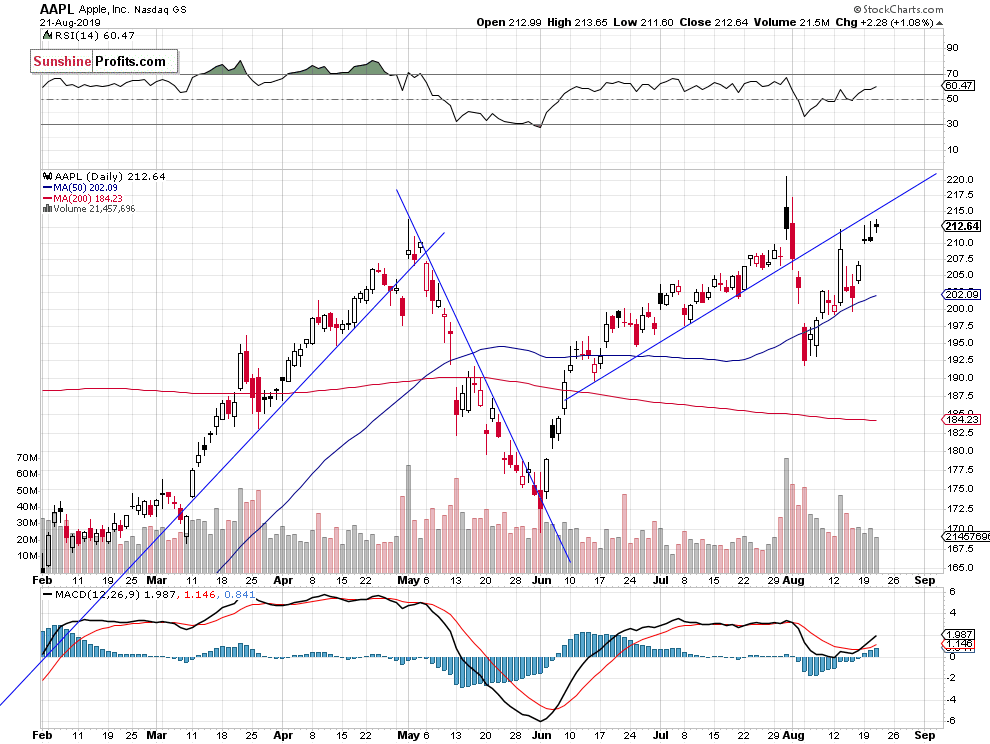
Let's take a look at the Apple, Inc. stock (AAPL) daily chart (chart courtesy of http://stockcharts.com). The stock broke slightly above its last week's local high. It is at the resistance level of $210-215 again:
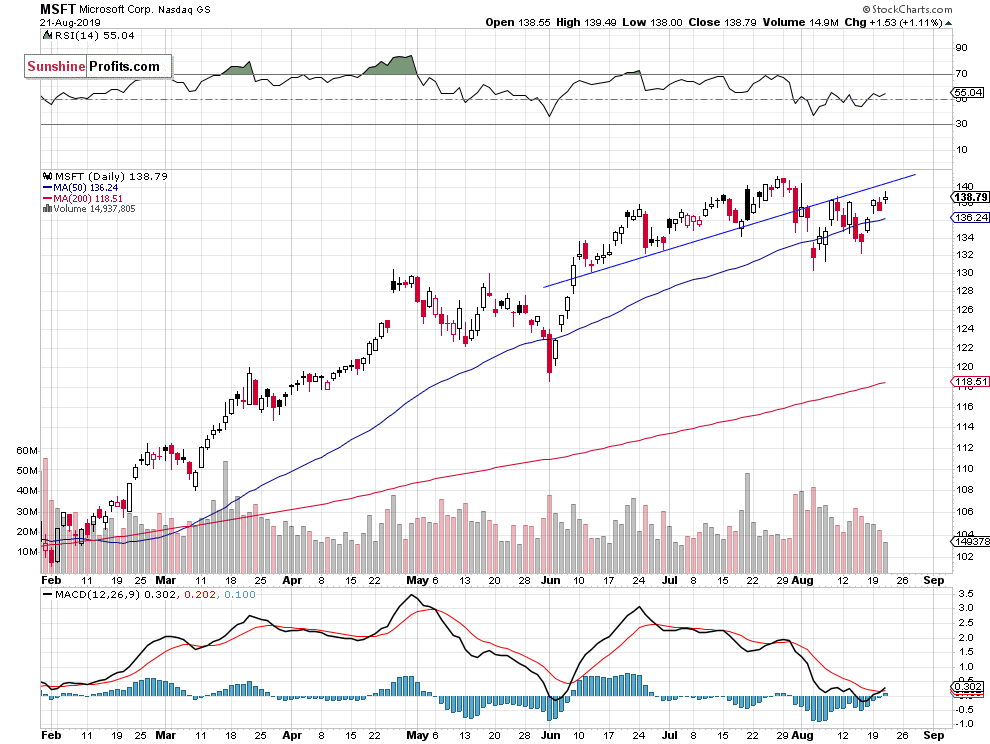
Now let's take a look at the daily chart of Microsoft Corp. stock (MSFT). The stock remains below the broken upward trend line. The resistance level is at $140-145. It still looks like a consolidation within a medium-term uptrend:
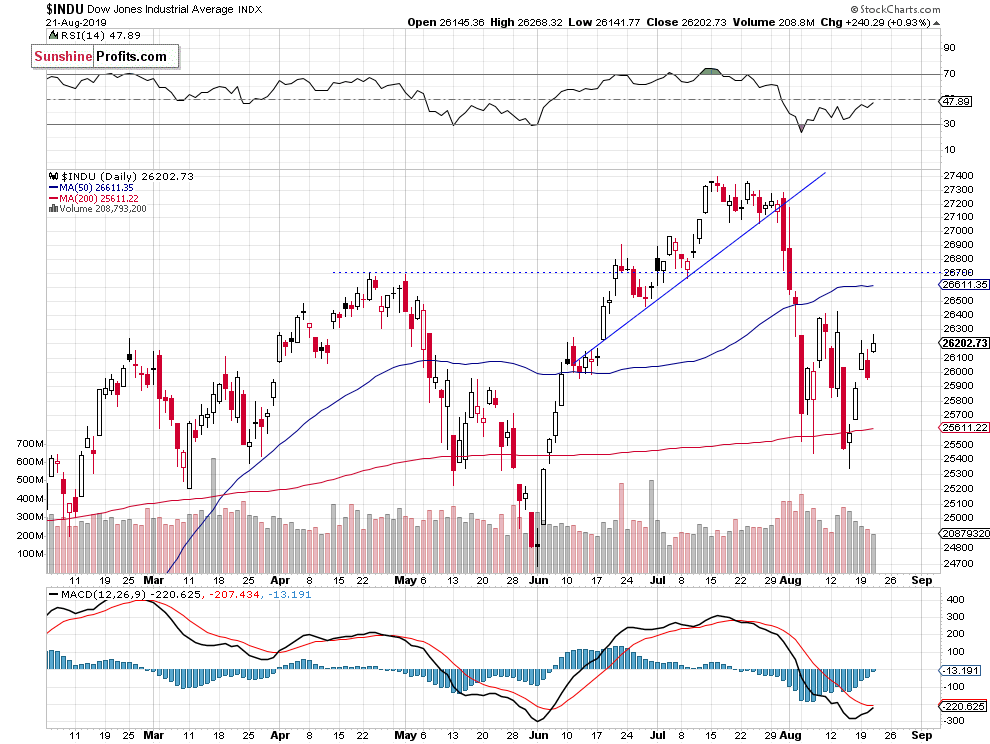
Dow Jones Still Going Sideways
The Dow Jones Industrial Average broke below its upward trend line in late July. Then it fell to around 25,500, before bouncing off the 200-day moving average. Last week the blue-chip stocks' gauge bounced off that support level again. We could see more short-term fluctuations following the mentioned late July - early August sell-off:
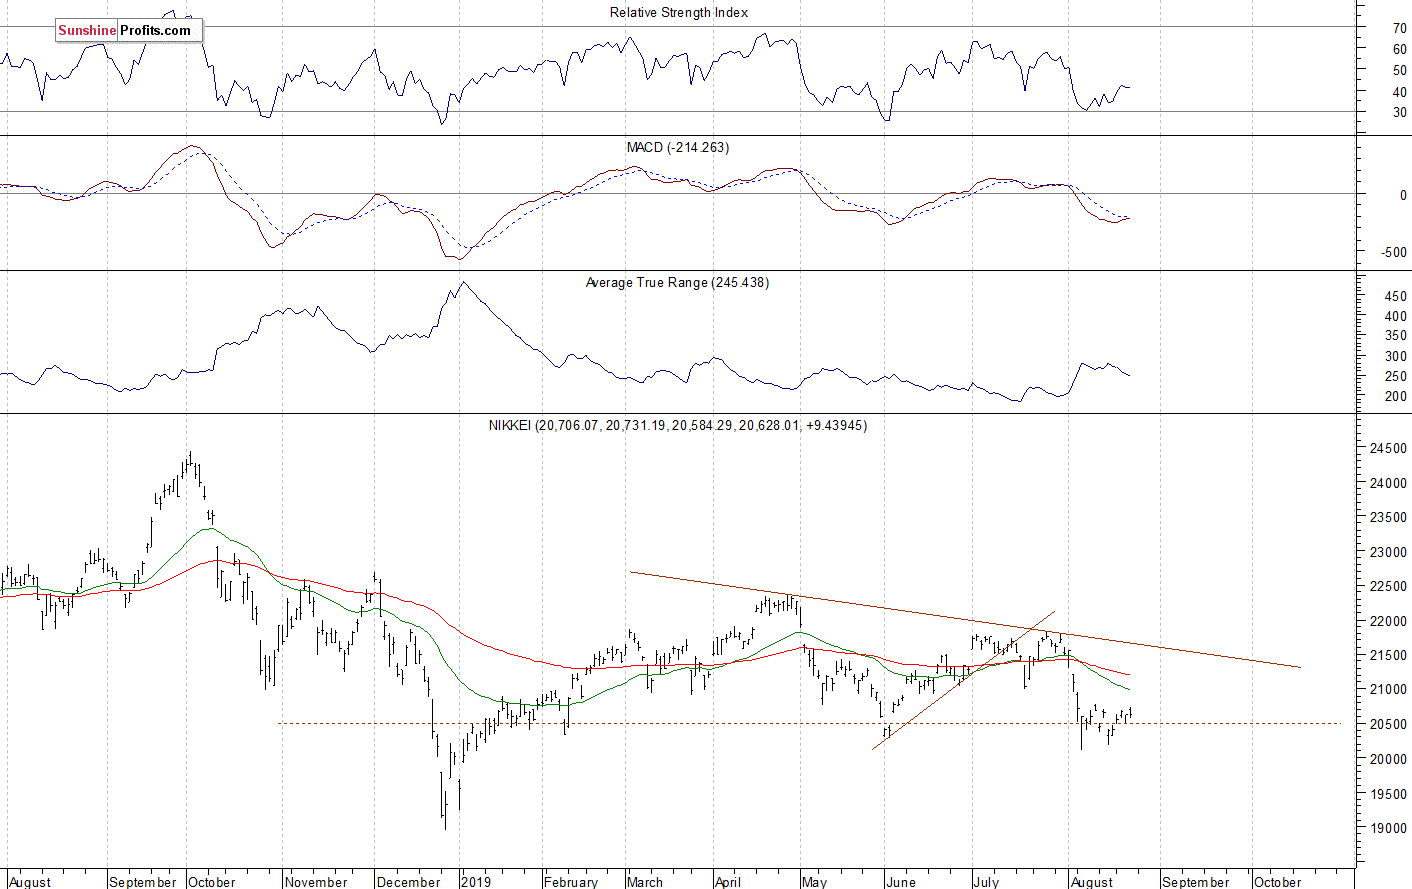
Nikkei Still at Around 20,500
Let's take a look at the Japanese Nikkei 225 index. It broke below an over month-long upward trend line in July. Then it fell slightly below the 20,500 mark again. The market continues to trade along the previous medium-term lows:
The S&P 500 index broke below the upward trend line in late July, as investors reacted to the Fed's Rate Decision release, among other factors. We saw technical overbought conditions along with negative technical divergences then. And the market declined following renewed trade war fears. Recently it was rebounding off the support level of around 2,800-2,820. Has the bottom been reached? For now, it looks like a consolidation following the decline.
Concluding, the S&P 500 index will likely open slightly lower today. The market may continue to fluctuate along its last week's local high. If the index breaks above that resistance level, we could see more buying pressure.
Trading position (short-term; our opinion): No positions are justified from the risk/reward perspective.
Thank you.
Paul Rejczak
Stock Trading Strategist
Sunshine Profits - Effective Investments through Diligence and Care

