

Briefly:
Intraday trade: The S&P 500 gained 0.7% on Monday, after opening 0.1% higher. The market will probably open higher today. Then we may see some short-term fluctuations following the recent advance.
Trading position (short-term; our opinion): no positions are justified from the risk/reward perspective.
Our short-term outlook is neutral, and our medium-term outlook is neutral:
Short-term outlook (next 1-2 weeks): neutral
Medium-term outlook (next 1-3 months): neutral
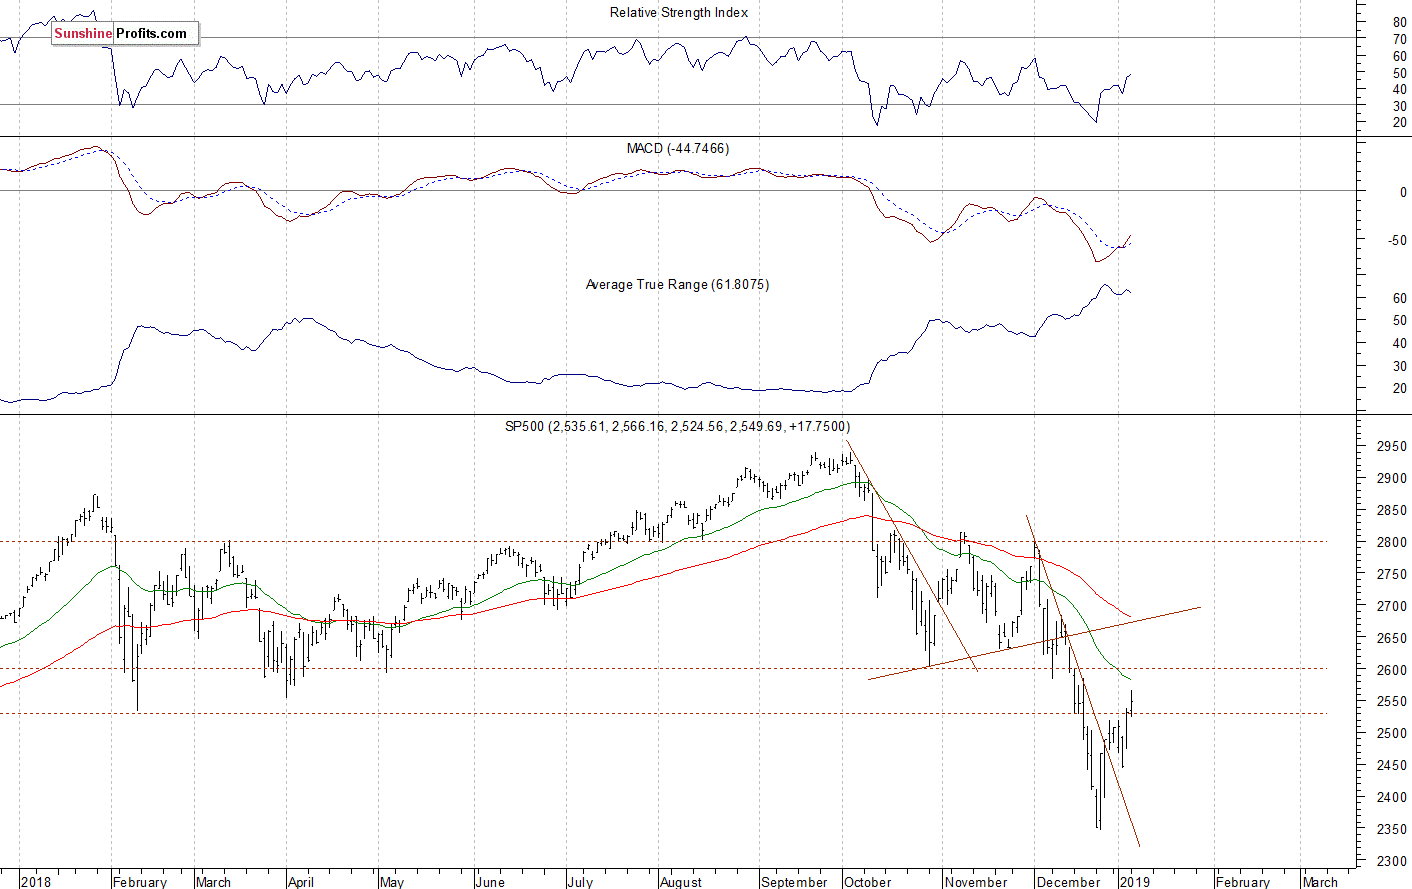
The U.S. stock market indexes gained 0.4-1.3% on Monday, extending their Friday's rally, as investors' sentiment remained bullish following better-than-expected monthly jobs data release. The S&P 500 index extended its recent rebound off the December the 26th medium-term low of 2,346.58. It traded 20.2% below September the 21st record high of 2,940.91 on that day. Then the market rallied and retraced some of the downtrend. It got back above 2,500 mark on Friday and continued higher yesterday. The Dow Jones Industrial Average gained 0.4% and the Nasdaq Composite gained 1.3% on Monday.
The nearest important level of resistance of the S&P 500 index is now at 2,550-2,565, marked by the short-term local high.The resistance level is also at 2,600. On the other hand, the level of support is at 2,500, and the next support level remains at 2,450-2,475, marked by some recent local lows.
The broad stock market broke below its two-month-long trading range recently, as the S&P 500 index fell below the level of 2,600. Then the market accelerated lower and it broke below the level of 2,400. The downward correction reached 20.2% from the September all-time high, surpassing January-February correction of around 12%. Is this a long-term bear market? It still looks like a medium-term downward correction, but the index remains below the recent consolidation, as we can see on the daily chart:
Positive Expectations
Expectations before the opening of today's trading session are positive, because the index futures contracts trade 0.7-0.8% above their Monday's closing prices. The European stock market indexes have gained 0.9-1.5% so far. Investors will wait for the JOLTS Job Openings number release at 10:00 a.m. The broad stock market may fluctuate following the recent rally. For now, it looks like another consolidation within a short-term uptrend.
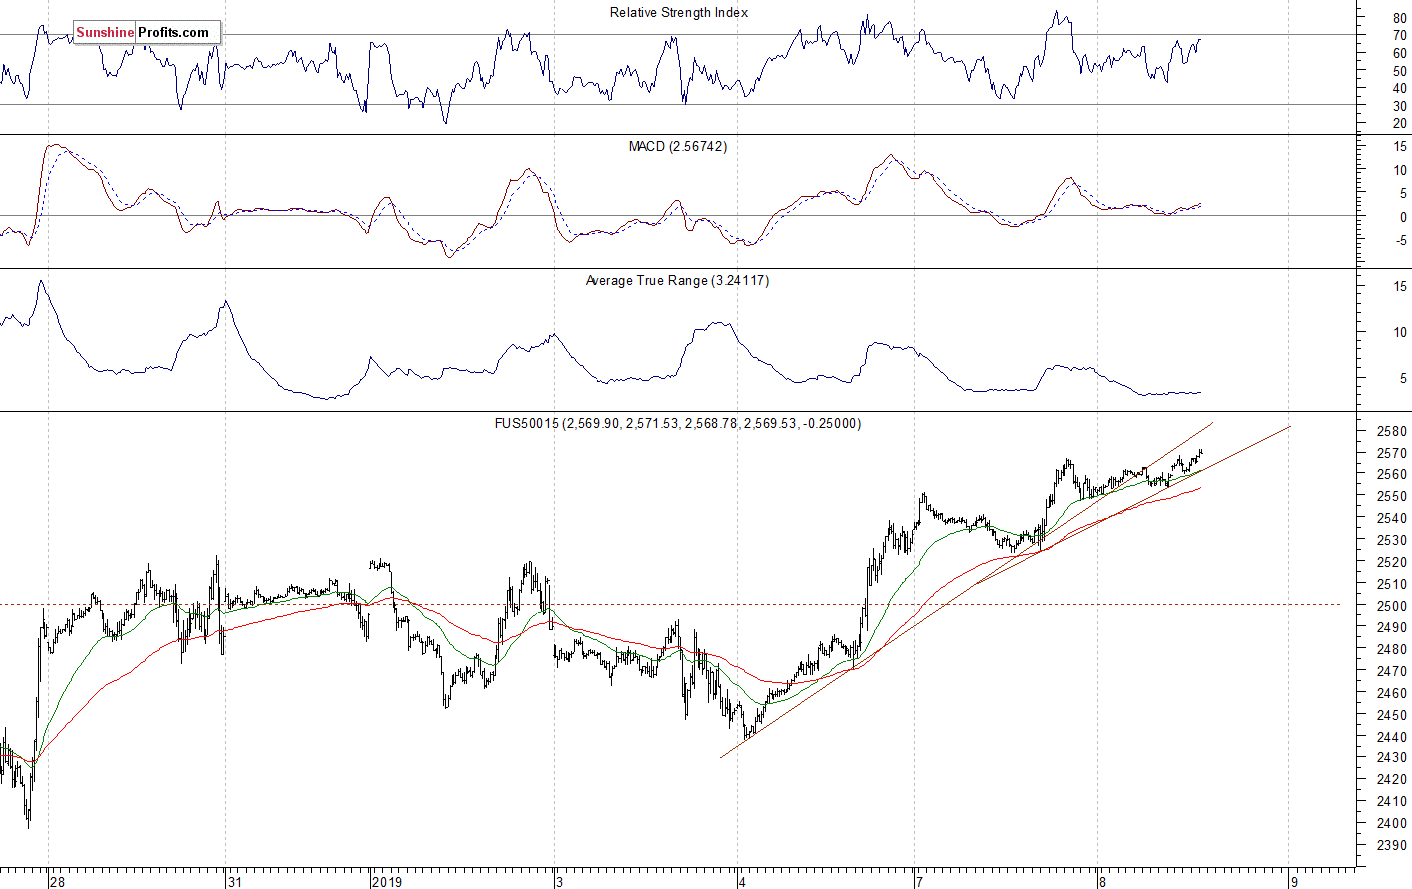
The S&P 500 futures contract trades within an intraday uptrend, as it breaks above the level of 2,570. It retraced its yesterday's intraday decline. The nearest important level of support is at around 2,550, marked by some short-term local lows.. On the other hand, the level of resistance is now at 2,580-2,600. The futures contract extends its short-term uptrend, as the 15-minute chart shows:
Nasdaq Also Higher
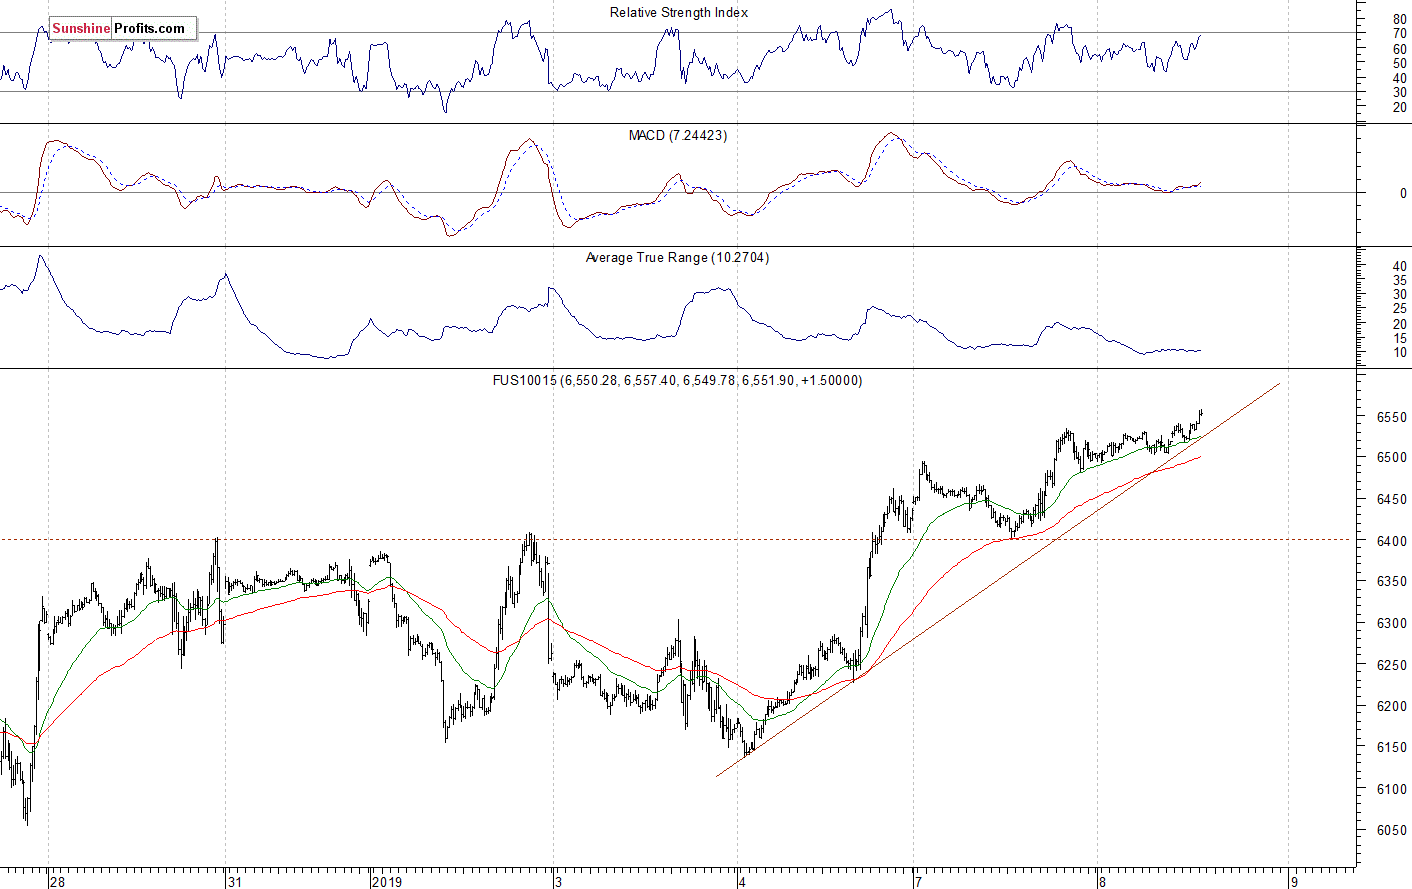
The technology Nasdaq 100 futures contract follows a similar path, as it extends its uptrend this morning. The nearest important level of support is at around 6,500, marked by the recent resistance level. On the other hand, the resistance level is now at 6,550-6,600. The resistance level is also at 6,700-6,800, marked by some previous local highs. The Nasdaq futures contract remains above the short-term upward trend line, as we can see on the 15-minute chart:
Tech Stocks Advancing
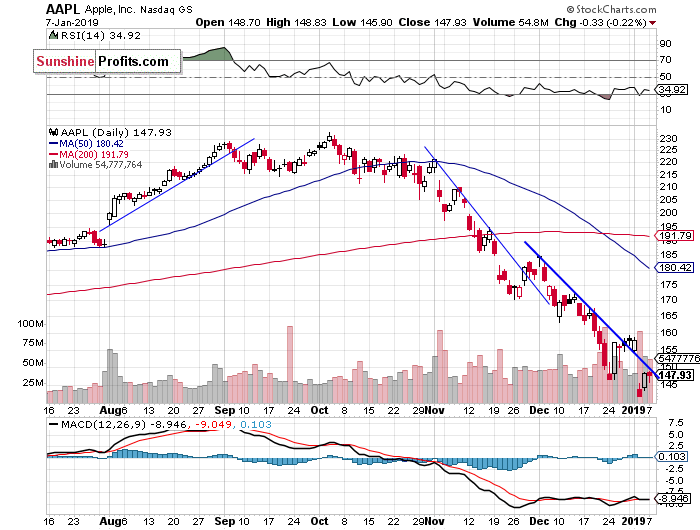
Let's take a look at Apple, Inc. stock (AAPL) daily chart (chart courtesy of http://stockcharts.com). The stock sold off on Thursday, as it reached the new medium-term low of $142. We saw clear short-term oversold conditions and the stock retraced some of its recent decline on Friday. However, there have been no confirmed positive signals so far. It remains below the month-long downward trend line:
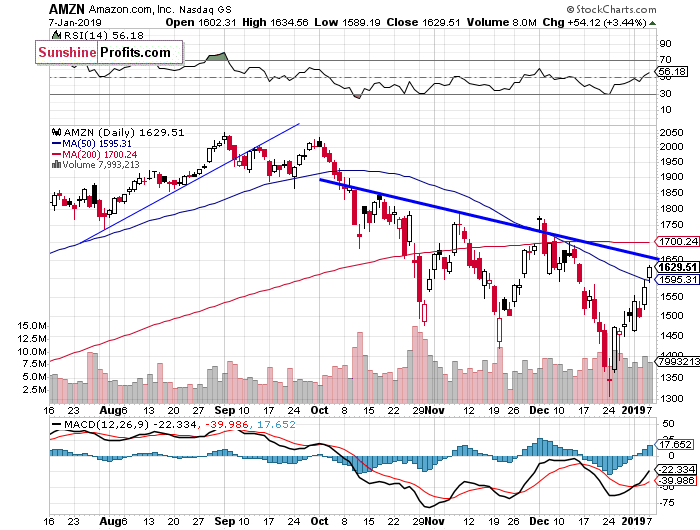
Now let's take a look at Amazon.com, Inc. stock (AMZN) daily chart. The stock accelerated its downtrend in the late December and it reached the new medium-term low of $1,307. Was the recent rally an upward reversal? For now, it looks like another upward correction. The market remains slightly below its three-month-long downward trend line:
Dow Jones Continuing Upwards?
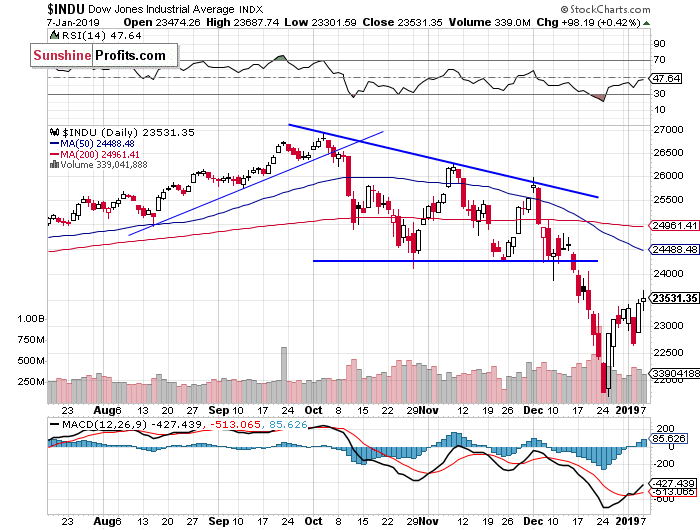
The Dow Jones Industrial Average broke below its two-month-long consolidation in the mid-December and then it accelerated much lower. The blue-chip stocks' gauge fell below the level of 22,000. It slightly extended the downtrend recently before sharply reversing higher and getting back to 23,000 mark. So was it an upward reversal or just a correction within a downtrend? The market remains below its October - December trading range:
The S&P 500 index extended its downtrend in the late December, before reversing higher. The broad stock market was more than 20% below its September's record high on December the 26th. Is this a new long-term bear market or just medium-term downward correction? For now, it looks like a correction. However, there have been no confirmed medium-term positive signals so far. The market retraced some of its recent decline, but it continues to trade below the important resistance levels.
Concluding, the S&P 500 index will likely open higher today. The market may extend its short-term uptrend following Friday's better-than-expected monthly jobs data release. However, we may see some uncertainty as stocks get closer to the medium-term resistance levels.
Trading position (short-term; our opinion): no positions are justified from the risk/reward perspective.
Thank you.
Paul Rejczak
Stock Trading Strategist
Stock Trading Alerts

