

Briefly:
Intraday trade: The S&P 500 lost 1.6% on Thursday, after opening 0.4% lower. The market will probably open lower again today. We may see another attempt at retracing some of the recent declines. But there have been no confirmed positive signals so far.
Trading position (short-term; our opinion): no positions are justified from the risk/reward perspective.
Our short-term outlook is neutral, and our medium-term outlook is neutral:
Short-term outlook (next 1-2 weeks): neutral
Medium-term outlook (next 1-3 months): neutral
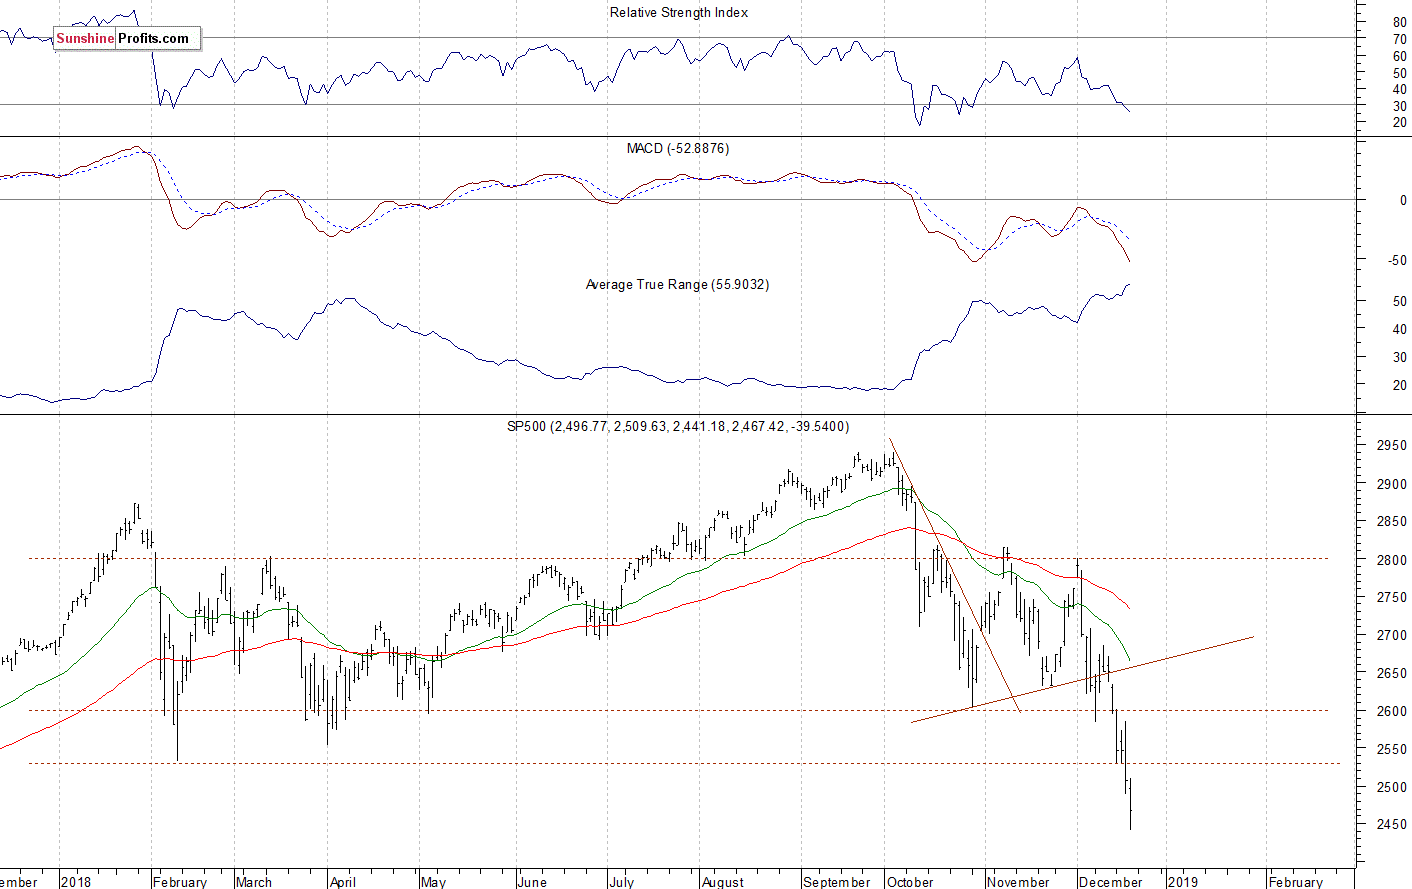
The U.S. stock market indexes lost 1.6-2.0% on Thursday, as they further accelerated their sell-off following the Fed's Rate Decision release. The S&P 500 index fell the lowest since the late August of 2017, and it traded 17.0% below September the 21st record high of 2,940.91. The daily low was at 2,441.18. The Dow Jones Industrial Average lost 2.0% and the Nasdaq Composite lost 1.6% on Thursday.
The nearest important level of resistance of the S&P 500 index is now at 2,490-2,500, marked by the recent support level. The resistance level is also at 2,530, marked by the short-term local lows. On the other hand, the support level is at 2,400-2,440, among others.
The broad stock market broke below its two-month-long trading range recently, as the S&P 500 index fell below the level of 2,600. Then it accelerated lower. The downward correction reached 17% from the September all-time high, surpassing January-February correction of around 12%. Is this a long-term bear market? For now, it looks like a medium-term downward correction. However, there have been no confirmed positive signals so far. The index fell below the February local low, as we can see on the daily chart:
Uncertainty Following the Sell-Off
The index futures contracts trade between -0.3% and -0.5% vs. their Thursday's closing prices. So expectations before the opening of today's trading session are negative again. The European stock market indexes have lost 0.2-0.5% so far. Investors will wait for series of economic data announcements this morning: GDP, Durable Goods Orders at 8:30 a.m., Personal Income, Personal Spending, Michigan Sentiment number at 10:00 a.m. The broad stock market may fluctuate following the recent sell-off. There will likely be another attempts at retracing some of the recent decline. However, there have been no confirmed positive signals so far.
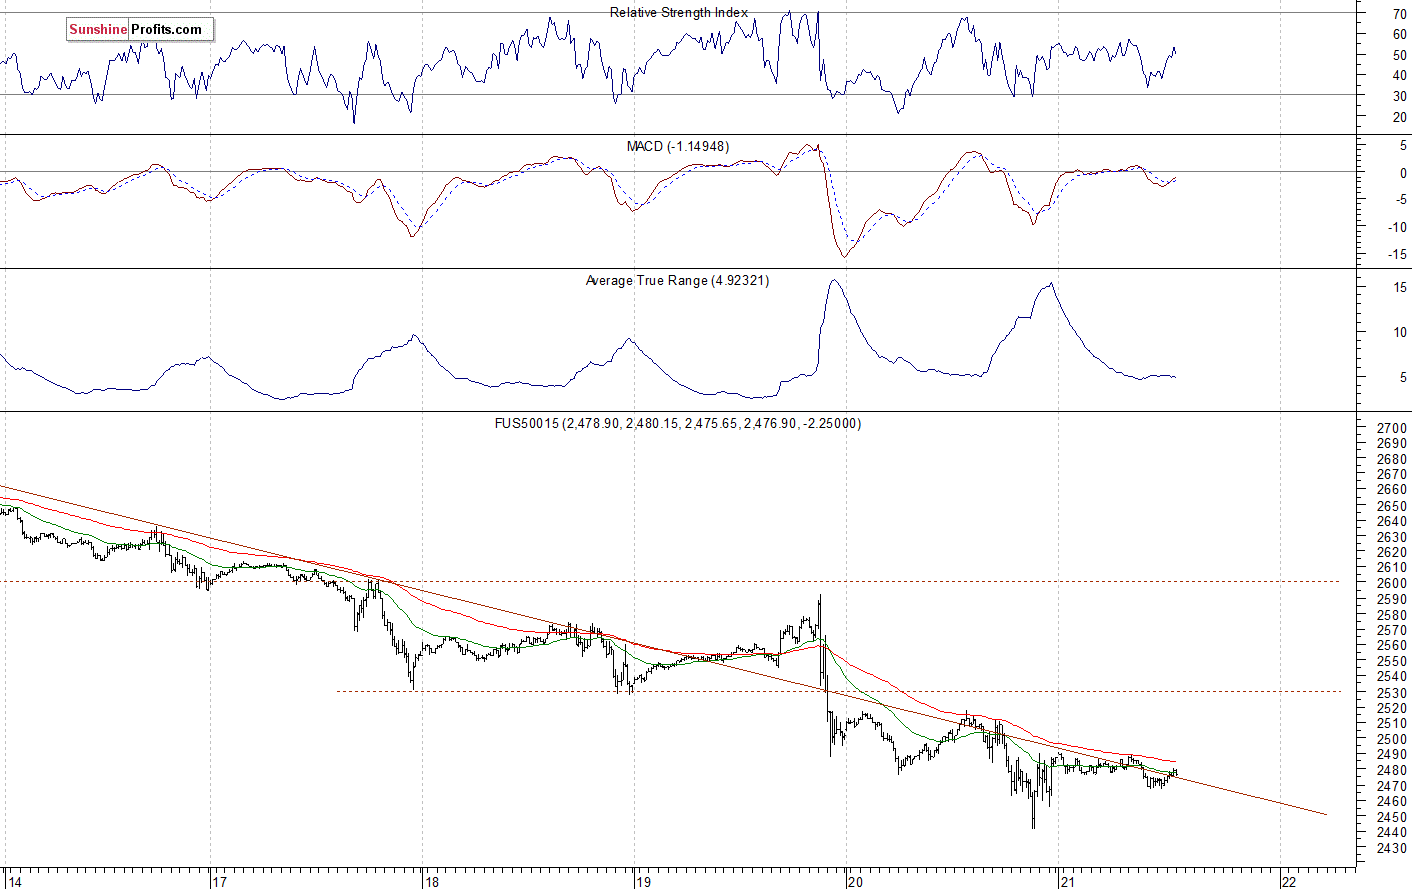
The S&P 500 futures contract trades within an intraday consolidation. The market remains below the level of 2,500, after retracing some of its intraday decline yesterday. It bounced off the support level of around 2,440-2,450. The nearest important level of resistance is at 2,490-2,500. The futures contract trades along its short-term downward trend line, as the 15-minute chart shows:
Nasdaq Fell 20% From October's High
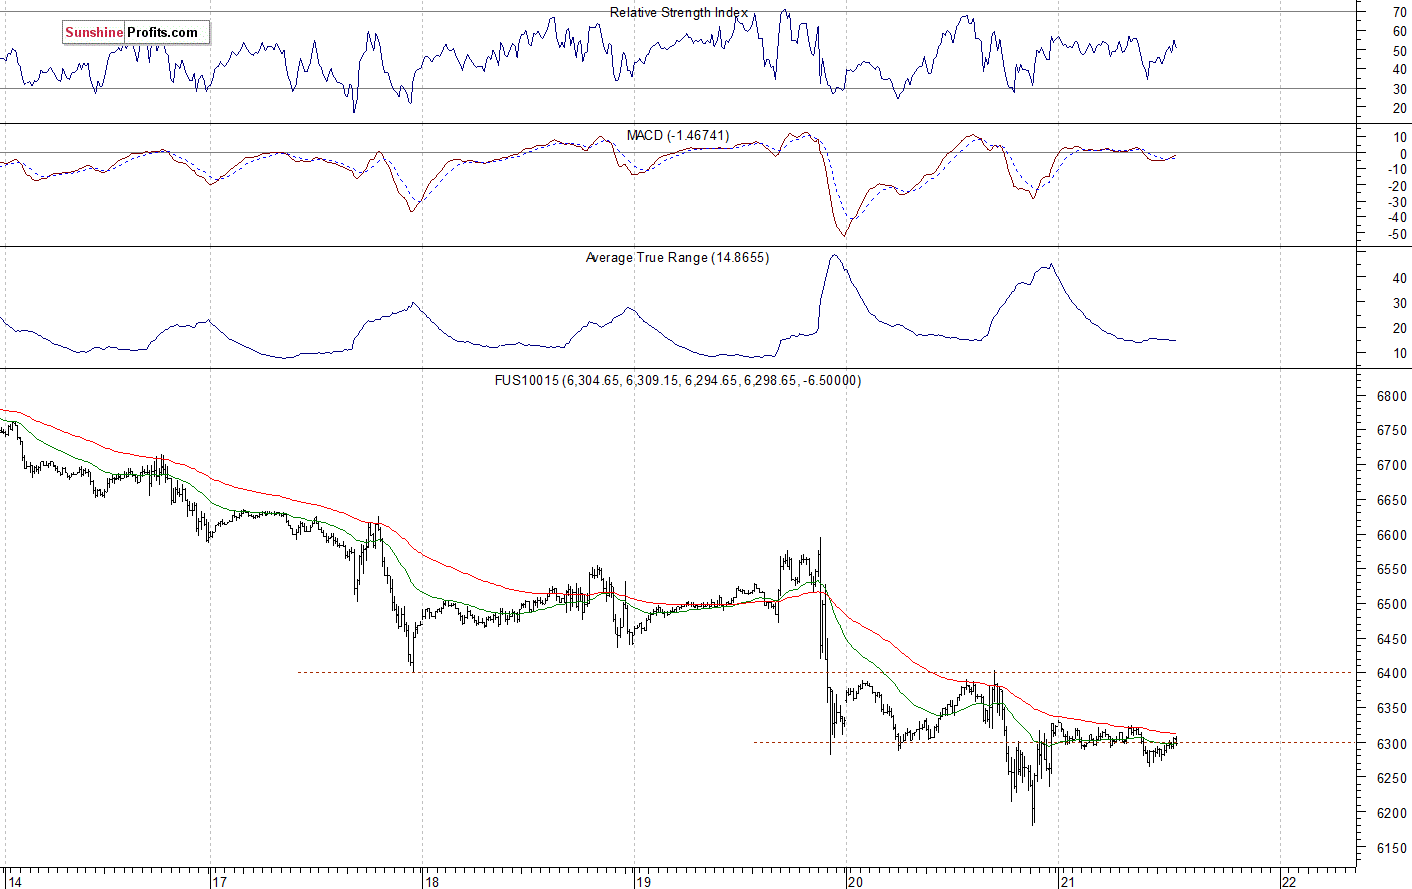
The technology Nasdaq 100 futures contract follows a similar path, as it trades within an intraday consolidation. The market fell below the level of 6,200 yesterday, as it traded 20% below the early October record high. The nearest important level of resistance is now at around 6,300-6,350. The support level is at 6,150-6,200, among others. The Nasdaq futures contract trades along the level of 6,300 this morning, as we can see on the 15-minute chart:
Apple, Amazon Continued Lower
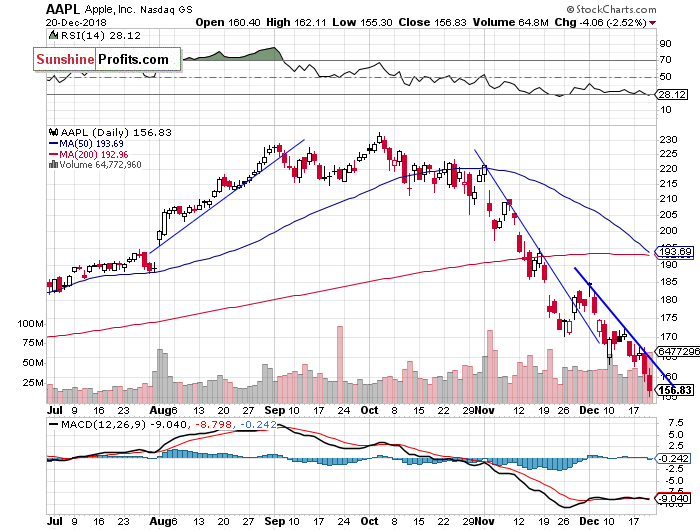
Let's take a look at Apple, Inc. stock (AAPL) daily chart (chart courtesy of http://stockcharts.com). The stock further accelerated its sell-off yesterday, as it fell way below the price of $160. The market reached new medium-term low of $155.30. Will it continue even lower? There have been no confirmed positive signals so far:
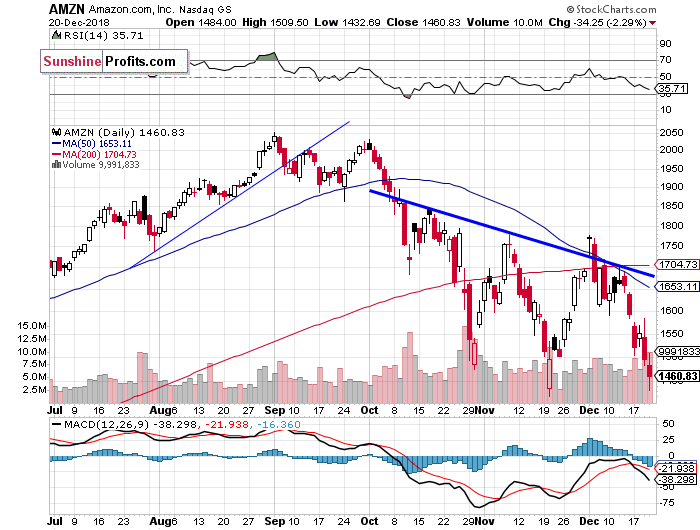
Now let's take a look at Amazon.com, Inc. stock (AMZN) daily chart. The stock bounced off the resistance level of $1,700-1,800 recently, and it got close to the support level of $1,450-1,500 again. It remained slightly above its previous low yesterday. The market continues to trade below its two-month-long downward trend line, as we can see on the daily chart:
Dow Jones Also Lower
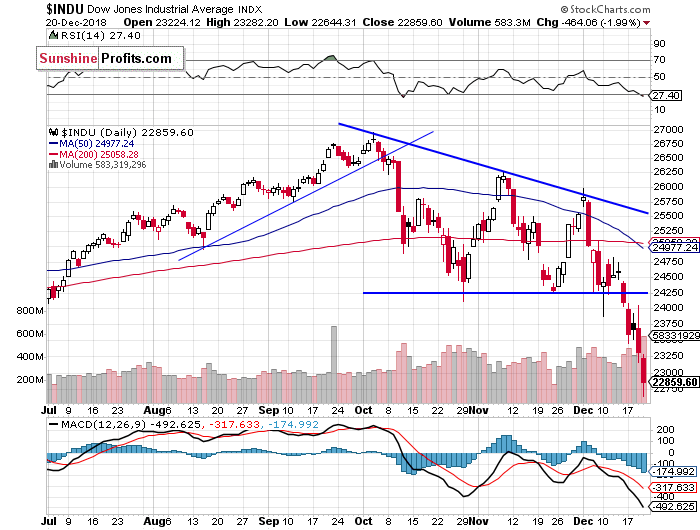
The Dow Jones Industrial Average broke below its two-month-long consolidation on Monday. The blue-chip stocks' gauge fell below the support level of 24,000 and then it continued lower. Yesterday it fell below the support level of 23,000. The potential level of support is now at 22,400-22,500, marked by some last year's fluctuations.
The S&P 500 index extended its downtrend again, as it fell the lowest since late August of 2017. The broad stock market was 17% below its September's record high. Is this a new long-term bear market or just medium-term downward correction? For now, it looks like a correction. However, there have been no confirmed positive signals so far.
Concluding, the S&P 500 index will likely open lower today. We may see an attempt at retracing some of the recent sell-off. But for now, it may only look like another dead-cat-bounce upward correction.
Trading position (short-term; our opinion): no positions are justified from the risk/reward perspective.
Thank you.
Paul Rejczak
Stock Trading Strategist
Stock Trading Alerts

