

Trading position (short-term, our opinion; levels for S&P 500 continuous futures contract): No positions are currently justified from the risk/reward point of view.
The stock market went sideways on Wednesday – is this a short-term topping pattern or just a pause before another leg up?
For in-depth technical analysis of various stocks and a recap of today's Stock Trading Alert we encourage you to watch today's video.
Video Technical Breakdown is an addition to the STA, distributed on Tuesday and Thursday along with the premium analysis, to keep you, our subscribers, well-informed with everything happening on the charts.
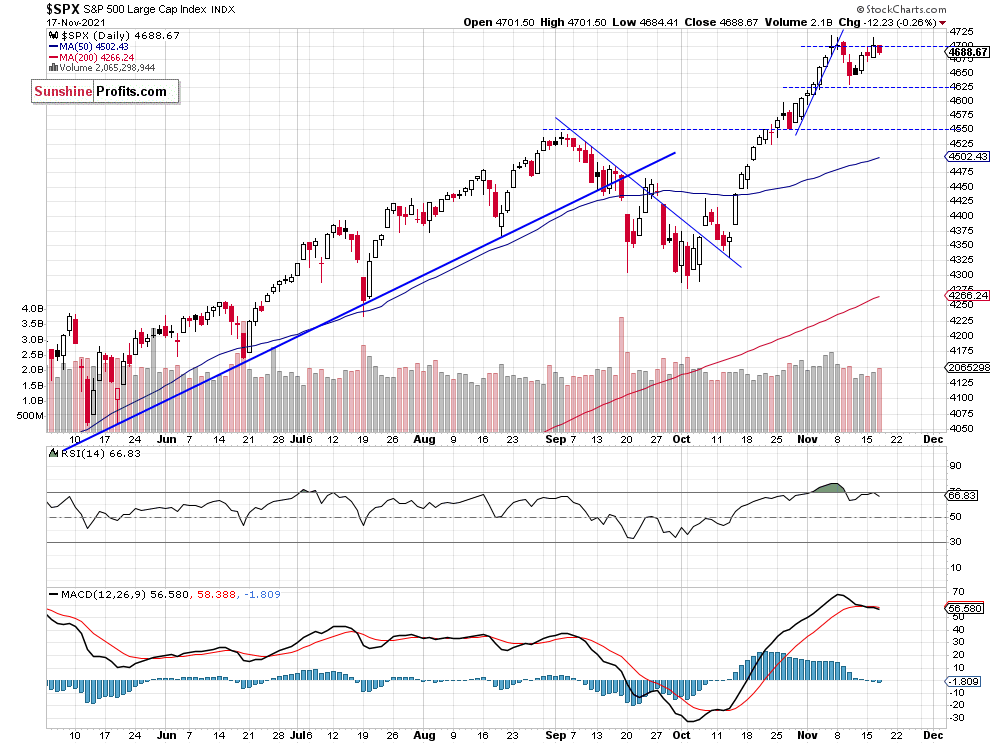
The S&P 500 index lost 0.26% on Wednesday, Nov. 17, as it retraced some of its recent advance. On Tuesday the market reached the local high of 4,714.95, and yesterday it traded 30 points below that level. Last week the index fell to the local low of 4,630.86 and it was almost 88 points or 1.86% below the record high.
The early November rally was not broad-based and it was driven by a handful of tech stocks like MSFT, NVDA, TSLA. The market seemed overbought in the short-term and it traded within a topping pattern. Then the index retraced some of that advance, as it fell the mentioned 88 points from the record high.
The nearest important support level remains at 4,630-4,650 and the next support level is at 4,600. On the other hand, the resistance level is at 4,700-4,720. The S&P 500 broke below its steep short-term upward trend line recently, as we can see on the daily chart (chart by courtesy of http://stockcharts.com):
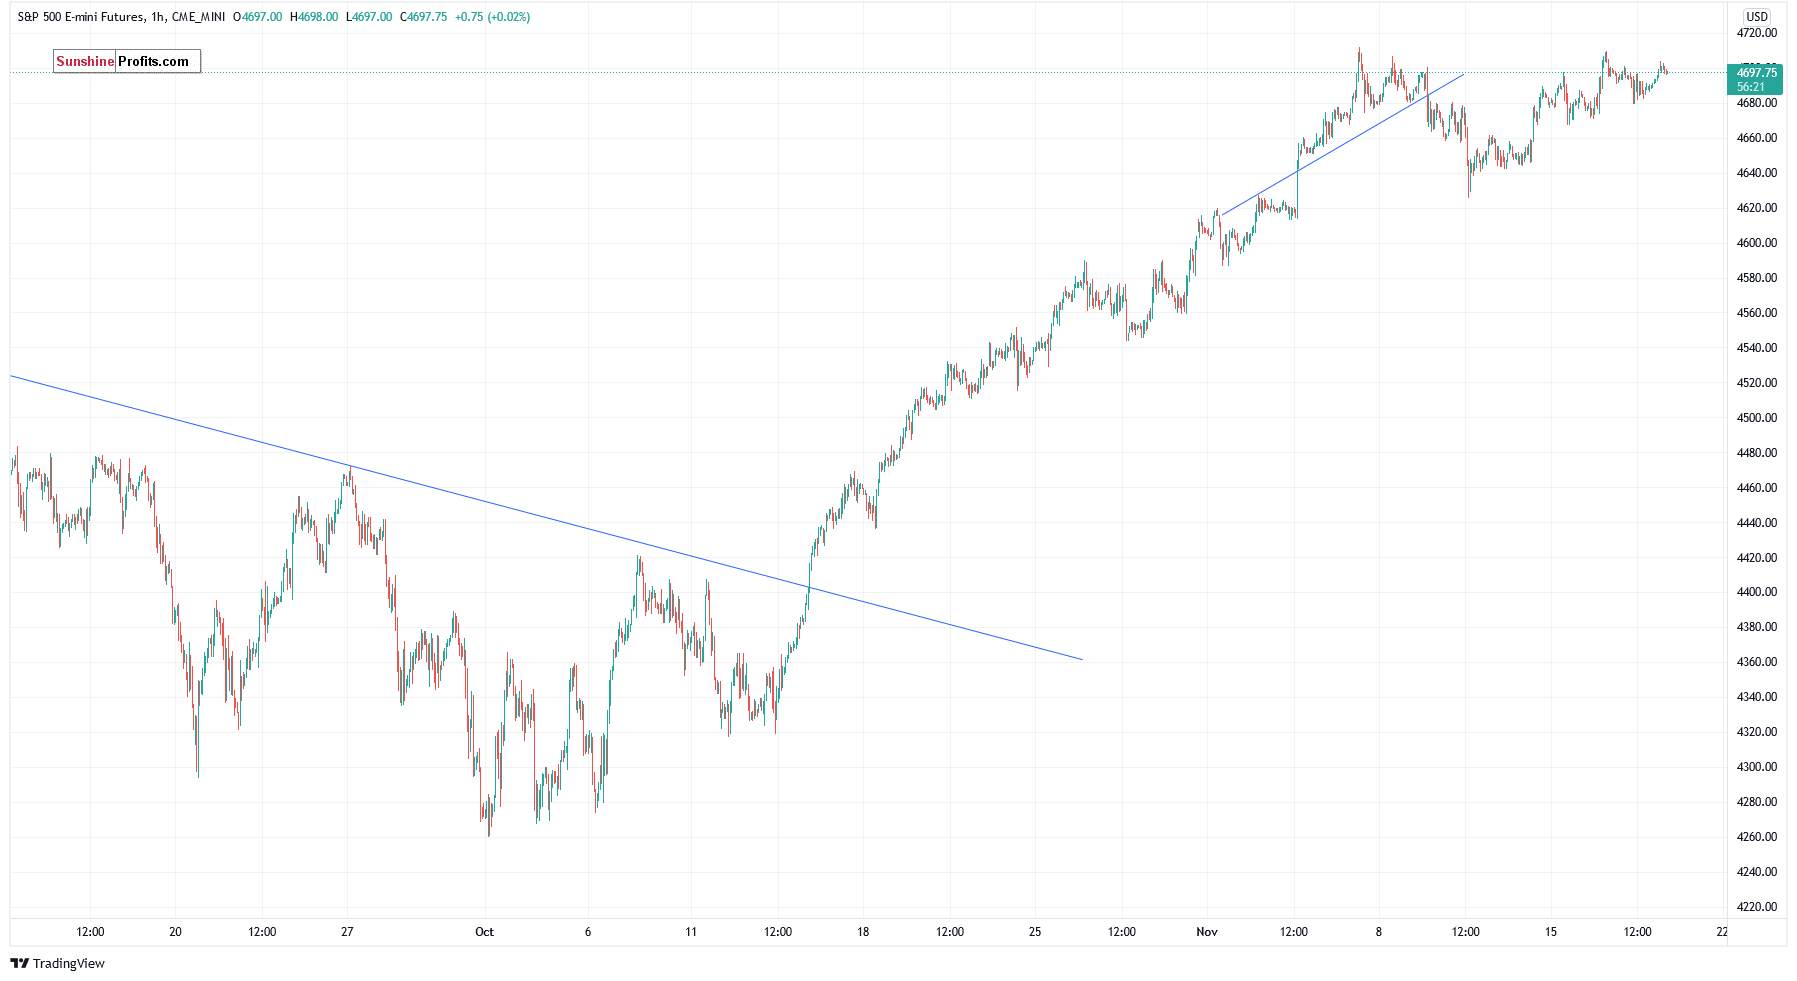
Futures Contract – Still Close to the Record High
Let’s take a look at the hourly chart of the S&P 500 futures contract. Last week the market broke below a week-long upward trend line. But on Friday it retraced most of the decline. For now, it looks like a short-term consolidation. In our opinion no positions are currently justified from the risk/reward point of view. (chart by courtesy of http://tradingview.com):
Conclusion
The S&P 500 index is expected to open 0.3% higher this morning. We will likely see some more short-term fluctuations along the 4,700 level. For now, it looks like a short-term consolidation and a flat correction within an uptrend.
Here’s the breakdown:
- The S&P 500 is fluctuating along the 4,700 level. For now, it looks like a short-term consolidation following the October-November rally.
- Still no positions are justified from the risk/reward point of view.
As always, we’ll keep you, our subscribers, well-informed.
Trading position (short-term, our opinion; levels for S&P 500 continuous futures contract): No positions are currently justified from the risk/reward point of view.
Thank you.
Paul Rejczak,
Stock Trading Strategist
Sunshine Profits: Effective Investments through Diligence and Care

